Upgrade to Pro — share decks privately, control downloads, hide ads and more …

AAGW3 - Kai Sonder - Some examples of CIMMYT’s GIS based work

CGIAR-CSI
March 21, 2013

AAGW3 - Kai Sonder - Some examples of CIMMYT’s GIS based work

CGIAR-CSI

March 21, 2013
Tweet

More Decks by CGIAR-CSI

Other Decks in Research

Transcript

  1. Some examples of CIMMYT’s GIS based work Kai Sonder GIS

    UNIT CIMMYT IFPRI, CIAT, many others Africa Agriculture GIS week Application of spatial science in African research and development Addis Ababa 12-14 March 2013
  2. Cali, Colombia El Batan, Mexico Harare, Zimbabwe Addis Ababa, Ethiopia

    New Delhi, India Tbilisi, Georgia Nairobi/Njoro, Kenya Ankara, Turkey Beijing, China Almaty, Kazakhstan Islamabad Pakistan Kabul, Afghanistan Kathmandu, Nepal Dhaka, Bangladesh CIMMYT global offices Karaj/Tehran, Iran Hyderabad India
  3. Very little donor interest for investing in wheat research and

    development High consumption in many African countries especially urban areas Food crisis 2008 riots in some countries linked to rising bread prices High foreign currency expenditures for import due to limited local production In 2010 African countries spent more than 12.5 billion US$ to import of 32 million tons of wheat
  4. Simple suitability analysis shows large potential areas for wheat production

    in some SSA countries to fill the growing gap between domestic production and consumption requirements Will such production be economically profitable than importing wheat? Suitability Ecocrop Suitability FAO GAEZ
  5. Modeling approach Biophysical part: CERES-WHEAT model from DSSAT based in

    a high performance cluster Benchmark varieties were defined for different wheat mega environments Soils files from WISE database Climate data from Worldclim fed into climate generator 10 km pixels Economic part: Transport cost model for wheat and fertilizer Import parity price comparison with internal production plus transport Net economic return was calculated for each pixel on ha basis
  6. Country Average (kg/ha) Min (kg/ha) Max (kg/ha) Angola 1055 24

    3787 Burundi 2886 921 4421 Ethiopia 2348 0 10190 Kenya 3087 0 6662 Madagascar 2175 191 8018 Mozambique 1052 209 3464 Rwanda 3681 0 5555 Tanzania 1986 95 5021 DRC 1655 0 5941 Uganda 2861 581 9815 Zambia 1462 414 3614 Zimbabwe 911 169 3677 Panel A1: Yield under low intensification
  7. Country Average (kg/ha) Min (kg/ha) Max (kg/ha) Angola 1055 24

    3787 Burundi 2886 921 4421 Ethiopia 2348 0 10190 Kenya 3087 0 6662 Madagascar 2175 191 8018 Mozambique 1052 209 3464 Rwanda 3681 0 5555 Tanzania 1986 95 5021 DRC 1655 0 5941 Uganda 2861 581 9815 Zambia 1462 414 3614 Zimbabwe 911 169 3677 Panel A1: Yield under low intensification
  8. Country Average (kg/ha) Min (kg/ha) Max (kg/ha) Angola 1542 22

    4238 Burundi 3208 1022 4933 Ethiopia 2972 0 10572 Kenya 3410 0 6881 Madagascar 2605 470 9465 Mozambique 1287 366 4242 Rwanda 3986 0 5644 Tanzania 2219 79 5308 DRC 2059 0 6113 Uganda 3383 1068 10786 Zambia 1933 804 4298 Zimbabwe 1394 380 4566 Panel B1:Yield under medium intensification
  9. Country Average (kg/ha) Min (kg/ha) Max (kg/ha) Angola 1886 23

    4422 Burundi 3395 967 4987 Ethiopia 3395 0 10649 Kenya 3617 0 6855 Madagascar 2874 529 10126 Mozambique 1444 451 4884 Rwanda 4151 0 5671 Tanzania 2372 94 5427 DRC 2325 0 6002 Uganda 3728 1188 11364 Zambia 2252 964 5239 Zimbabwe 1744 461 5403 Panel C1:Yield under High intensification
  10. Panel A2:NER under low intensification Country Average NER (US$/ha) Pixels

    with positive NERs (%) Angola 195 22 Burundi 905 100 Ethiopia 618 71 Kenya 802 91 Madagascar 524 73 Mozambique 111 15 Rwanda 1314 96 Tanzania 347 68 DRC 270 53 Uganda 742 99 Zambia 301 63 Zimbabwe 250 35
  11. Panel B2:NER under medium intensification Country Average NER (US$/ha) Pixels

    with positive NERs (%) Angola 250 28 Burundi 1010 100 Ethiopia 670 88 Kenya 885 92 Madagascar 651 76 Mozambique 128 19 Rwanda 1416 96 Tanzania 371 70 DRC 275 71 Uganda 898 100 Zambia 385 80 Zimbabwe 271 58
  12. Panel C2: NER under high intensification Country Average NER (US$/ha)

    Pixels with positive NERs (%) Angola 275 32 Burundi 1061 100 Ethiopia 771 90 Kenya 931 92 Madagascar 731 76 Mozambique 145 21 Rwanda 1461 96 Tanzania 384 71 DRC 302 76 Uganda 994 100 Zambia 444 86 Zimbabwe 309 76
  13. Link to policy = impact? Available at: http://conferences.cimmyt.org/index.php/en/component/docman/doc_download/788-report-africas-wheat-potential-embargo Results from

    this were presented to wheat research community in Africa and policy makers in a conference in Addis Ababa in October 2012 http://conferences.cimmyt.org/index.php/en/wheat-for-food-security-in-africa
  14. Project was commissioned by Howard Buffet Foundation to Evaluate predicted

    impact of climate change on maize bean systems in 4 Central American countries: Guatemala, Honduras, Nicaragua, El Salvador Project was carried out coordinated by CRS carried out by CIAT and CIMMYT Biophysical and socioeconomic combination but focused on climate change Report focused on adaptation strategies
  15. Economic losses– Maize (2020s) 33,950 119,201 136,088 38,769 10,333 39,431

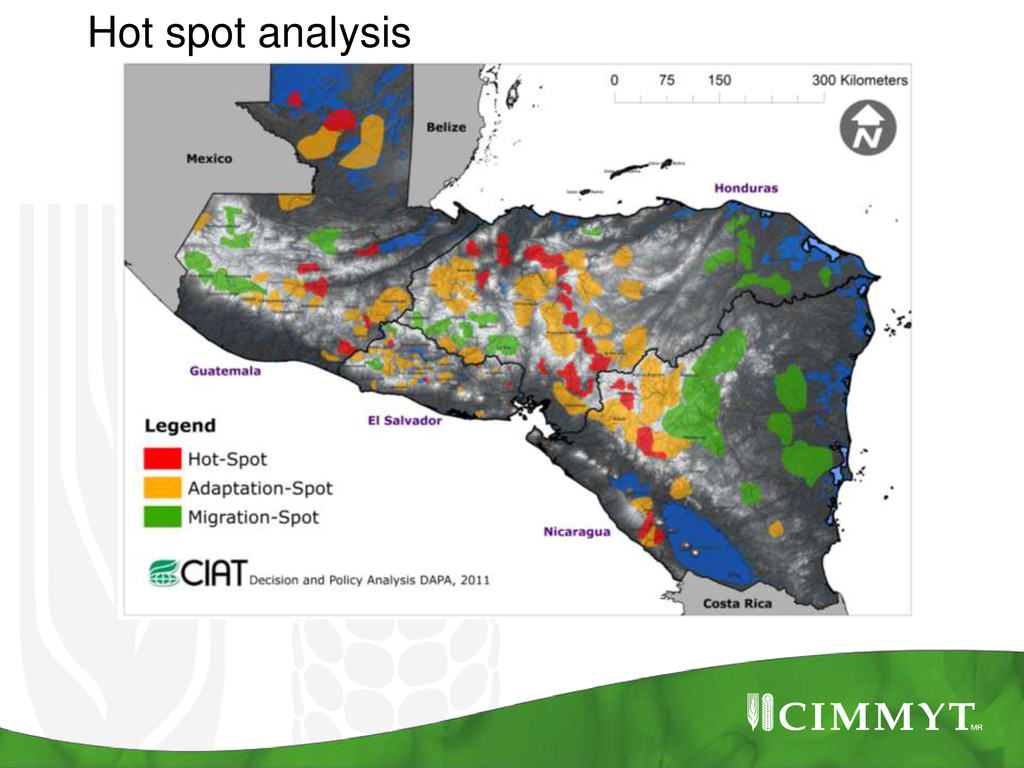
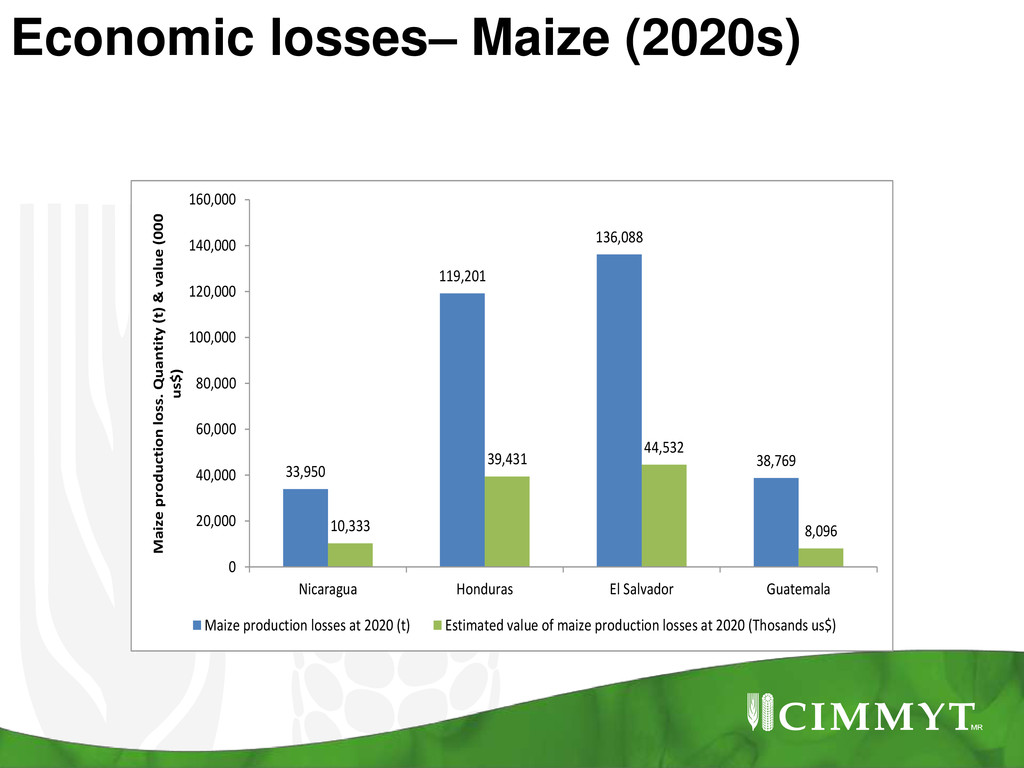
    44,532 8,096 0 20,000 40,000 60,000 80,000 100,000 120,000 140,000 160,000 Nicaragua Honduras El Salvador Guatemala Maize production loss. Quantity (t) & value (000 us$) Maize production losses at 2020 (t) Estimated value of maize production losses at 2020 (Thosands us$)
  16. Economic impact – total (2020s) 17,476 45,623 50,709 8,622 0

    10,000 20,000 30,000 40,000 50,000 60,000 Nicaragua Honduras El Salvador Guatemala Maize/beans value of production losses (000 us$) Estimated value of maize&beans production losses at 2020 (us$)
  17. Link to policy = impact? Results from this were presented

    to maize and bean research communities in 4 project countries Africa and the ministers of Agriculture in a series of national meetings. Will go into national adaptation strategies. http://www.crsprogramquality.org/storage/pubs/agenv/climate-change-maize-beans-full-report.pdf