Developing Countries Prepared by Thomas W. Hertel Purdue University Based on collaborations with Alla Golub and Zekarias Hussein (Purdue), Ben Henderson and Pierre Gerber (FAO), Steven Rose (EPRI) and Brent Sohngen (Ohio State) Keynote Presentation at the African Agriculture GIS Week Addis Ababa, Ethiopia, March 13, 2013
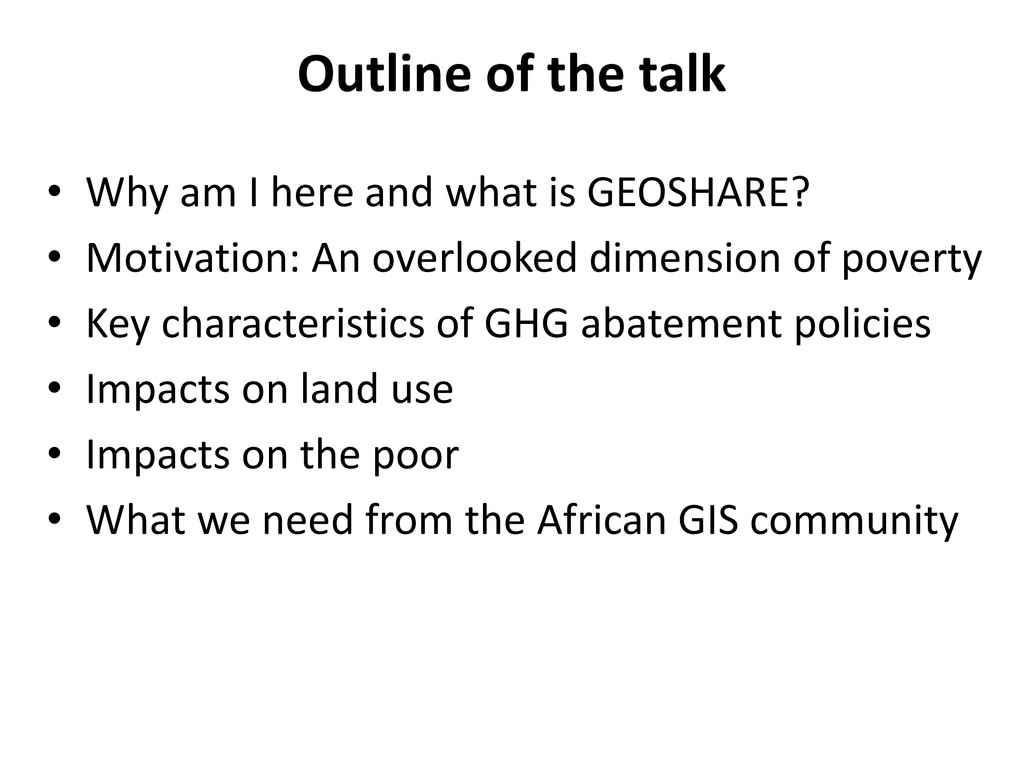
what is GEOSHARE? • Motivation: An overlooked dimension of poverty • Key characteristics of GHG abatement policies • Impacts on land use • Impacts on the poor • What we need from the African GIS community
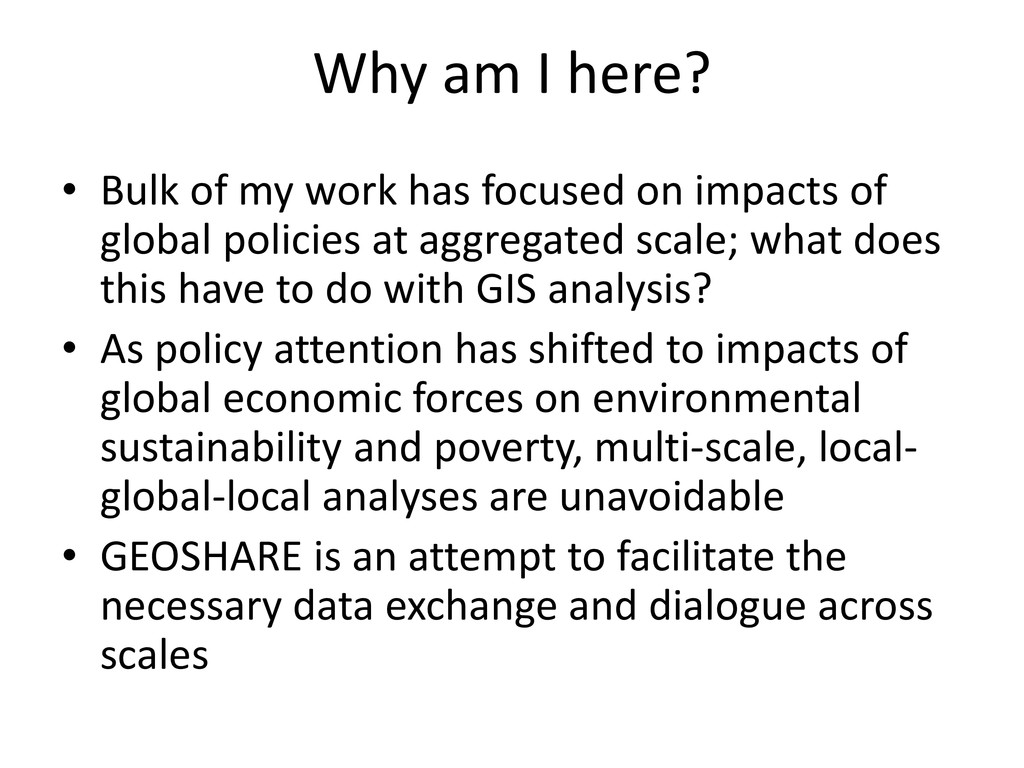
focused on impacts of global policies at aggregated scale; what does this have to do with GIS analysis? • As policy attention has shifted to impacts of global economic forces on environmental sustainability and poverty, multi-scale, local- global-local analyses are unavoidable • GEOSHARE is an attempt to facilitate the necessary data exchange and dialogue across scales
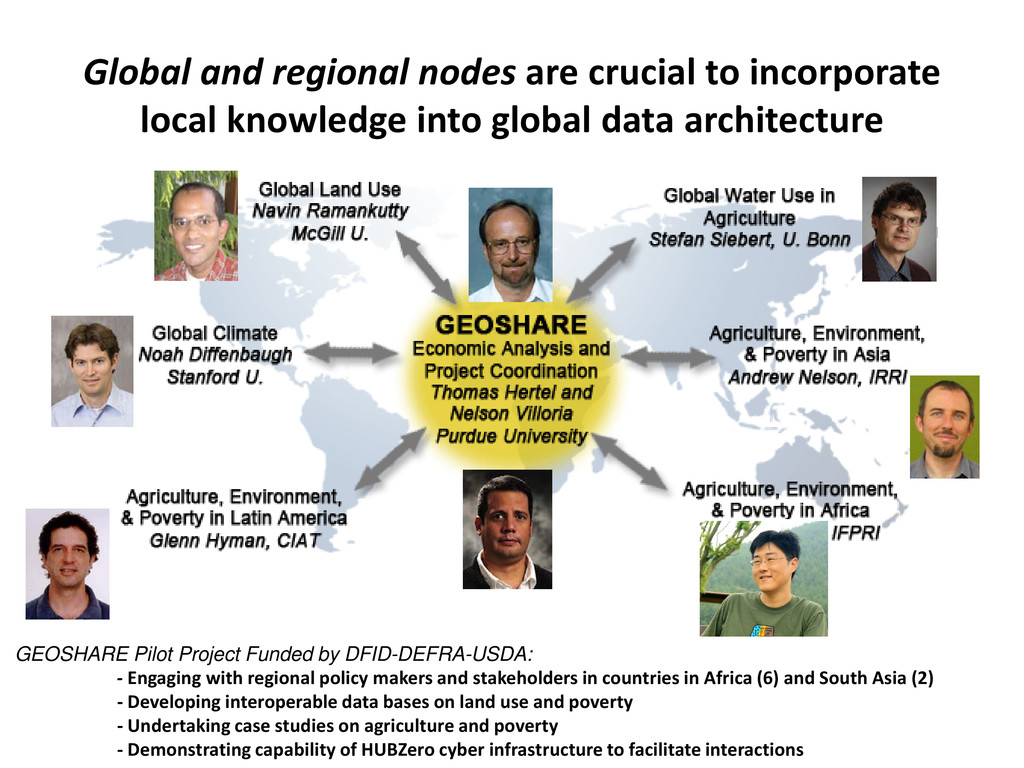
into global data architecture GEOSHARE Pilot Project Funded by DFID-DEFRA-USDA: - Engaging with regional policy makers and stakeholders in countries in Africa (6) and South Asia (2) - Developing interoperable data bases on land use and poverty - Undertaking case studies on agriculture and poverty - Demonstrating capability of HUBZero cyber infrastructure to facilitate interactions
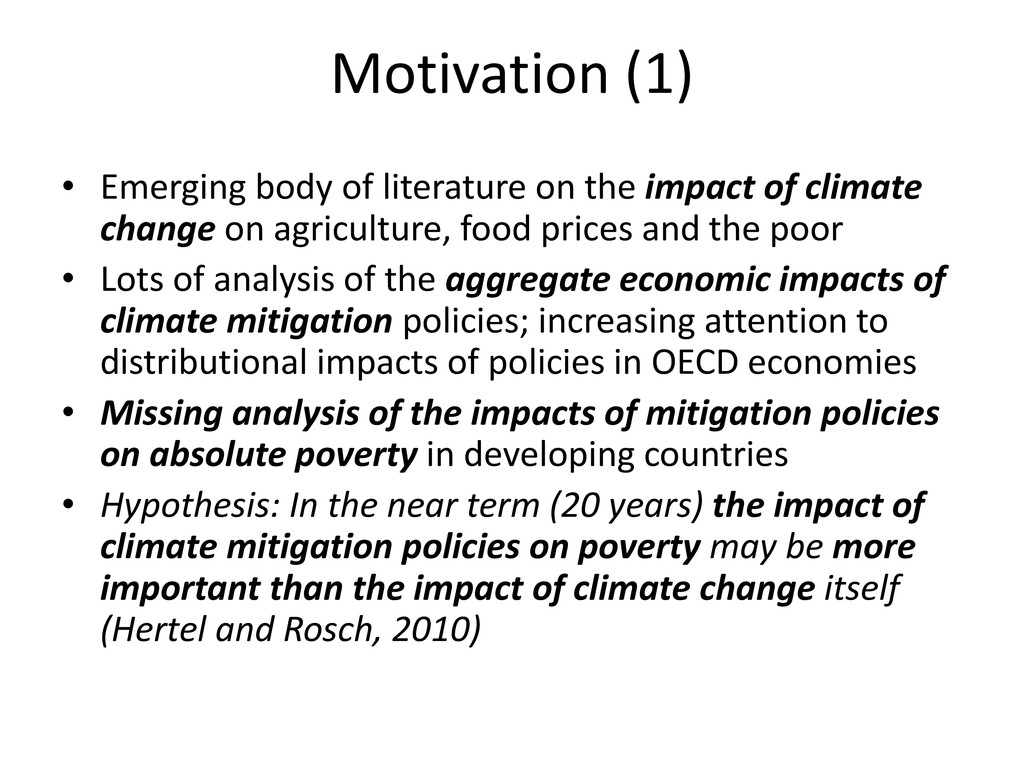
of climate change on agriculture, food prices and the poor • Lots of analysis of the aggregate economic impacts of climate mitigation policies; increasing attention to distributional impacts of policies in OECD economies • Missing analysis of the impacts of mitigation policies on absolute poverty in developing countries • Hypothesis: In the near term (20 years) the impact of climate mitigation policies on poverty may be more important than the impact of climate change itself (Hertel and Rosch, 2010)
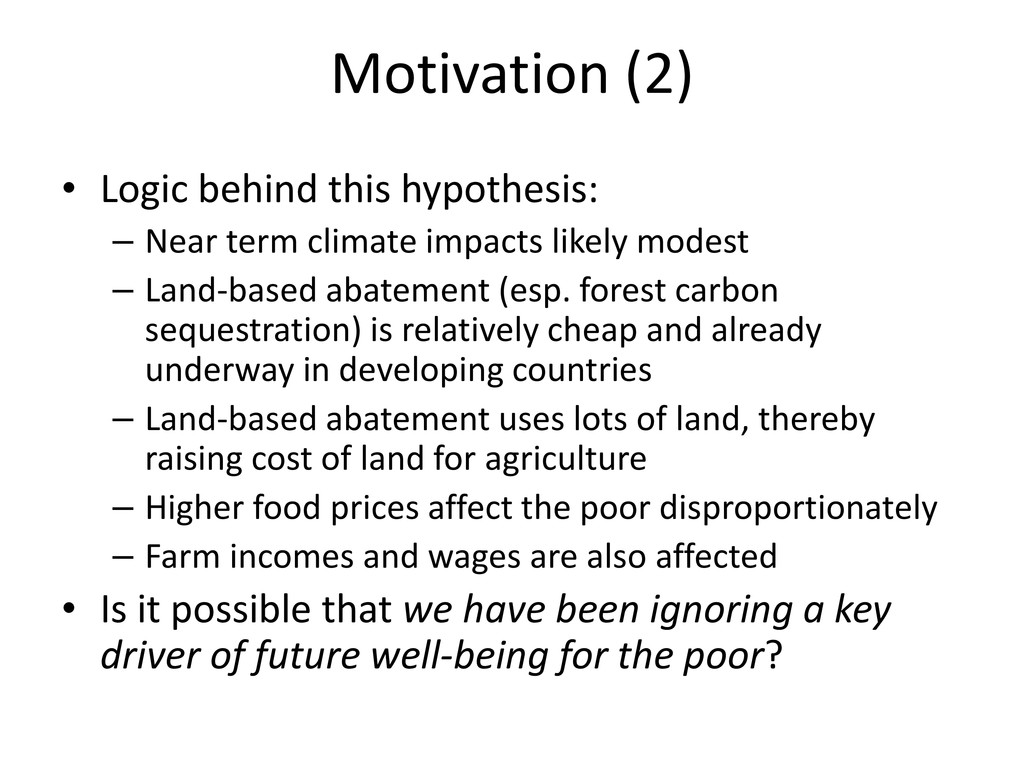
climate impacts likely modest – Land-based abatement (esp. forest carbon sequestration) is relatively cheap and already underway in developing countries – Land-based abatement uses lots of land, thereby raising cost of land for agriculture – Higher food prices affect the poor disproportionately – Farm incomes and wages are also affected • Is it possible that we have been ignoring a key driver of future well-being for the poor?
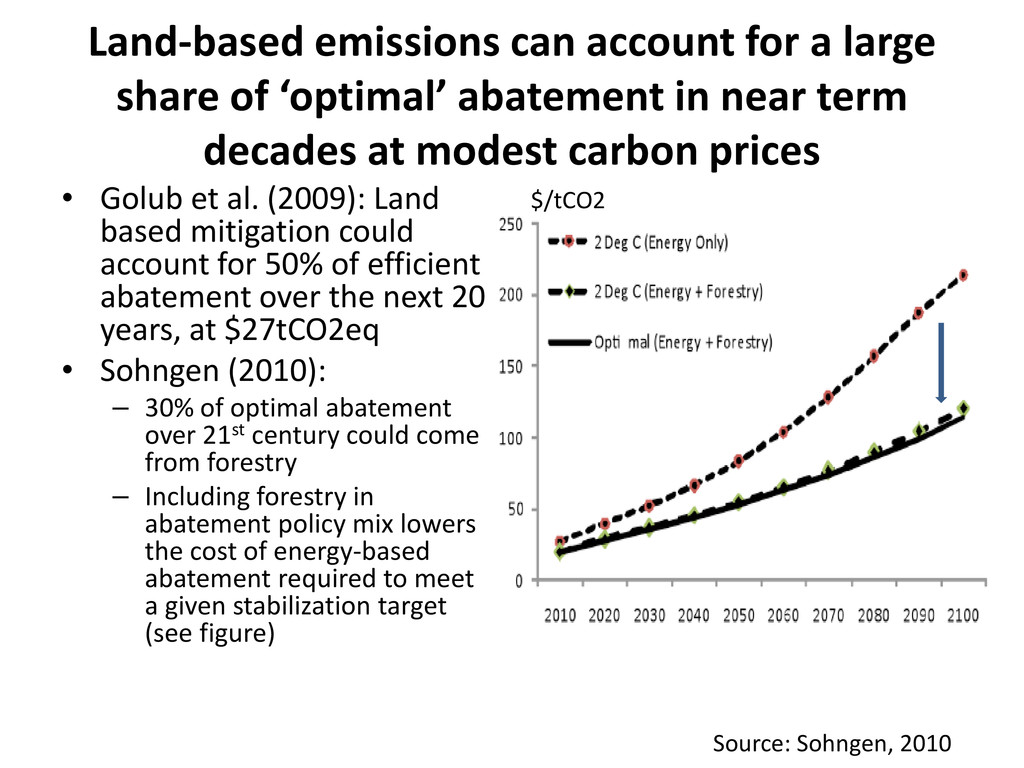
abatement in near term decades at modest carbon prices • Golub et al. (2009): Land based mitigation could account for 50% of efficient abatement over the next 20 years, at $27tCO2eq • Sohngen (2010): – 30% of optimal abatement over 21st century could come from forestry – Including forestry in abatement policy mix lowers the cost of energy-based abatement required to meet a given stabilization target (see figure) Source: Sohngen, 2010 $/tCO2
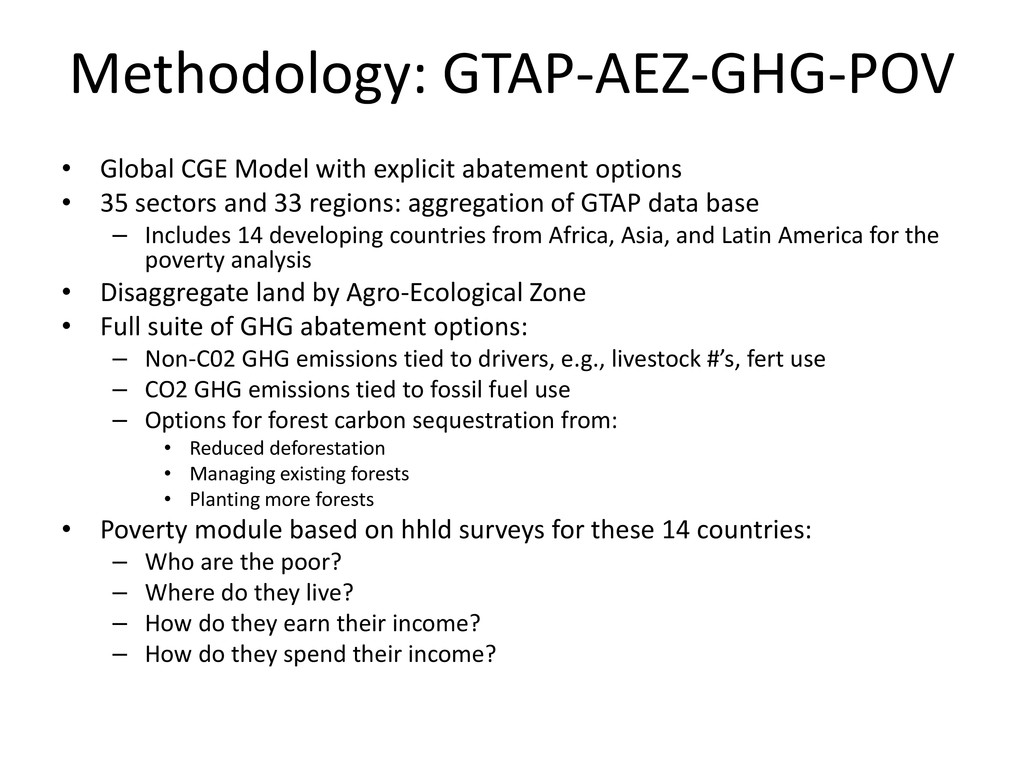
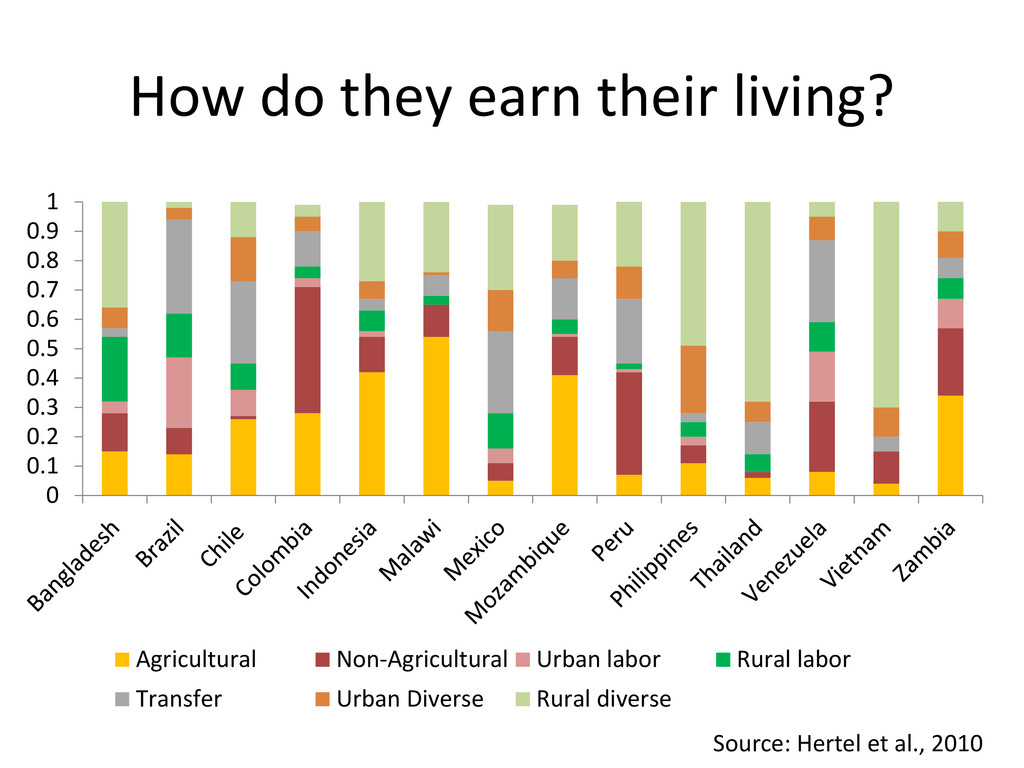
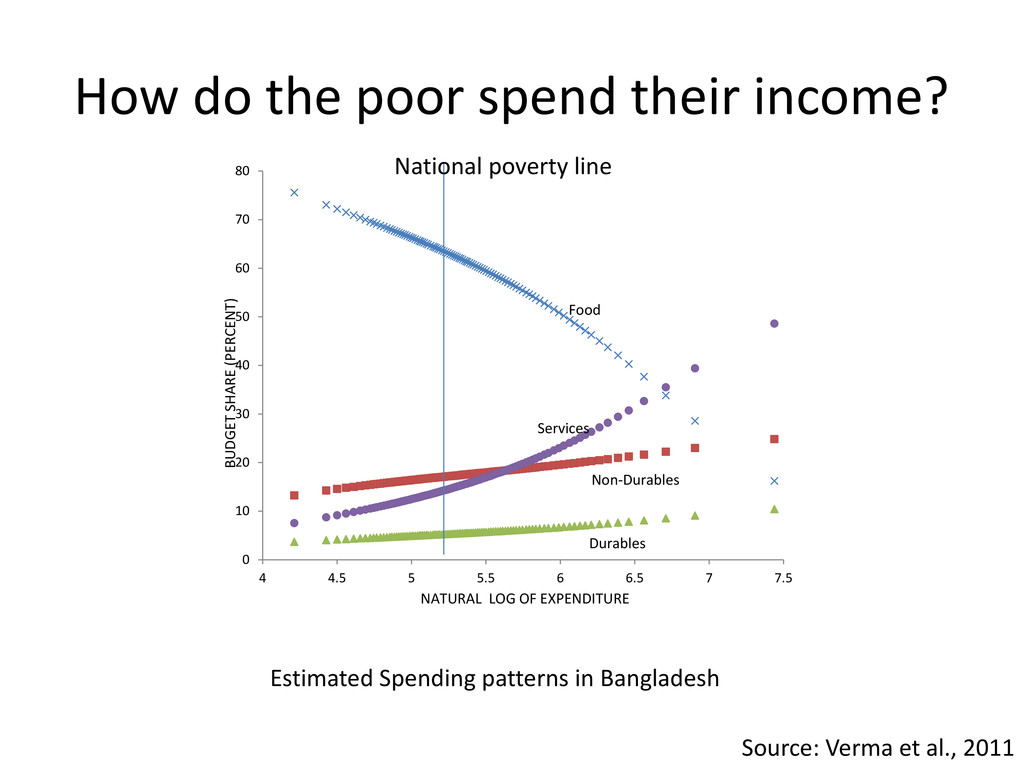
• 35 sectors and 33 regions: aggregation of GTAP data base – Includes 14 developing countries from Africa, Asia, and Latin America for the poverty analysis • Disaggregate land by Agro-Ecological Zone • Full suite of GHG abatement options: – Non-C02 GHG emissions tied to drivers, e.g., livestock #’s, fert use – CO2 GHG emissions tied to fossil fuel use – Options for forest carbon sequestration from: • Reduced deforestation • Managing existing forests • Planting more forests • Poverty module based on hhld surveys for these 14 countries: – Who are the poor? – Where do they live? – How do they earn their income? – How do they spend their income?
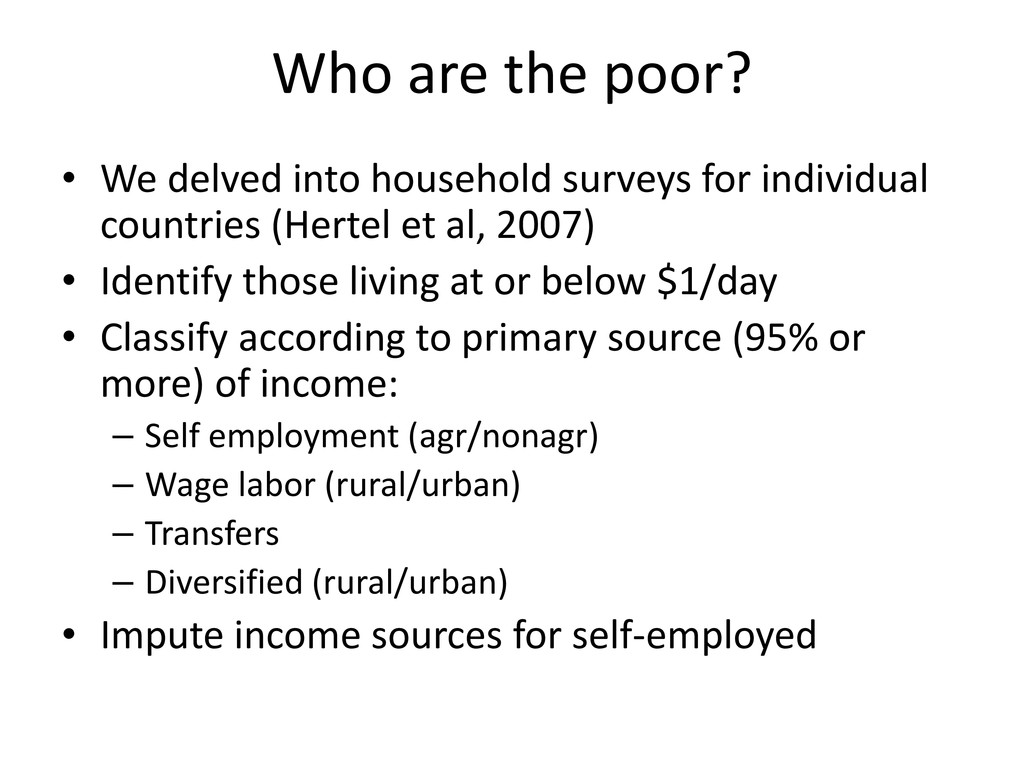
for individual countries (Hertel et al, 2007) • Identify those living at or below $1/day • Classify according to primary source (95% or more) of income: – Self employment (agr/nonagr) – Wage labor (rural/urban) – Transfers – Diversified (rural/urban) • Impute income sources for self-employed
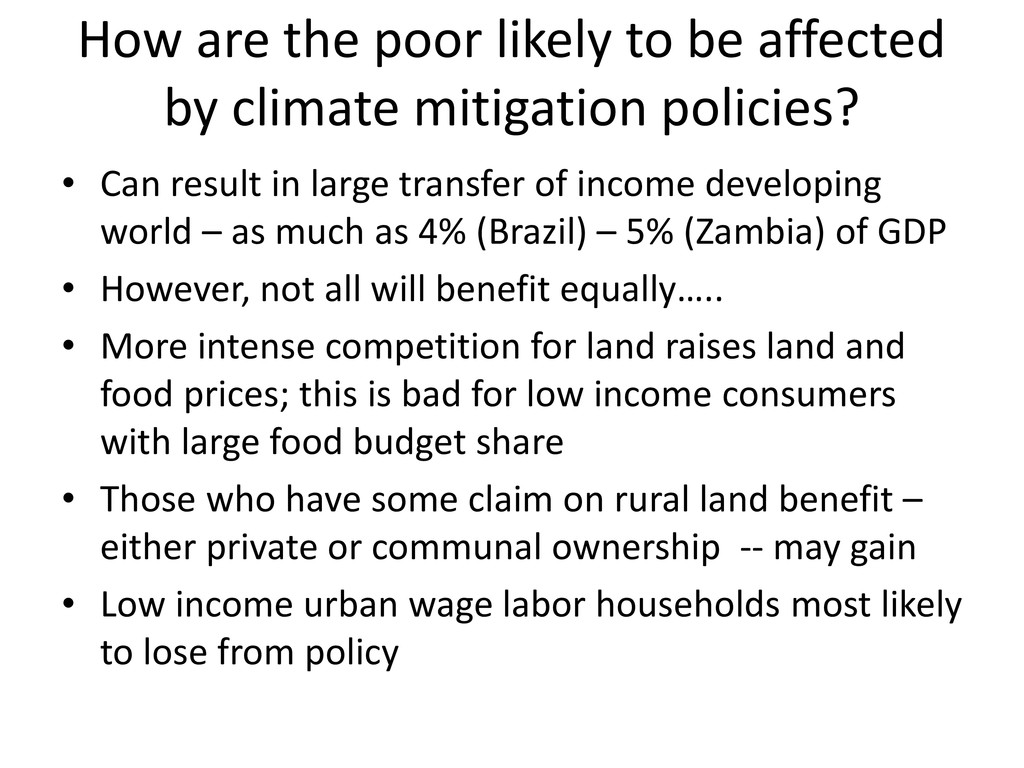
mitigation policies? • Can result in large transfer of income developing world – as much as 4% (Brazil) – 5% (Zambia) of GDP • However, not all will benefit equally….. • More intense competition for land raises land and food prices; this is bad for low income consumers with large food budget share • Those who have some claim on rural land benefit – either private or communal ownership -- may gain • Low income urban wage labor households most likely to lose from policy
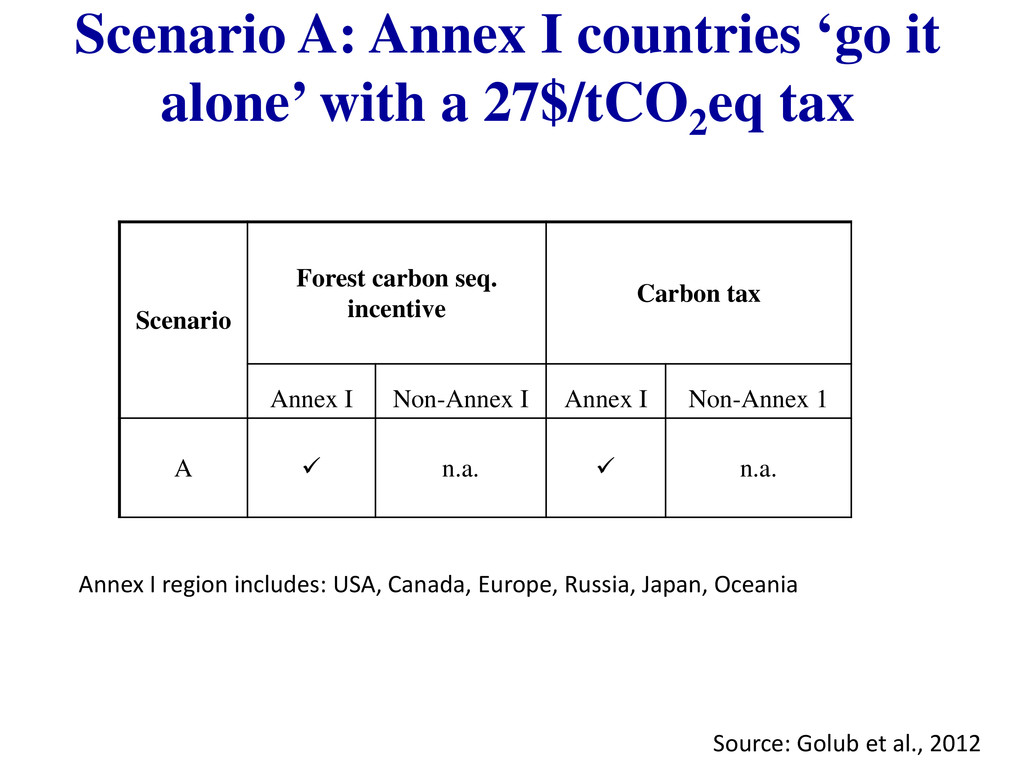
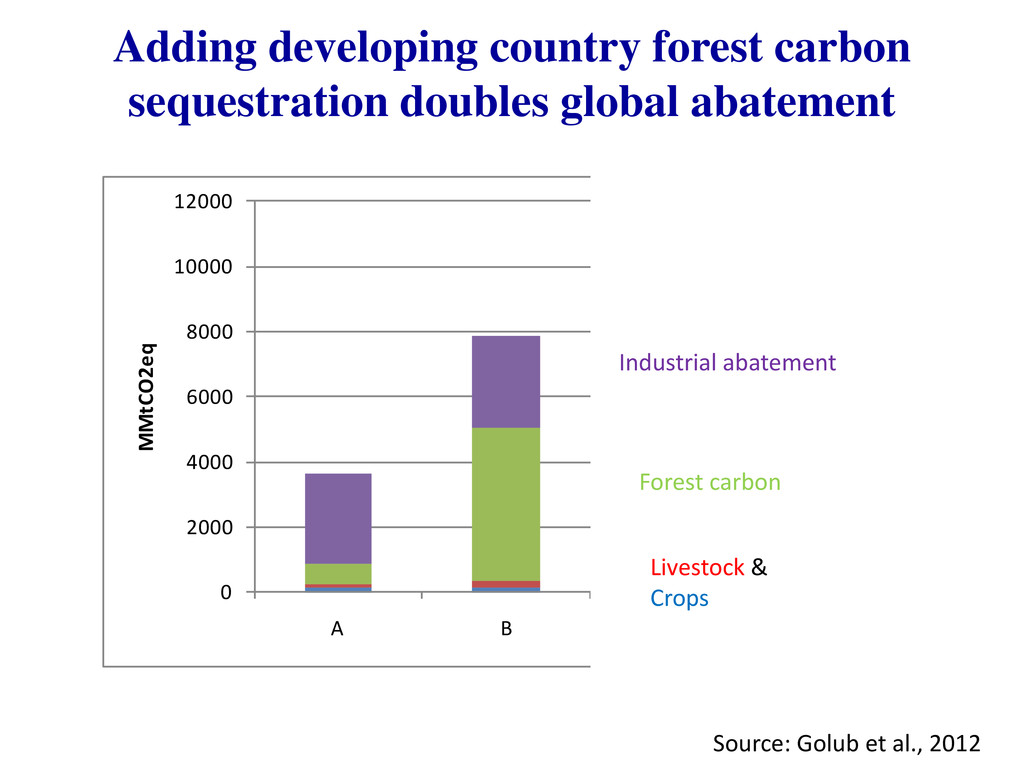
27$/tCO2 eq tax Scenario Forest carbon seq. incentive Carbon tax Annex I Non-Annex I Annex I Non-Annex 1 A n.a. n.a. Annex I region includes: USA, Canada, Europe, Russia, Japan, Oceania Source: Golub et al., 2012
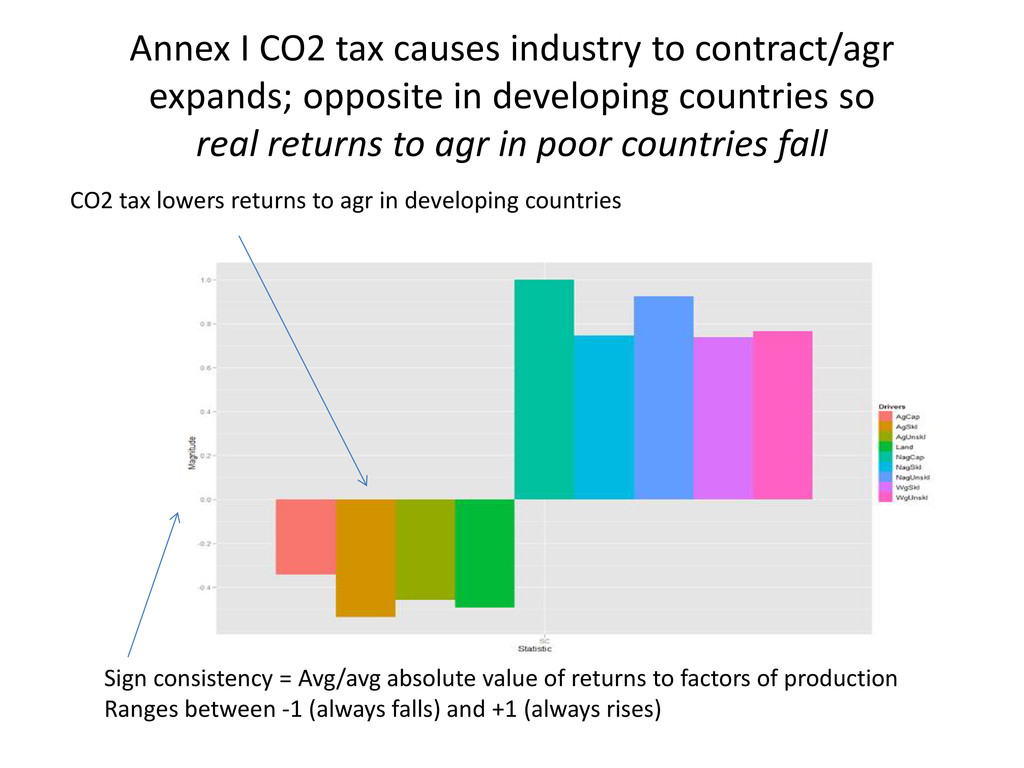
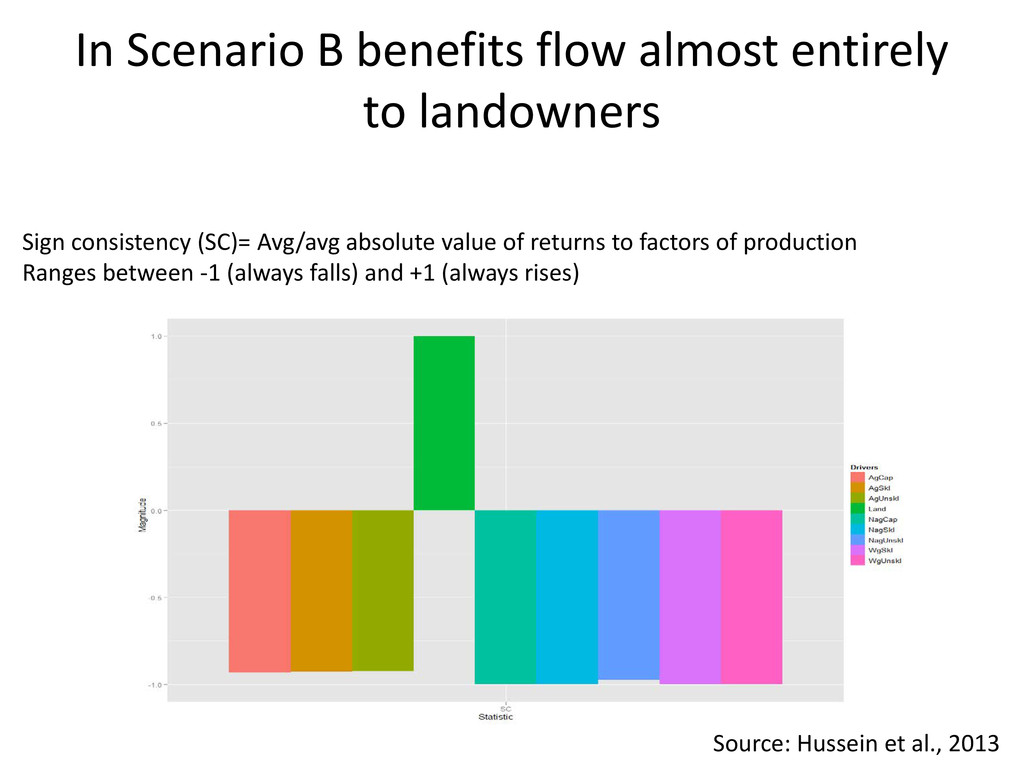
in developing countries so real returns to agr in poor countries fall CO2 tax lowers returns to agr in developing countries Sign consistency = Avg/avg absolute value of returns to factors of production Ranges between -1 (always falls) and +1 (always rises)
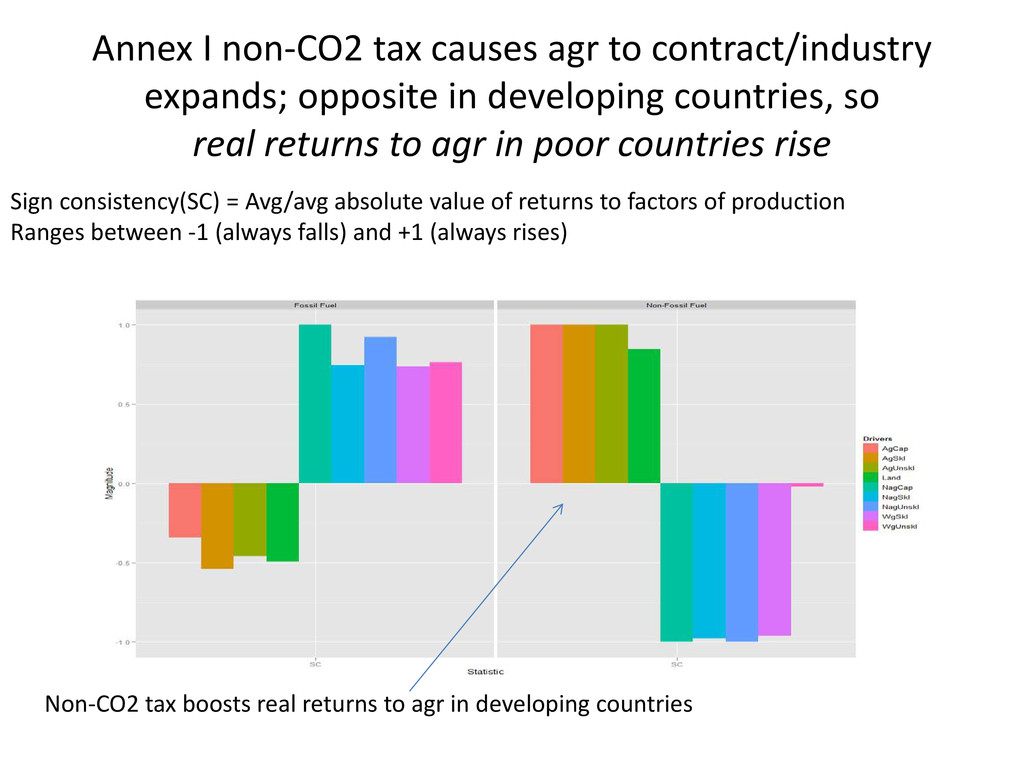
in developing countries, so real returns to agr in poor countries rise Non-CO2 tax boosts real returns to agr in developing countries Sign consistency(SC) = Avg/avg absolute value of returns to factors of production Ranges between -1 (always falls) and +1 (always rises)
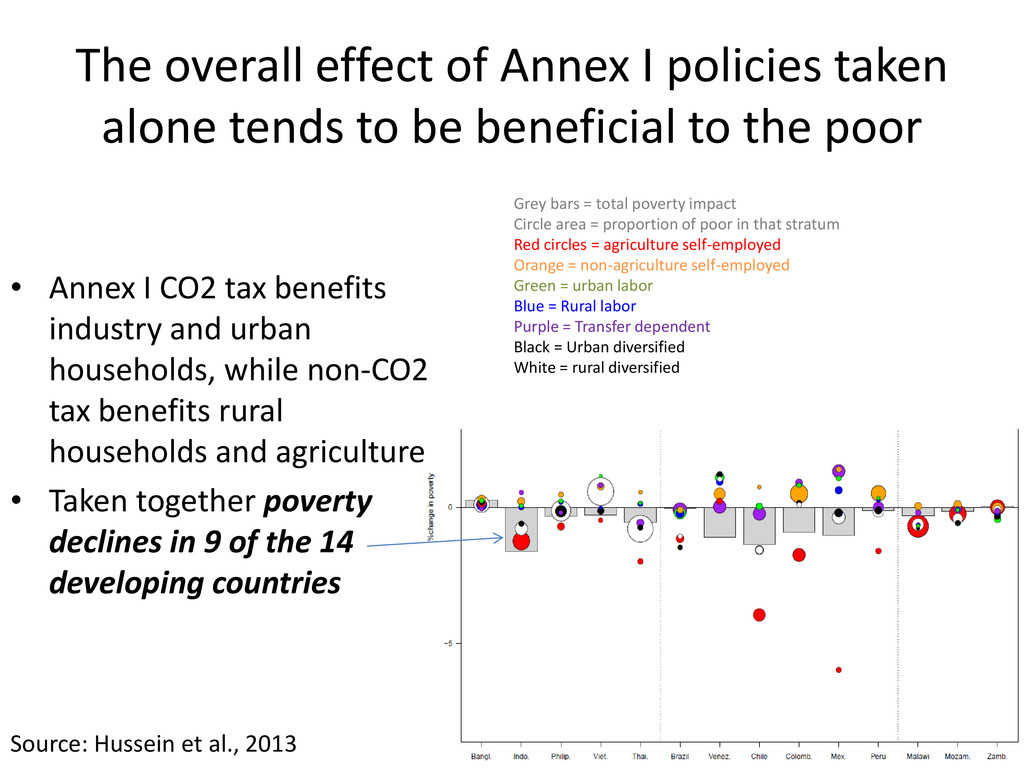
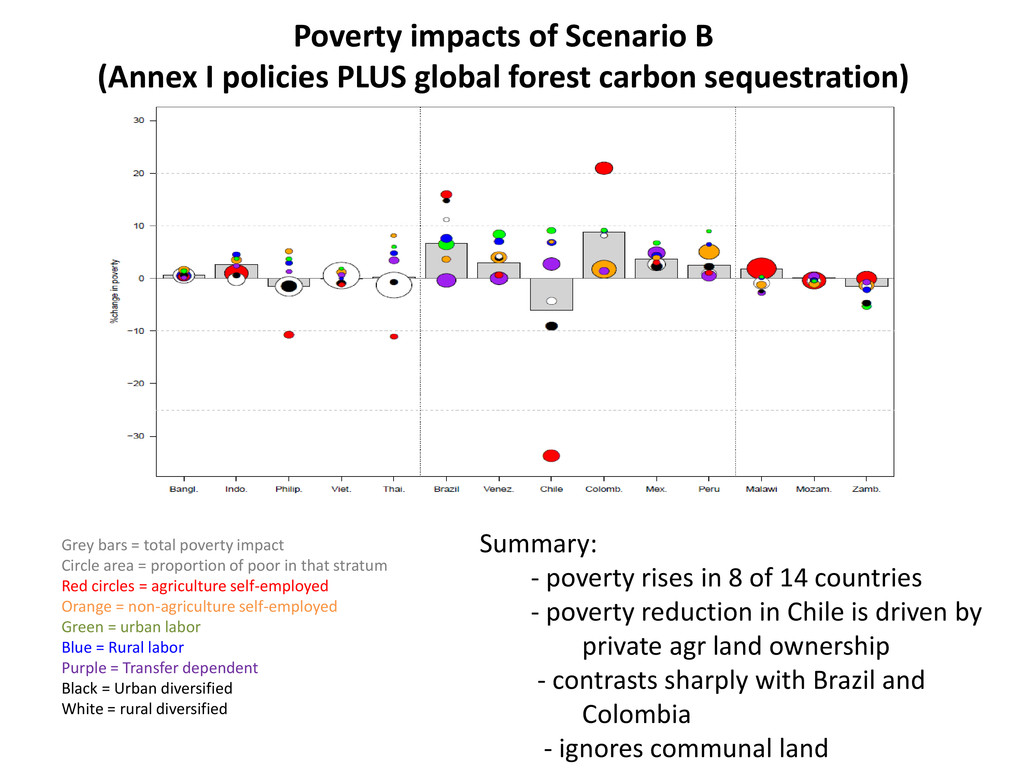
to be beneficial to the poor • Annex I CO2 tax benefits industry and urban households, while non-CO2 tax benefits rural households and agriculture • Taken together poverty declines in 9 of the 14 developing countries Source: Hussein et al., 2013 Grey bars = total poverty impact Circle area = proportion of poor in that stratum Red circles = agriculture self-employed Orange = non-agriculture self-employed Green = urban labor Blue = Rural labor Purple = Transfer dependent Black = Urban diversified White = rural diversified
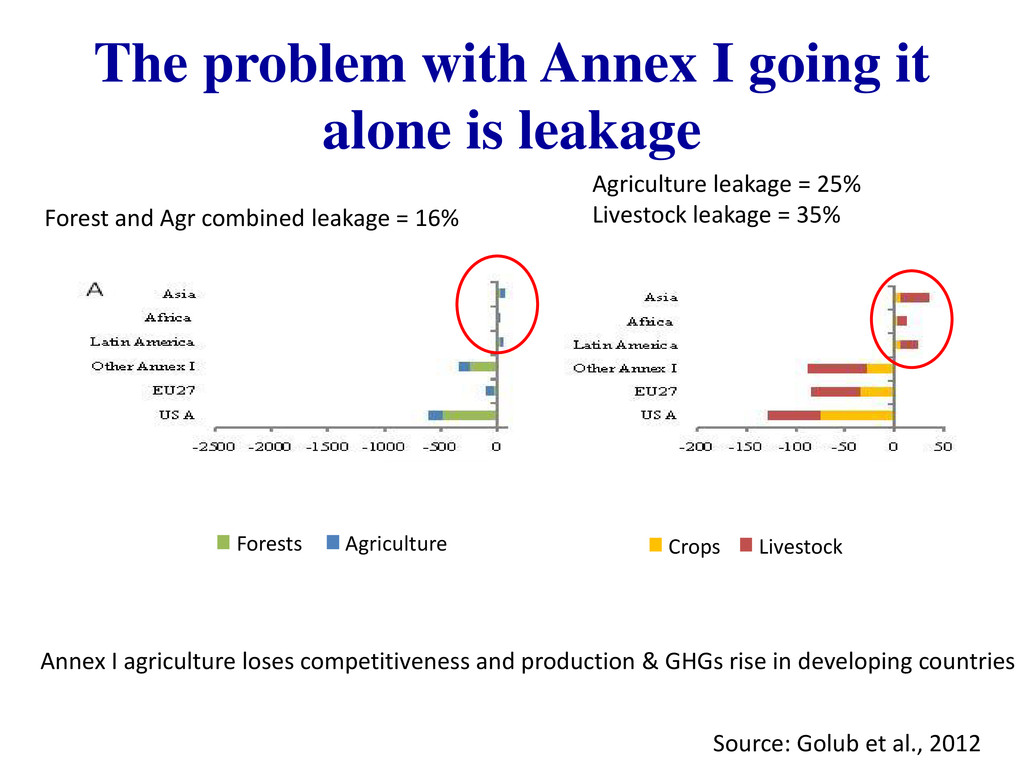
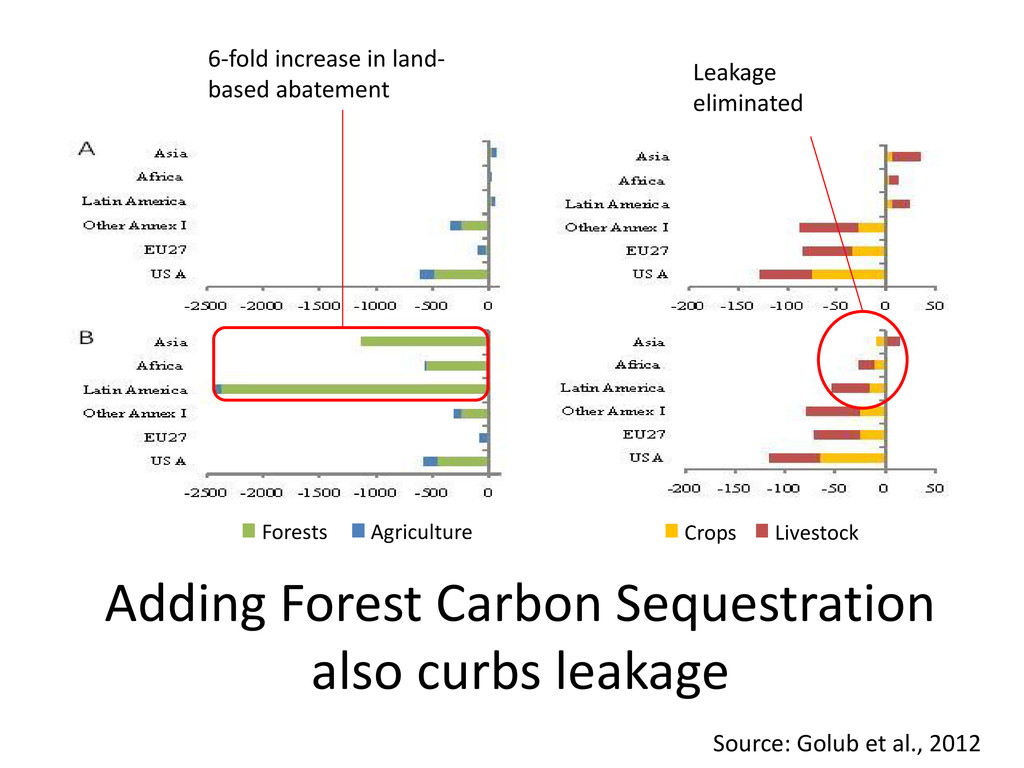
= 35% Forest and Agr combined leakage = 16% The problem with Annex I going it alone is leakage Annex I agriculture loses competitiveness and production & GHGs rise in developing countries Source: Golub et al., 2012
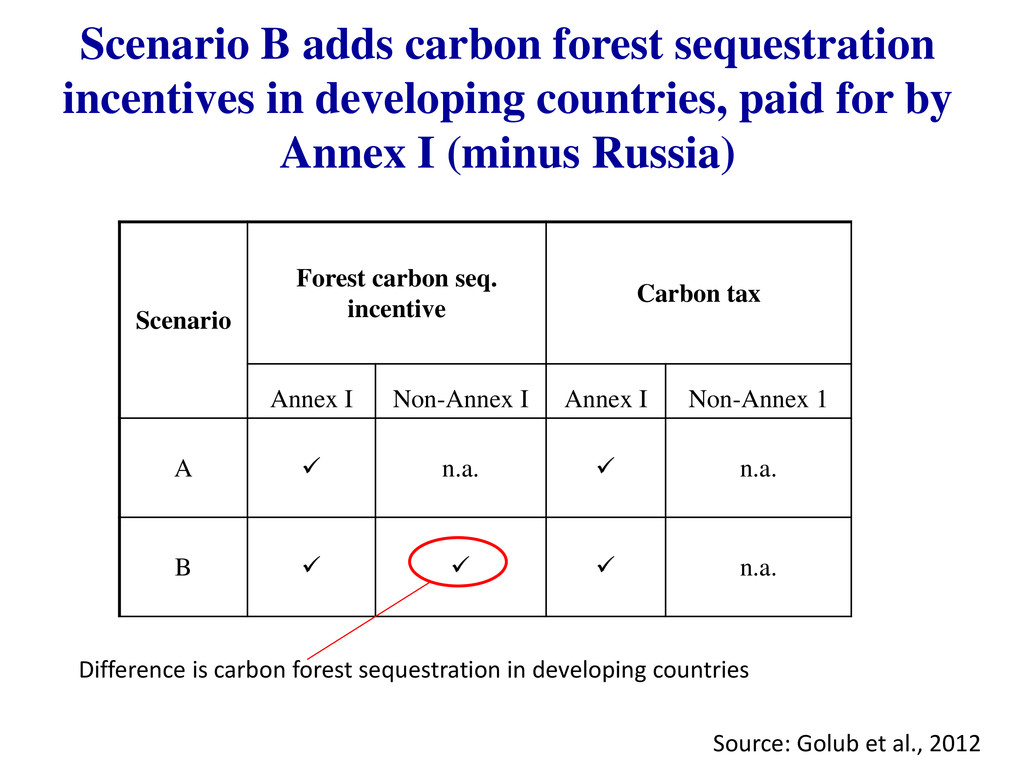
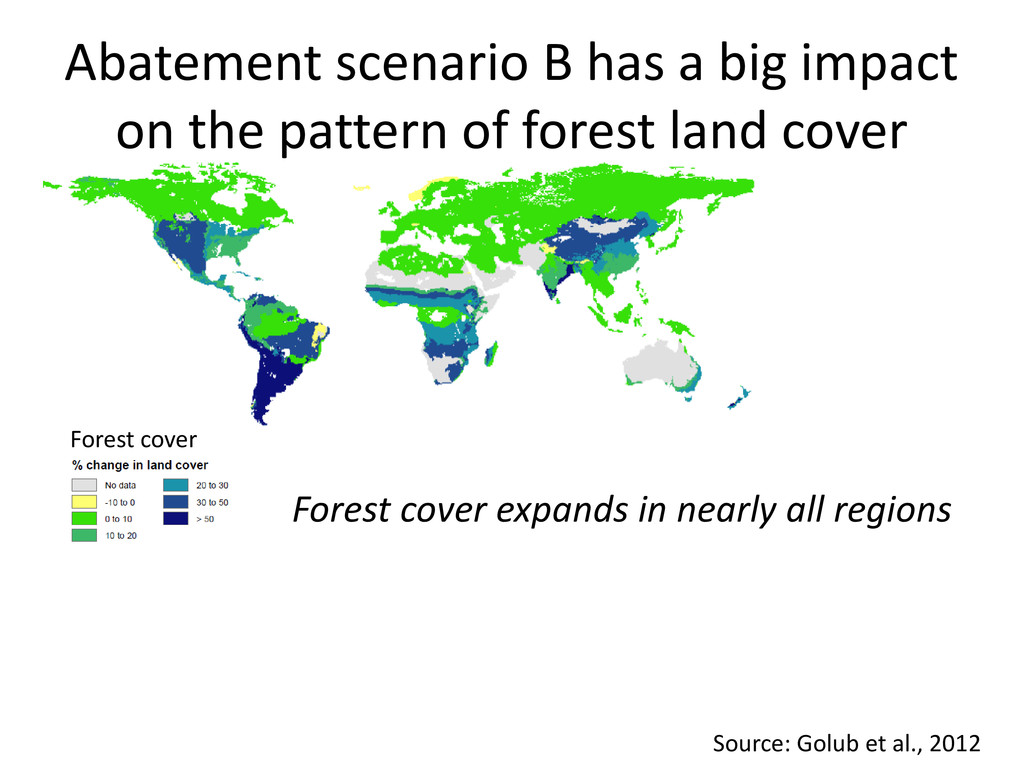
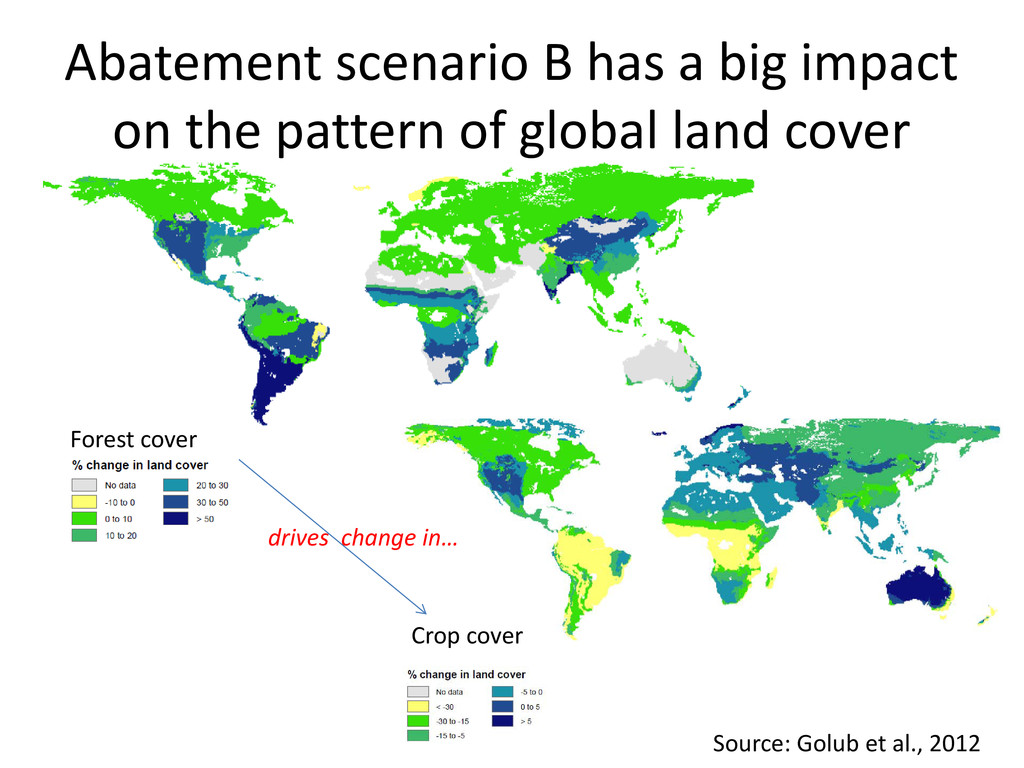
paid for by Annex I (minus Russia) Scenario Forest carbon seq. incentive Carbon tax Annex I Non-Annex I Annex I Non-Annex 1 A n.a. n.a. B n.a. Difference is carbon forest sequestration in developing countries Source: Golub et al., 2012
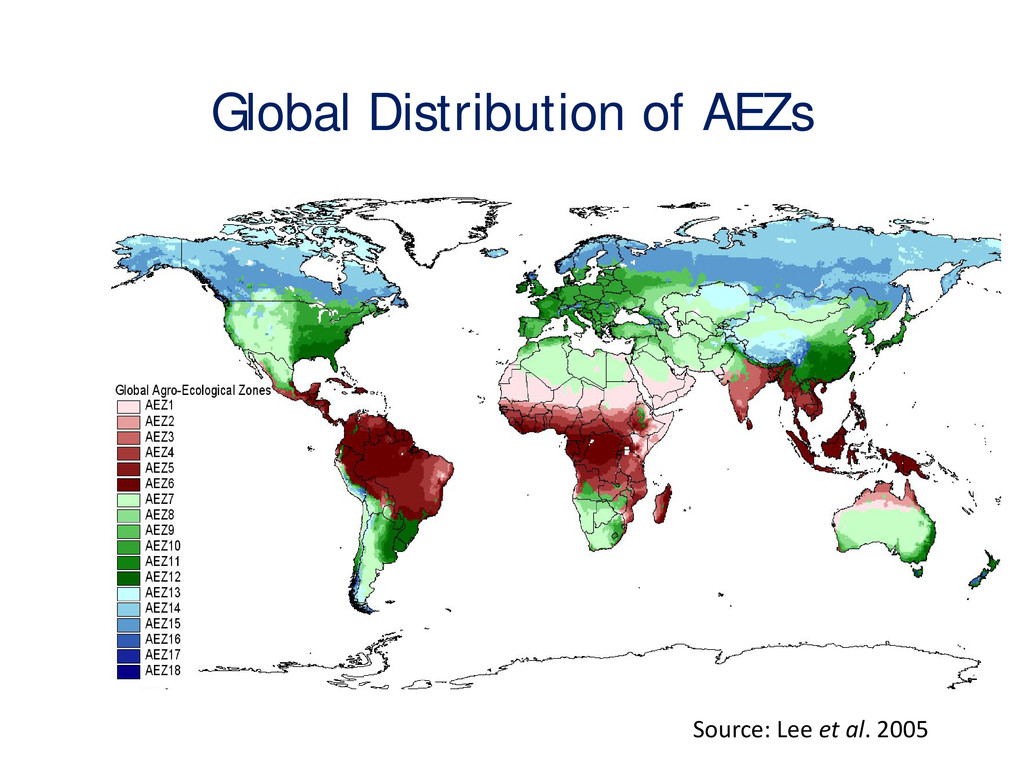
for land • Treatment in GTAP-AEZ: – Competition for land across uses (forest, pasture crops) within a Agro-Ecological Zone/Country – Shifting land use based on relative returns – Heterogeneity of land within AEZs and presence of institutional rigidities limit movement of land across cover types
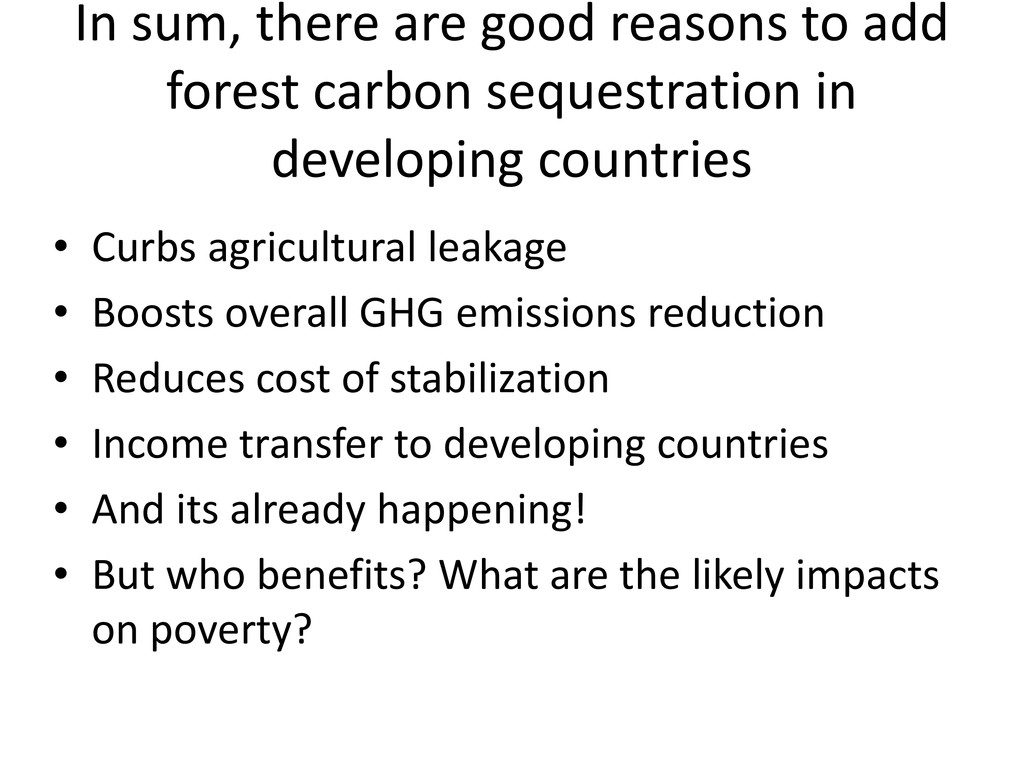
sequestration in developing countries • Curbs agricultural leakage • Boosts overall GHG emissions reduction • Reduces cost of stabilization • Income transfer to developing countries • And its already happening! • But who benefits? What are the likely impacts on poverty?
consistency (SC)= Avg/avg absolute value of returns to factors of production Ranges between -1 (always falls) and +1 (always rises) Source: Hussein et al., 2013
forest carbon sequestration) Grey bars = total poverty impact Circle area = proportion of poor in that stratum Red circles = agriculture self-employed Orange = non-agriculture self-employed Green = urban labor Blue = Rural labor Purple = Transfer dependent Black = Urban diversified White = rural diversified Summary: - poverty rises in 8 of 14 countries - poverty reduction in Chile is driven by private agr land ownership - contrasts sharply with Brazil and Colombia - ignores communal land
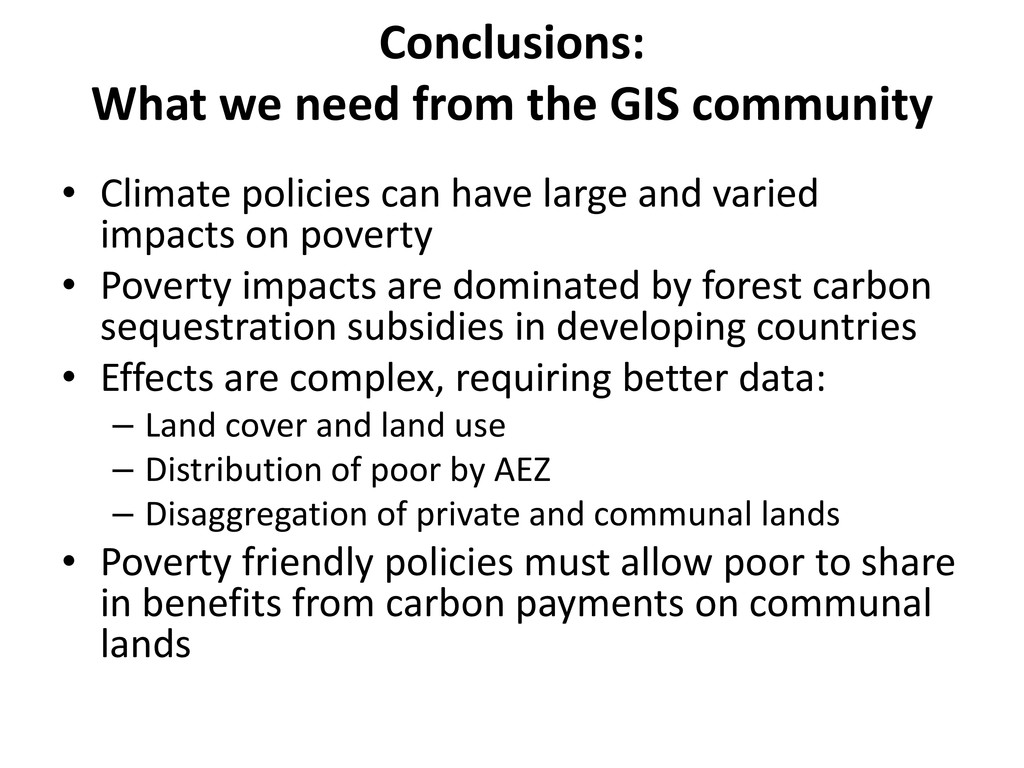
policies can have large and varied impacts on poverty • Poverty impacts are dominated by forest carbon sequestration subsidies in developing countries • Effects are complex, requiring better data: – Land cover and land use – Distribution of poor by AEZ – Disaggregation of private and communal lands • Poverty friendly policies must allow poor to share in benefits from carbon payments on communal lands


 cgiarcsi
 tattaka
 sishi
sishi
 polipoli
 rikkabotan7
 murakawatakuya
 reokashiwa
 de9uch1
 pman0214
 yukiar
 hisaokatsumi
 xspa2012
 datascientistsociety
 carmenintech
 auna
auna
 lara
lara
 jeffersonlam
 uxyall
 smashingmag
 palkan
 baasie
 seathinner
 jcasabona
 jakevdp
 maltzj