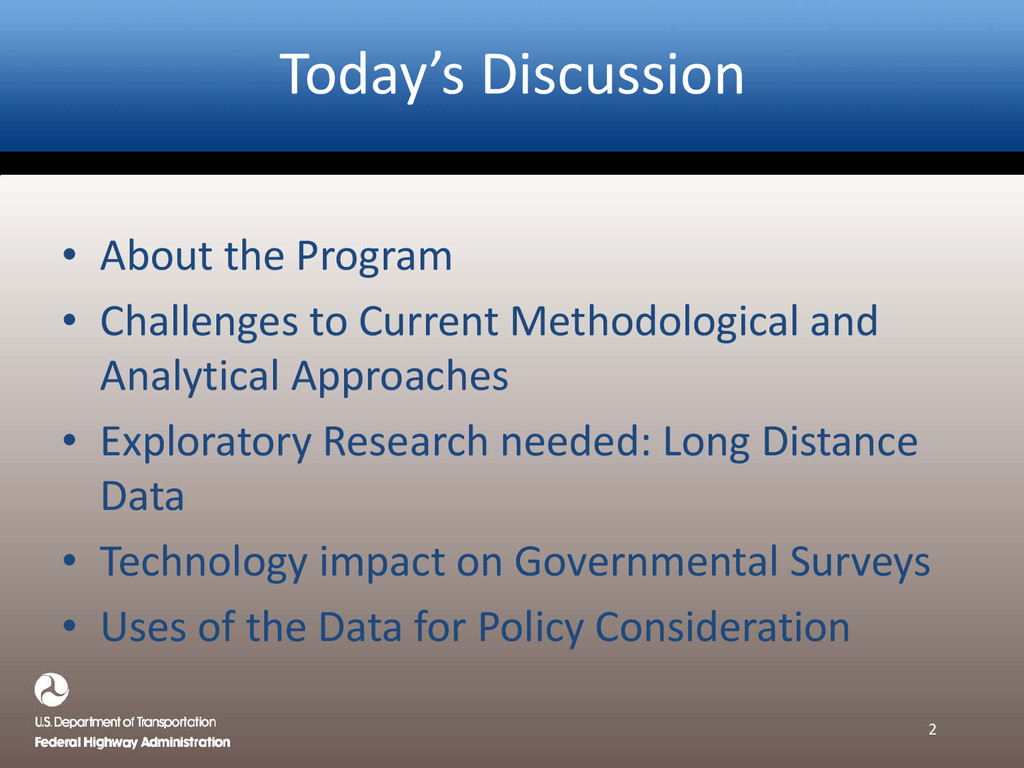
Methodological and Analytical Approaches • Exploratory Research needed: Long Distance Data • Technology impact on Governmental Surveys • Uses of the Data for Policy Consideration 2
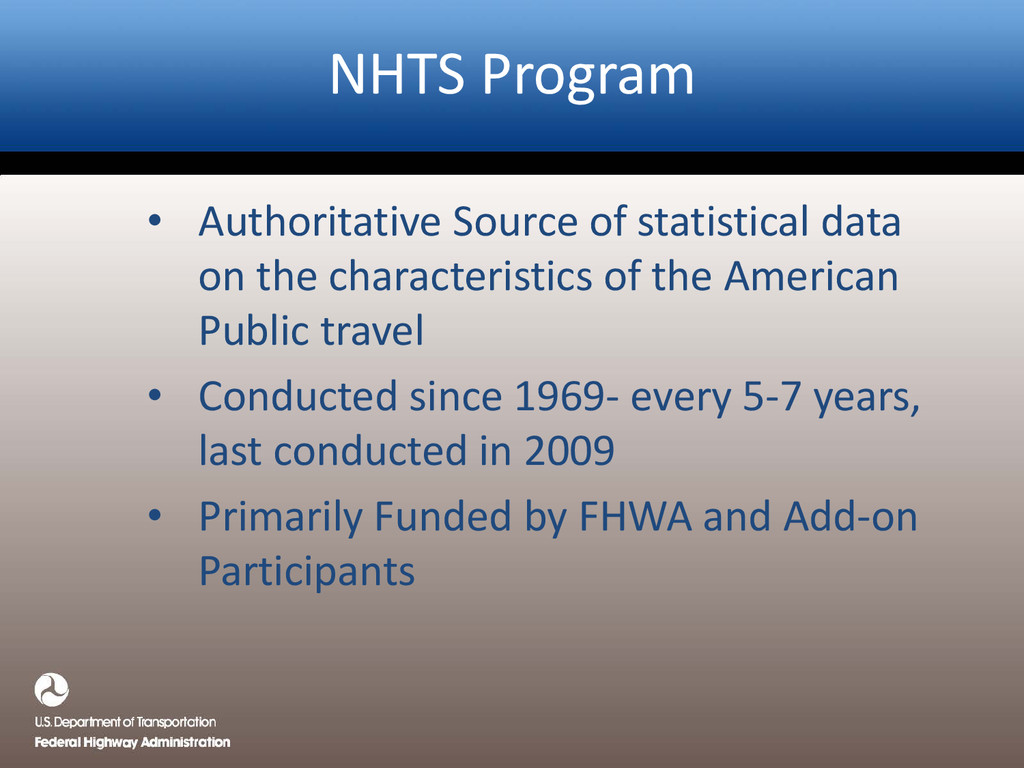
the American Public travel • Conducted since 1969- every 5-7 years, last conducted in 2009 • Primarily Funded by FHWA and Add-on Participants NHTS Program
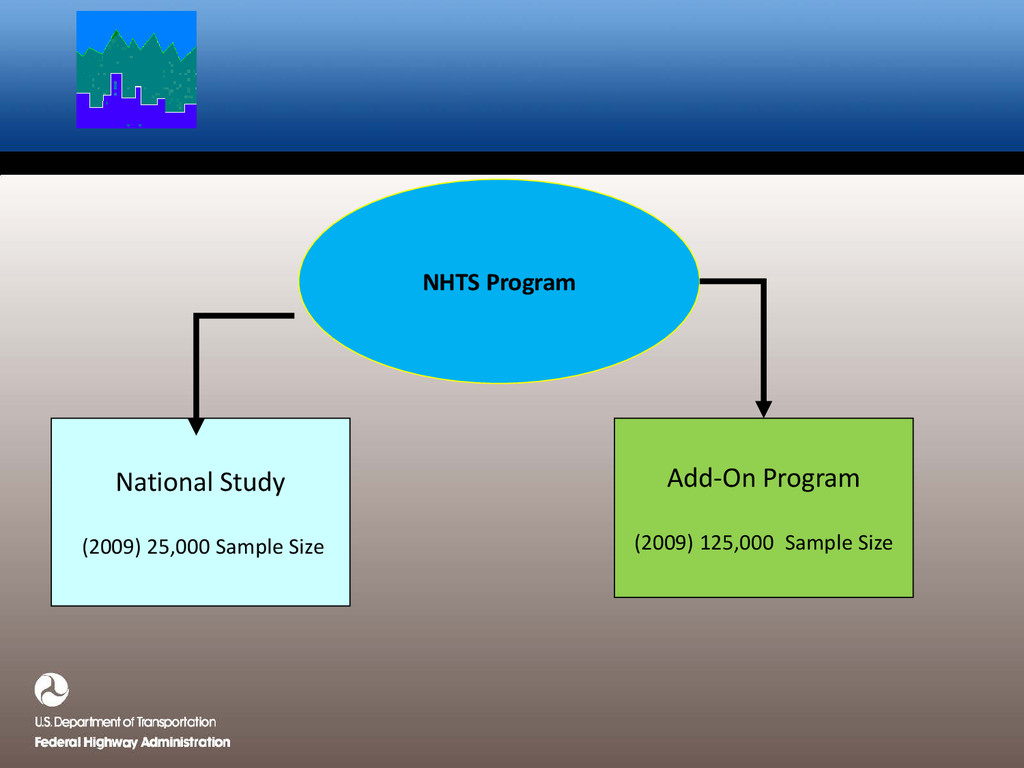
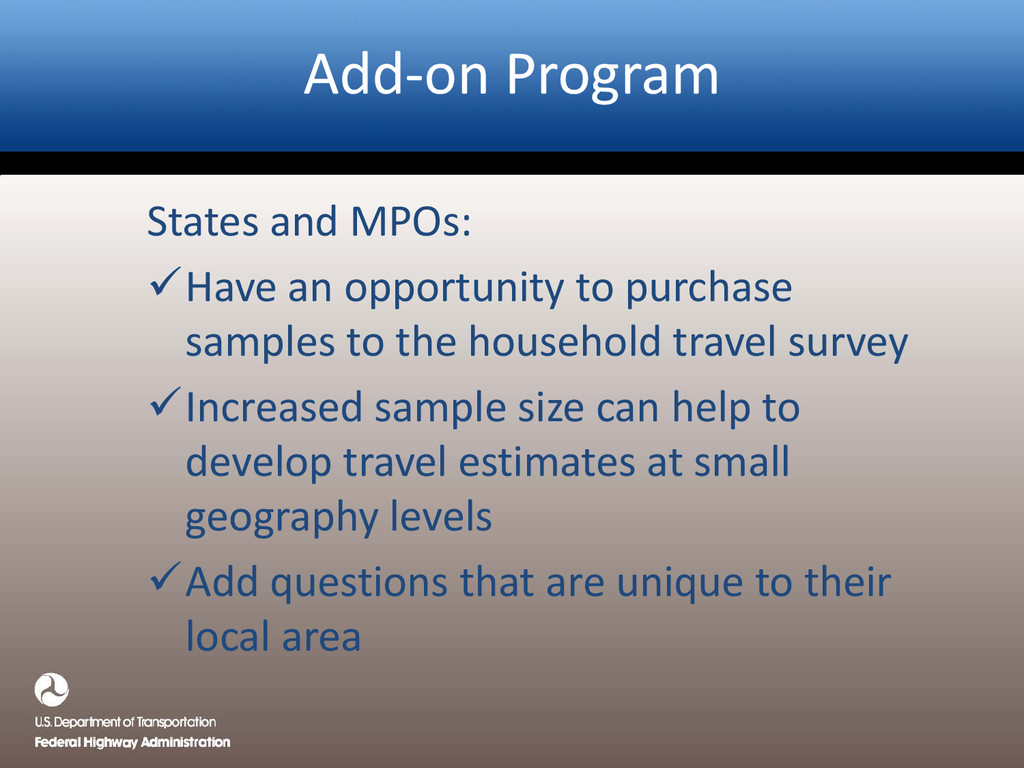
the household travel survey Increased sample size can help to develop travel estimates at small geography levels Add questions that are unique to their local area Add-on Program
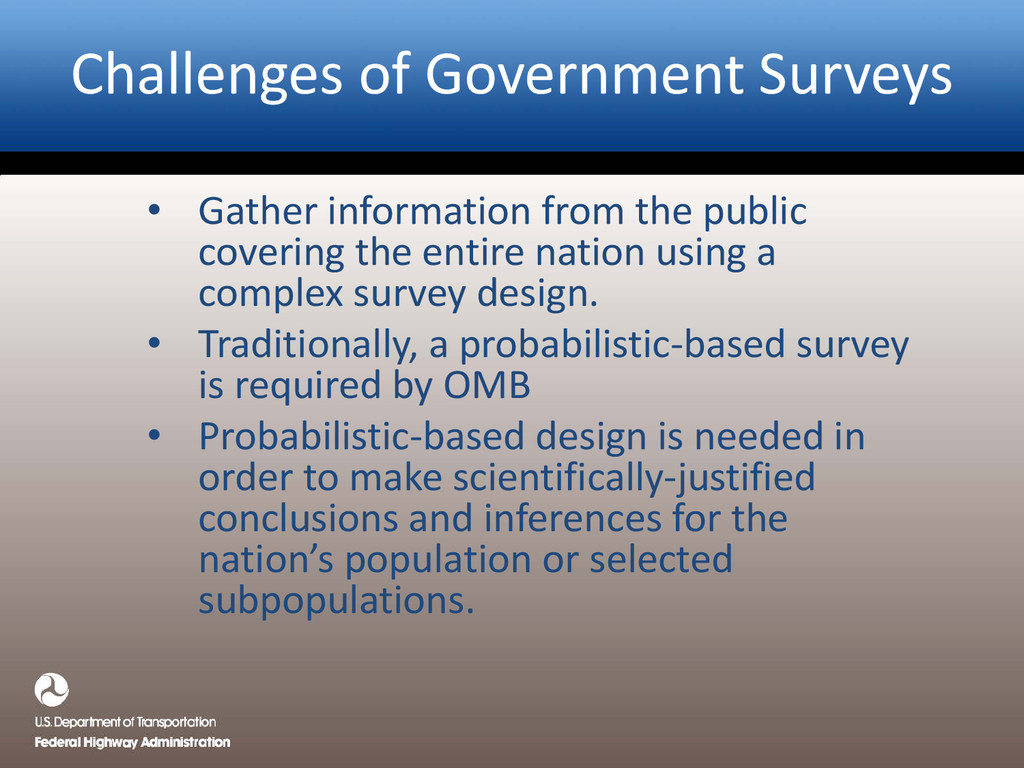
using a complex survey design. • Traditionally, a probabilistic-based survey is required by OMB • Probabilistic-based design is needed in order to make scientifically-justified conclusions and inferences for the nation’s population or selected subpopulations. Challenges of Government Surveys
for … – A changing and more diverse society? – Influx of new technology affecting measurement errors? – Changes in economy, Federal budgets, etc.? Complex Nature of a design
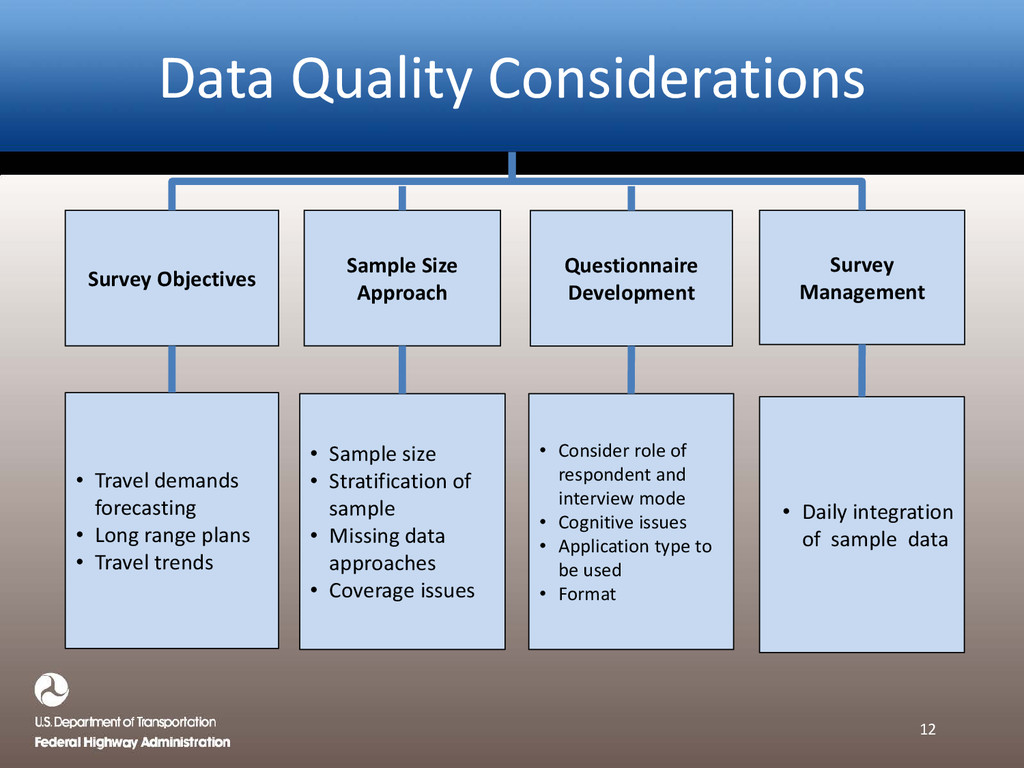
Objectives • Travel demands forecasting • Long range plans • Travel trends • Consider role of respondent and interview mode • Cognitive issues • Application type to be used • Format • Sample size • Stratification of sample • Missing data approaches • Coverage issues • Daily integration of sample data Survey Management
• 2001 NHTS had a subset of questions on Long Distance travel • Long Distance is considered a rare event for the general population. • Deal with many measurement error issues. 1995 American Travel Survey
survey to generate high- quality data, and to analyze those data so that the survey objectives can be still achieved despite greater cost constraints. Recent Exploratory Research for Long Distance Travel
prospective design – Address-based sampling – Dual-frame landline (RDD) and cell phone samples • New data collection apps can improve data quality, response rates, respondent burden, and bias reductions (but need to be designed in a way to attract their use) Options Considered
the GPS coordinates as a starting point. • Upload the application into their android phones. • Application was designed to create a ping each time a 50 mile trip was made, • Respondent was then instructed to answer about 6 questions on their long distance travel. Smart Phone
by considering the location “tags” that survey participants place on their posts and photos, signifying the physical location (or place that the post or plot is representing.) • FB was able to link those tags to their internal database in order to assign GPS coordinates to the location. Used Face Book
the coordinates for the centroid to the region associated with the ZIP code provided by the participant during the app download and registration, and when the straight-line distance between the coordinates exceeds 50 miles, a L/D trip is triggered. FB Coordinates
![Questions and Comments 23 Adella Santos 202-366-5021 [email protected]](https://files.speakerdeck.com/presentations/9aae9d80e0490131adb86ab78659ca38/slide_22.jpg)