Upgrade to Pro — share decks privately, control downloads, hide ads and more …

Student Engagement: An evaluation of the effectiveness of explicit and implicit Learning Analytics

Student Engagement: An evaluation of the effectiveness of explicit and implicit Learning Analytics

Dr Ed de Quincey University of Greenwich, Dr Ray Stoneham University of Greenwich


Background
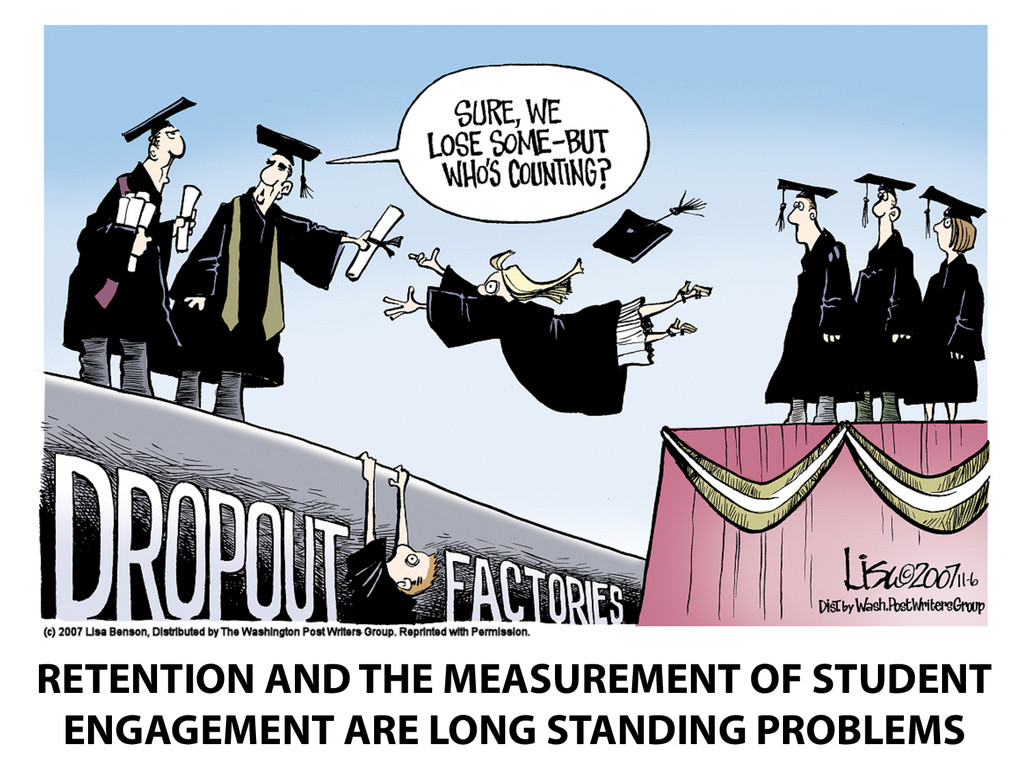
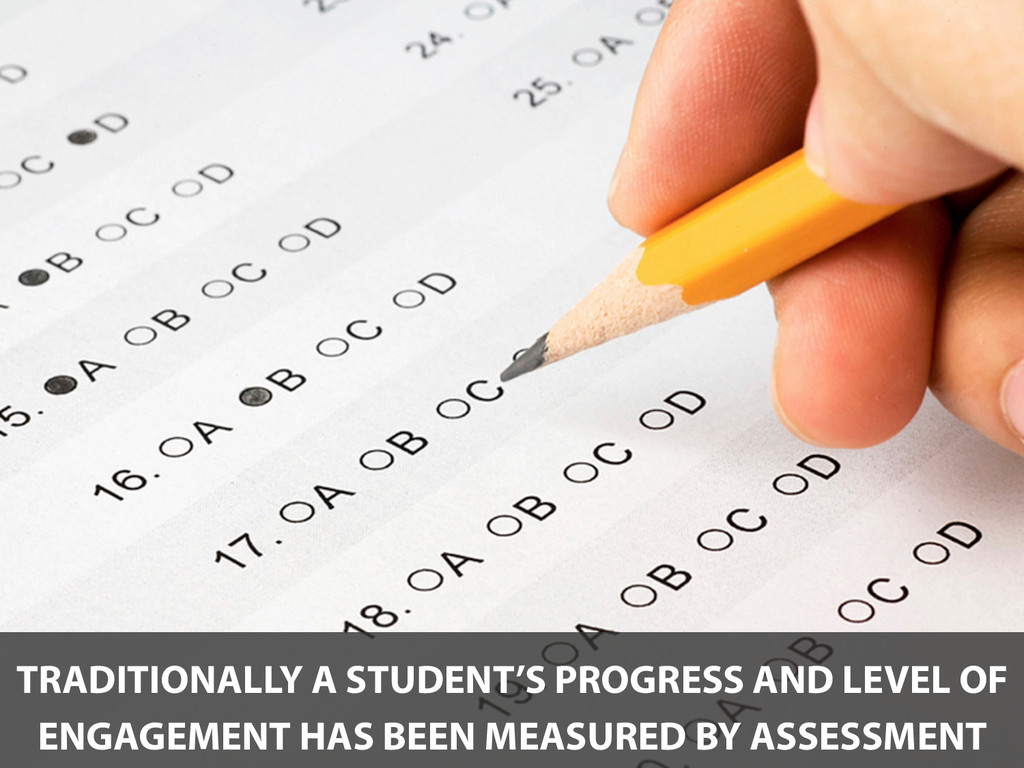
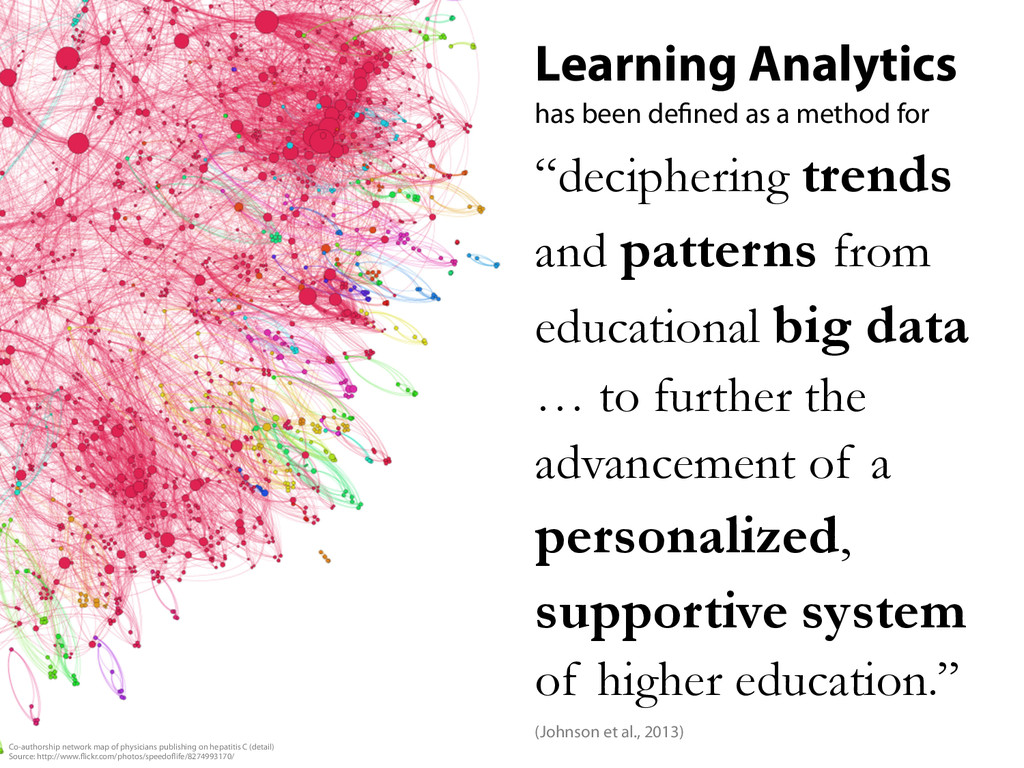
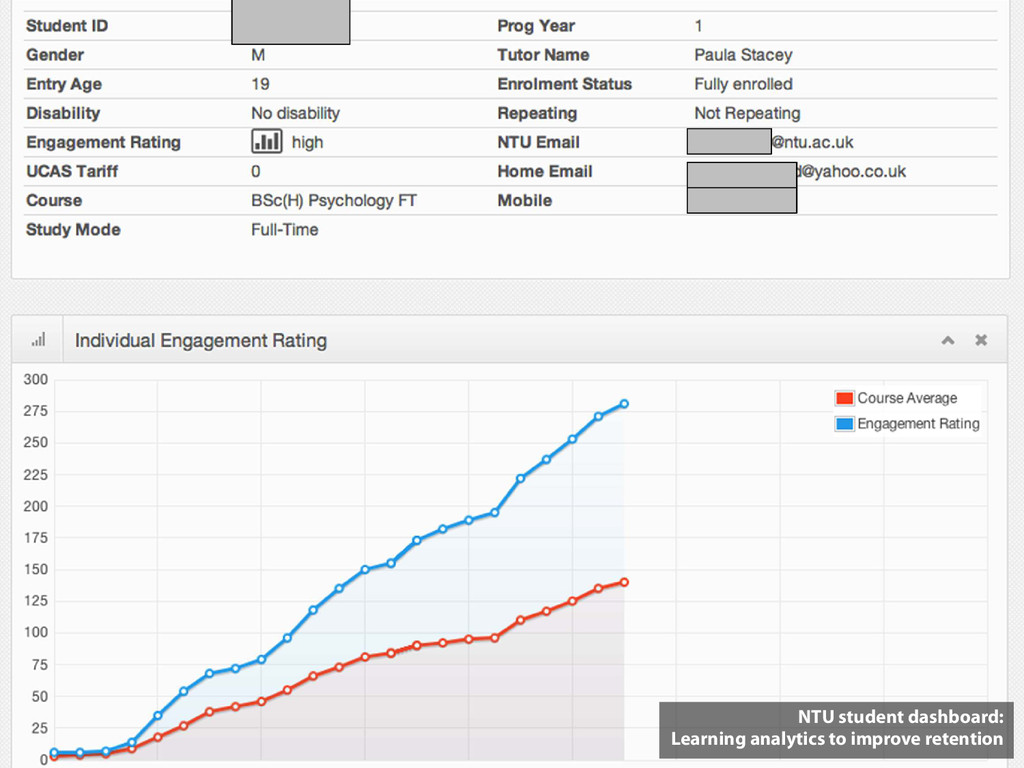
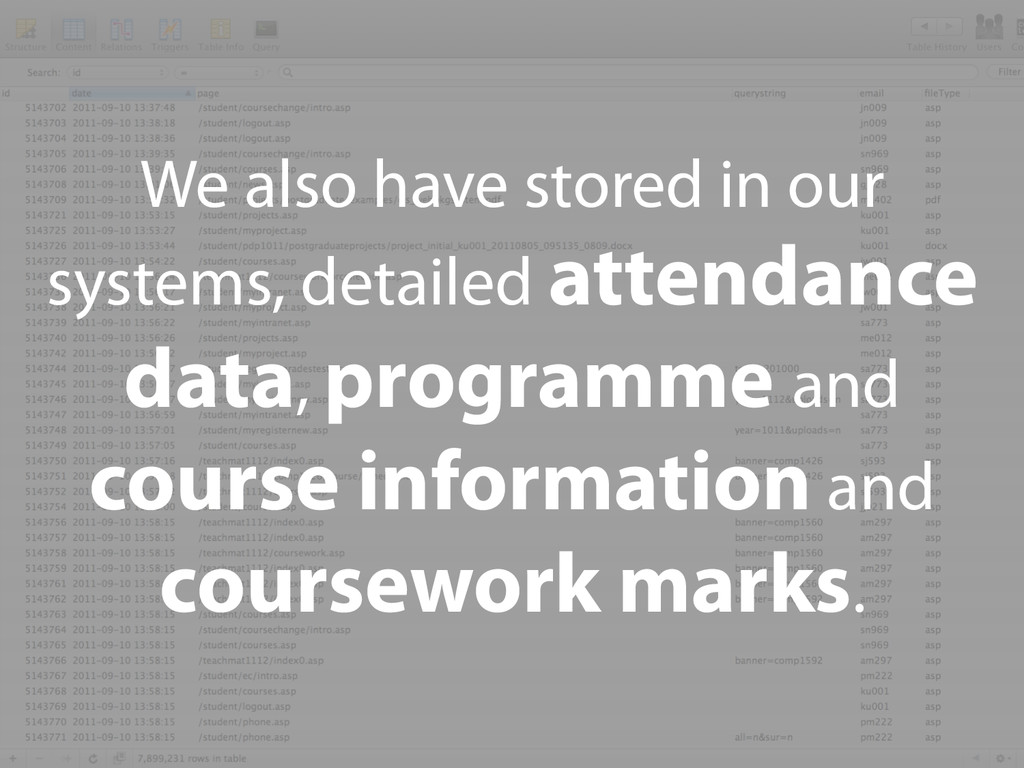
Retention and the measurement of student engagement are long standing problems within HE. A number of studies have investigated how students at risk of failing or withdrawing from University courses can be identified but the issue still remains, and looks set to be a key concern with the rapid development of MOOCs within the sector. One area of research in this field that is receiving increased interest is the use of implicit data collection and analysis, commonly known as Learning Analytics (LA). Traditionally a student’s progress and level of engagement has been measured by assessment and physical attendance. However, in a student’s day-to-day interactions with a University, other real-time, implicit measures are being generated that are currently not being fully utilised e.g. VLE server log data, library usage data, Web 2.0/social media usage.

Objectives
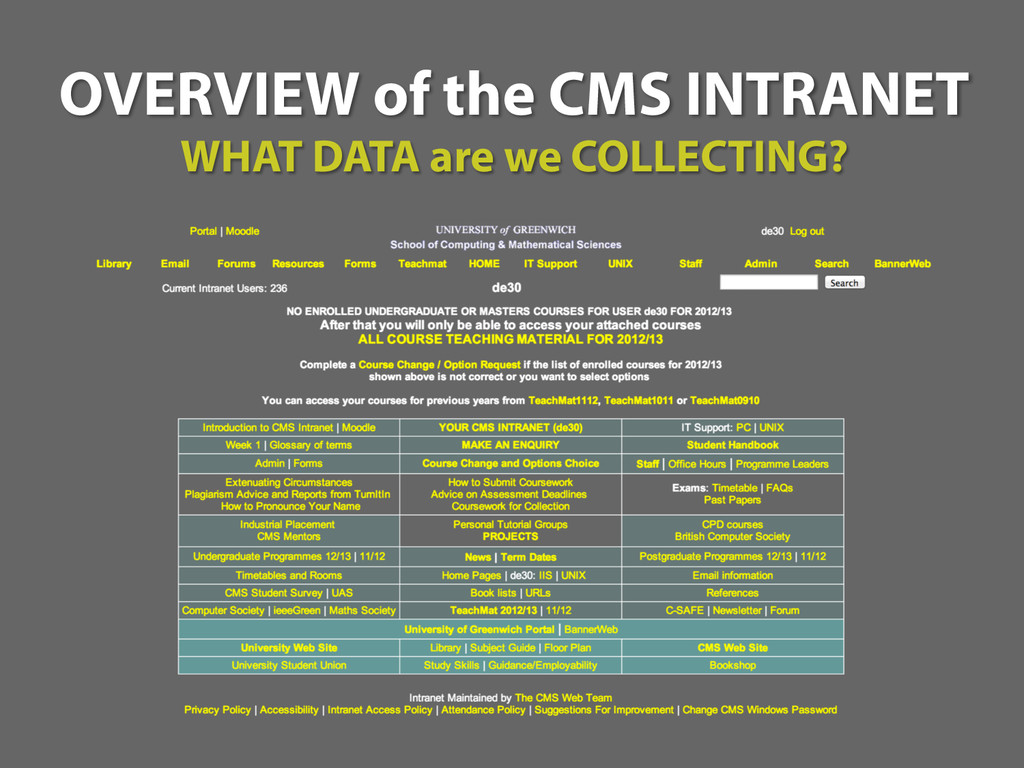
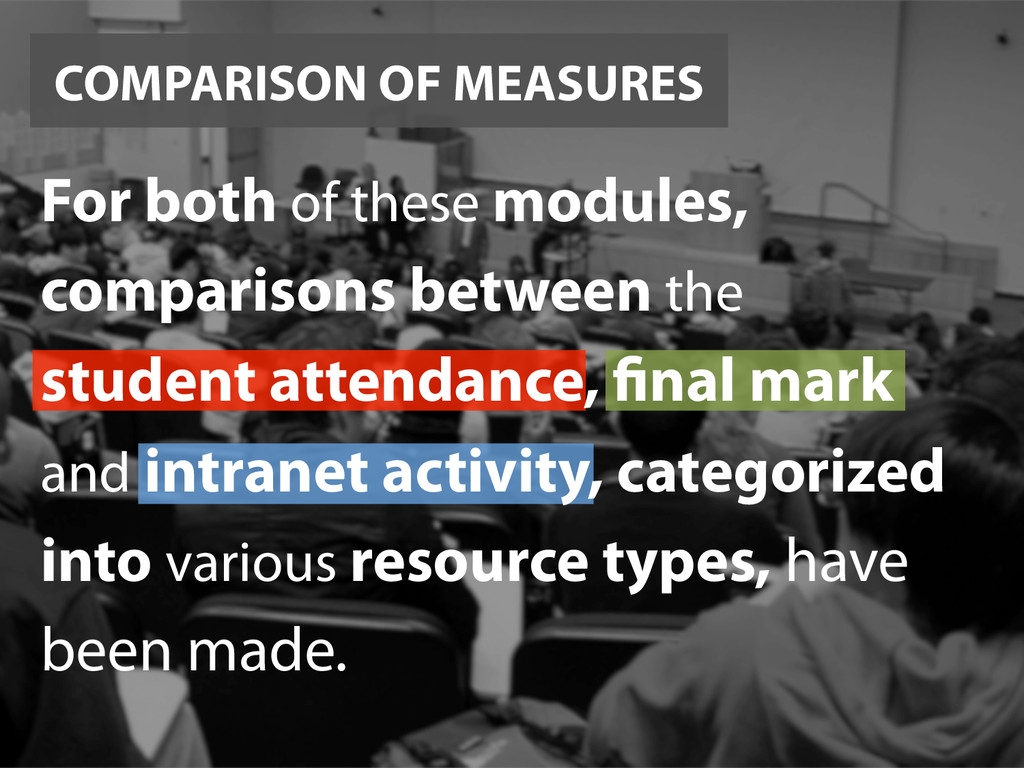
This study has identified potential sources of implicit data that represent student engagement levels from an academic perspective by analysing the server log data generated from the usage of the School of Computing and Mathematical Sciences (CMS) Intranet by Undergraduate and Postgraduate students. This data has then been compared with traditional metrics such as attendance and coursework marks to determine the value of these implicit measures in determining a student’s progress and whether they can be used to identify “at risk” students, at various points in the academic year.

Results
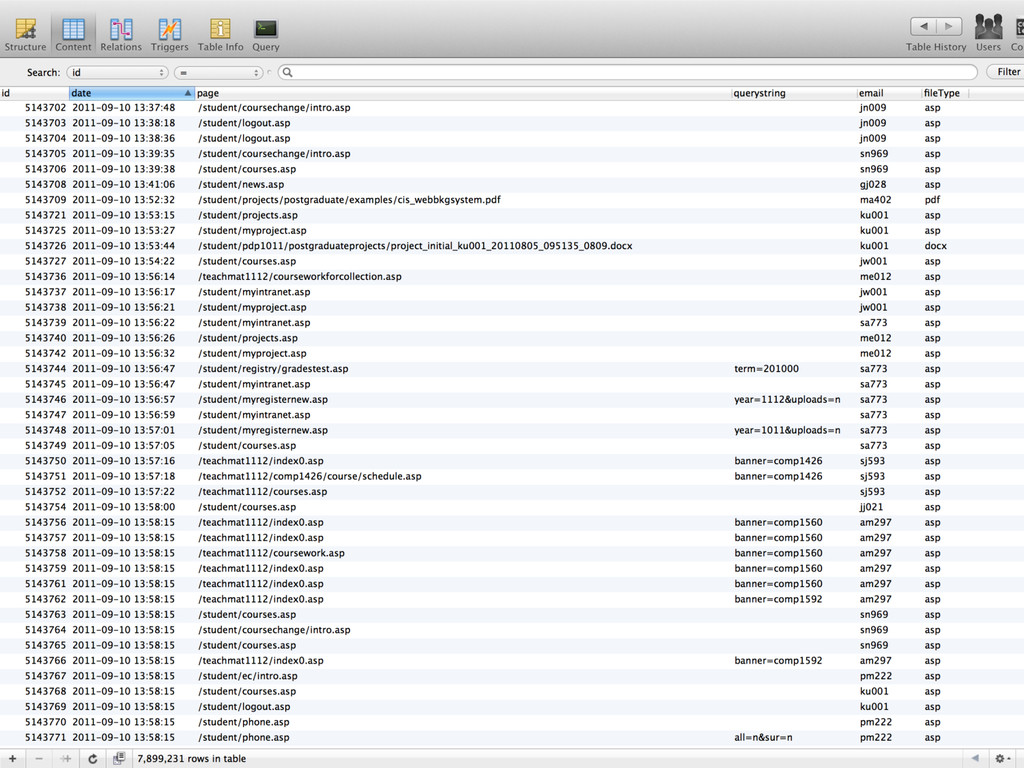
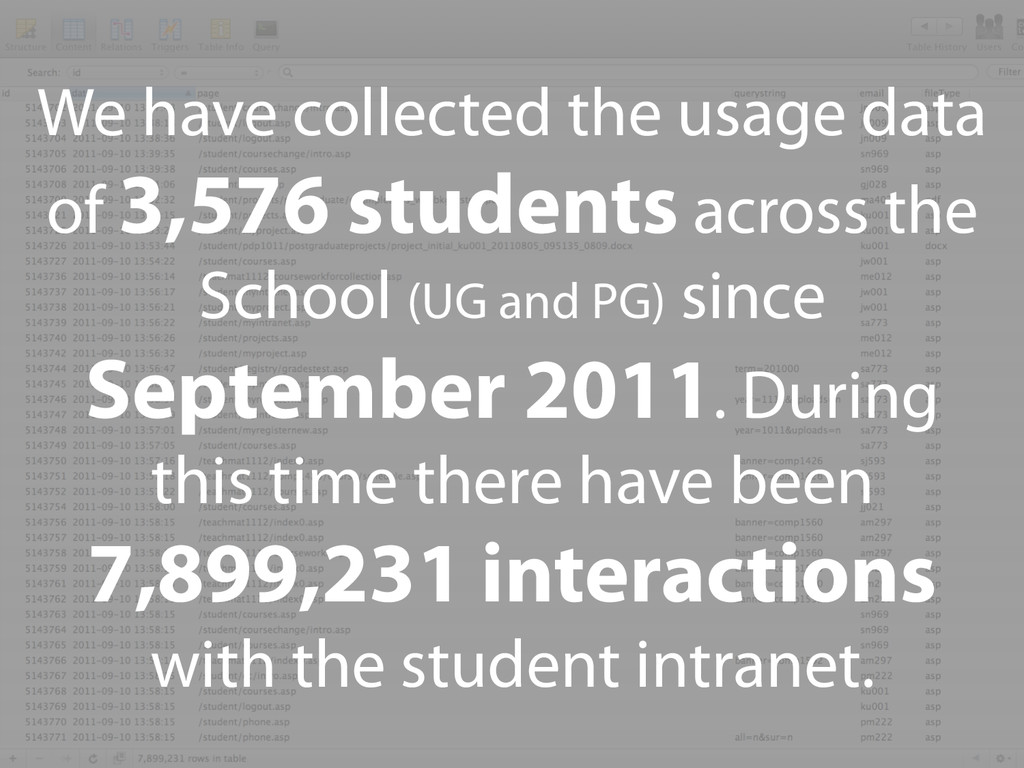
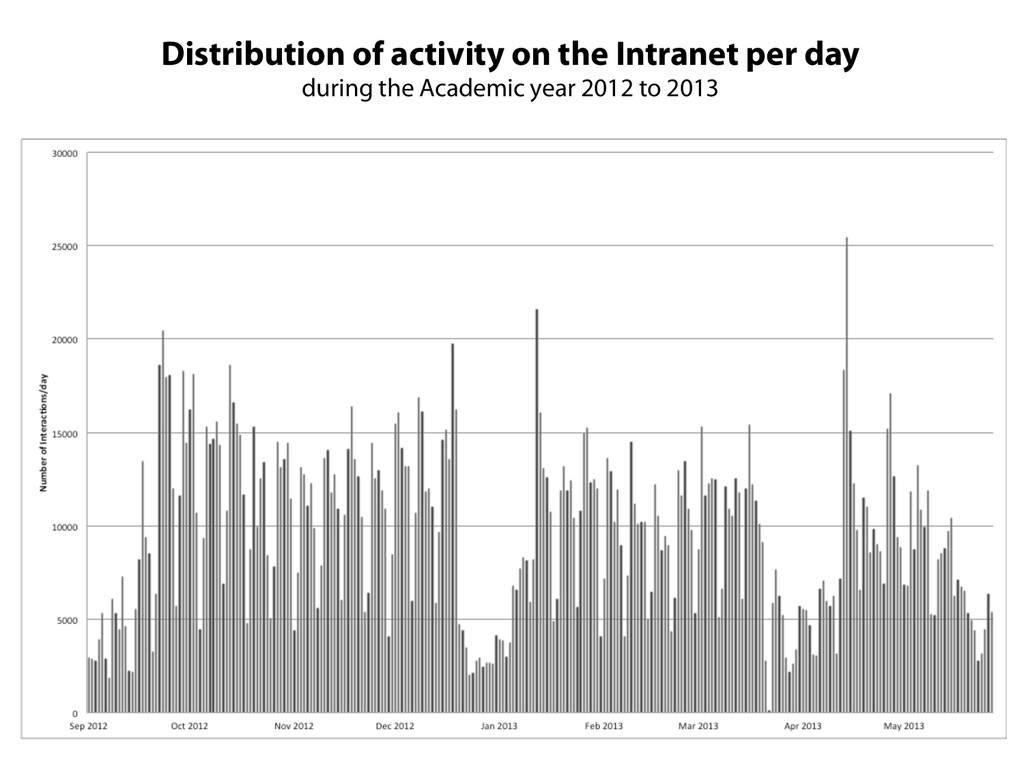
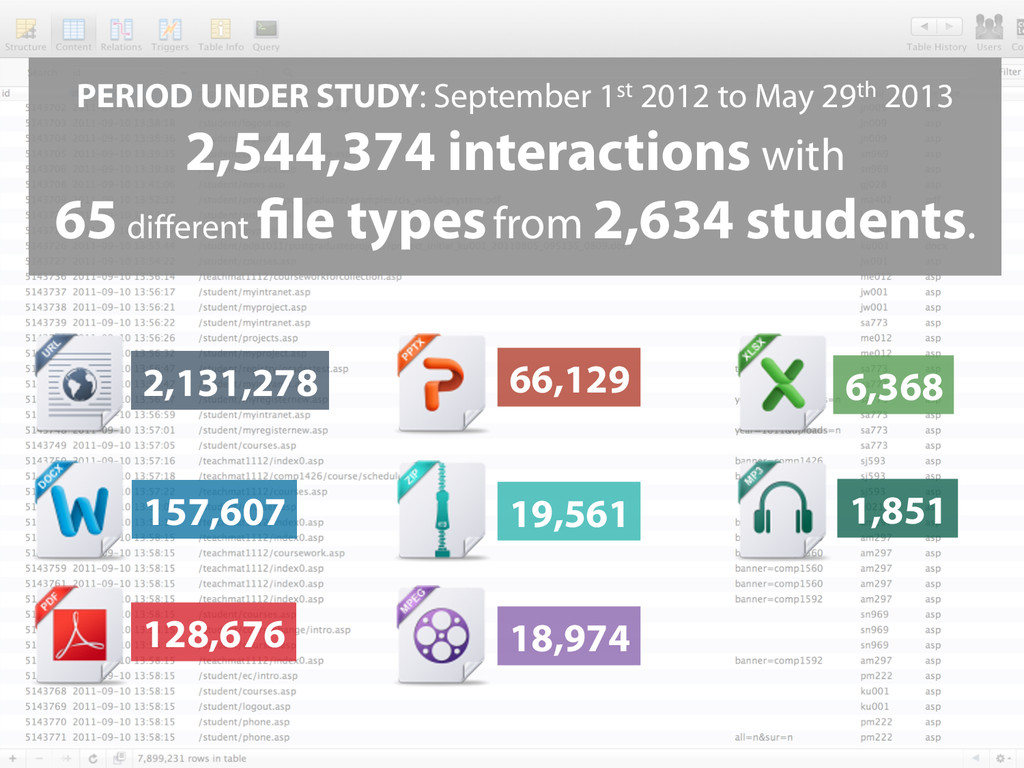
Server log data generated by 3,576 students across the School since September 2011 has been collected and during this time there have been 7,899,231 interactions with the CMS student intranet. For this study, the period from September 1st 2012 to May 29th 2013 has been analysed, to represent an academic year, with 2,544,374 interactions from 2,634 students being recorded.
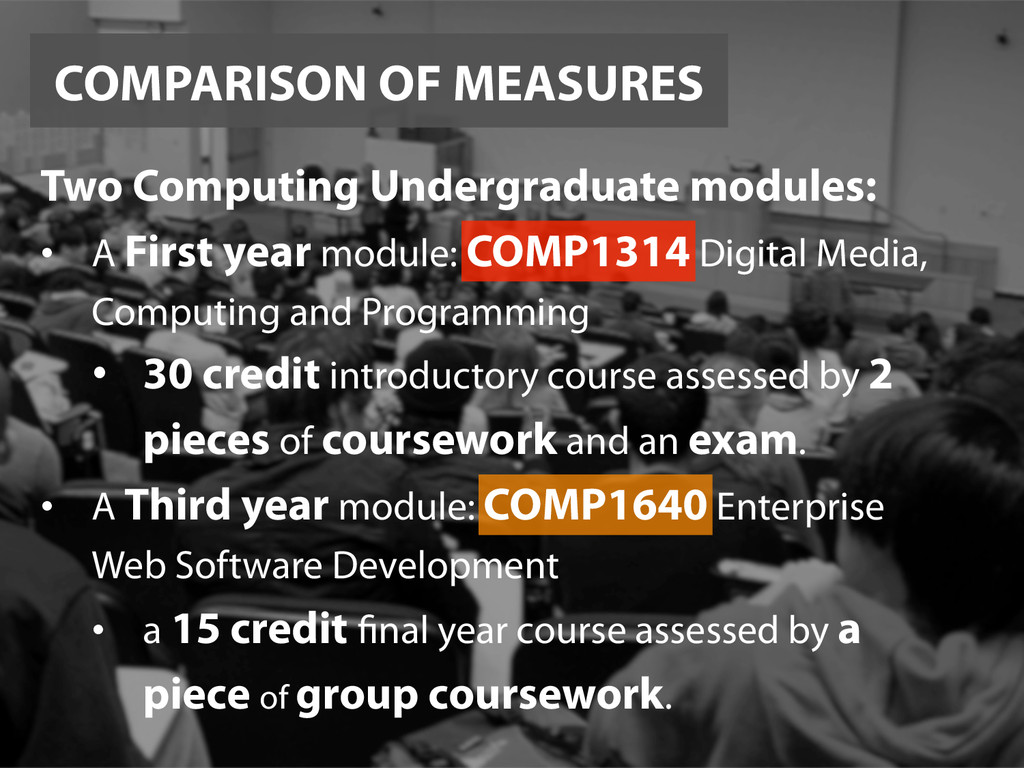
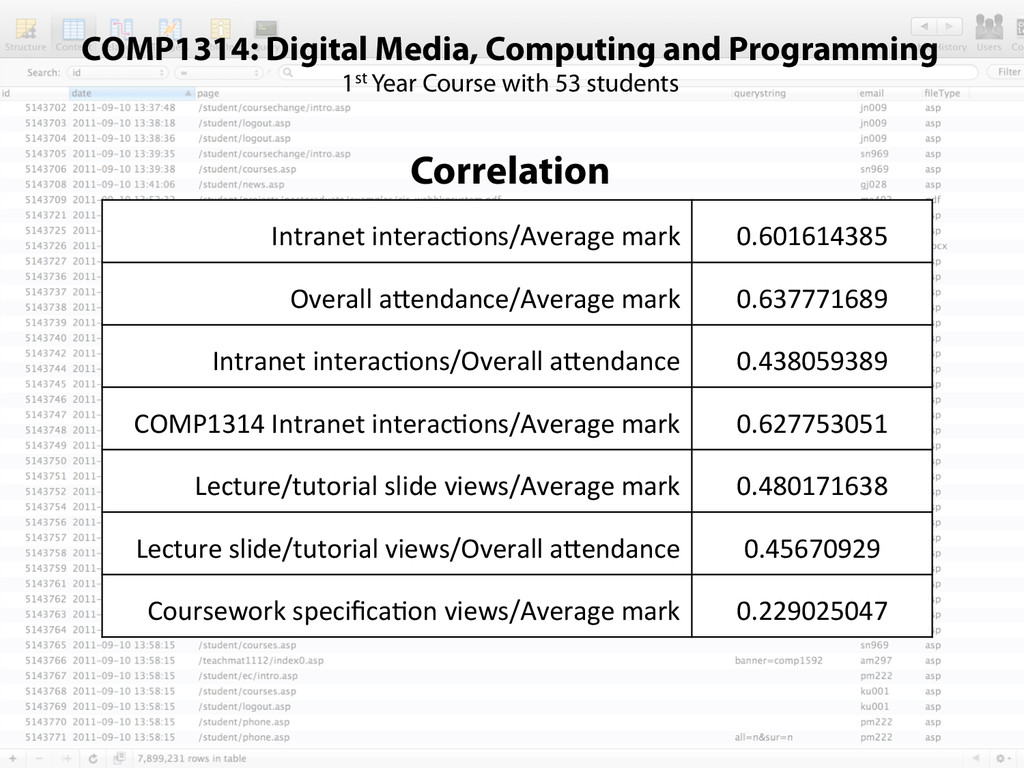
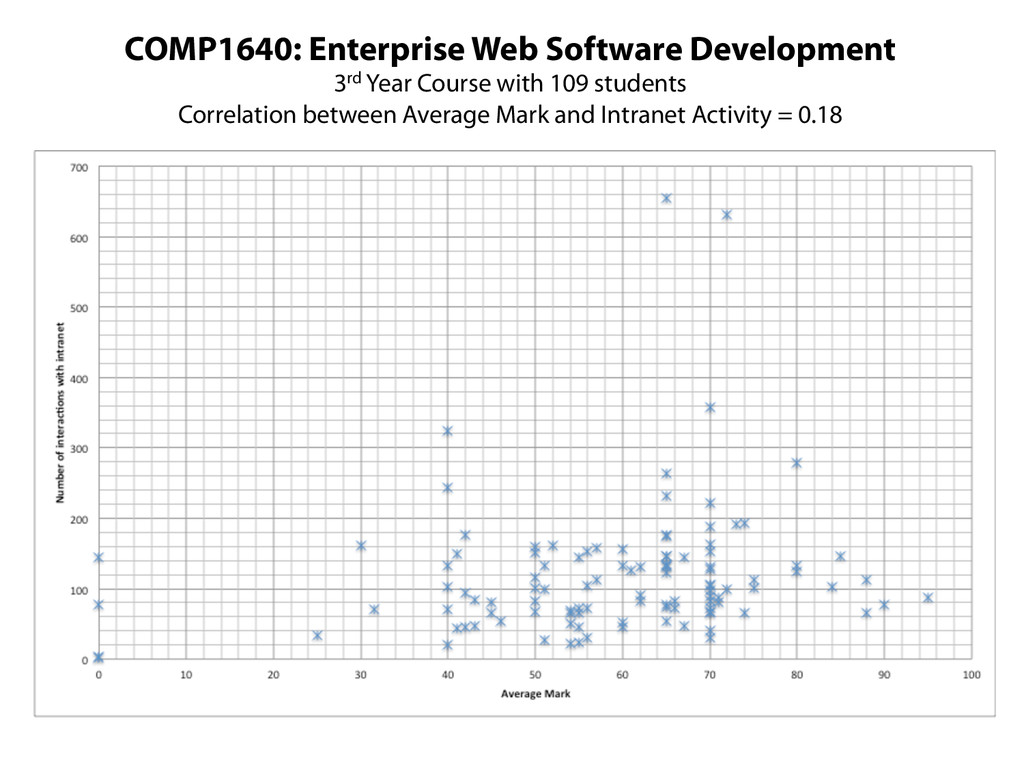
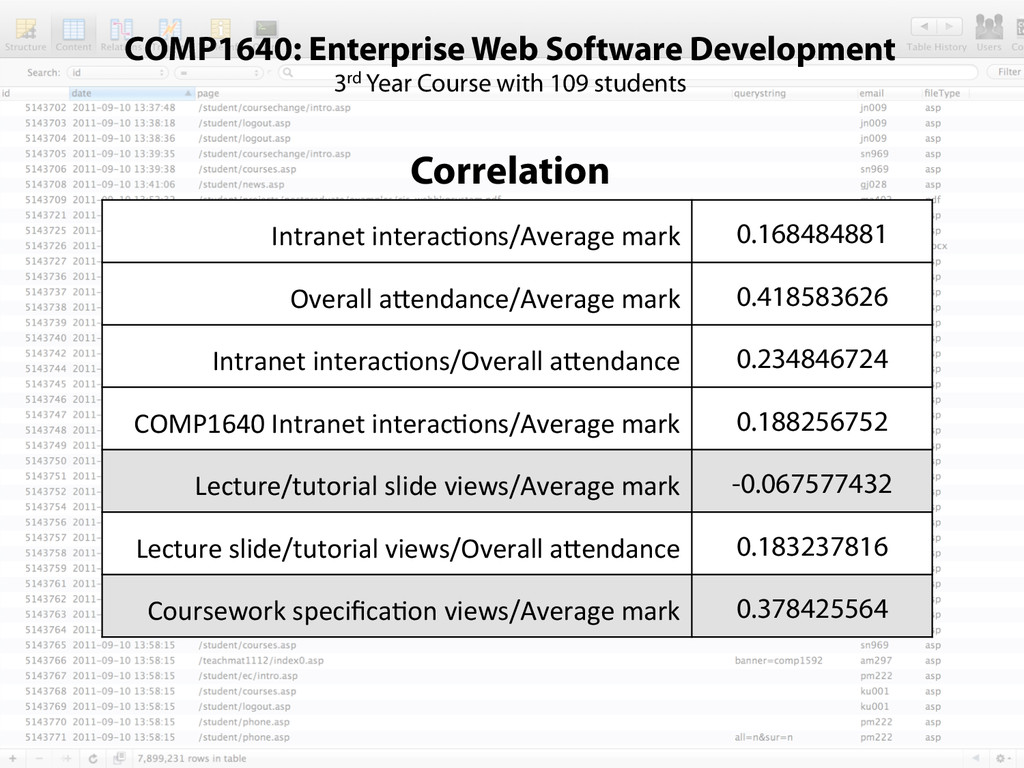
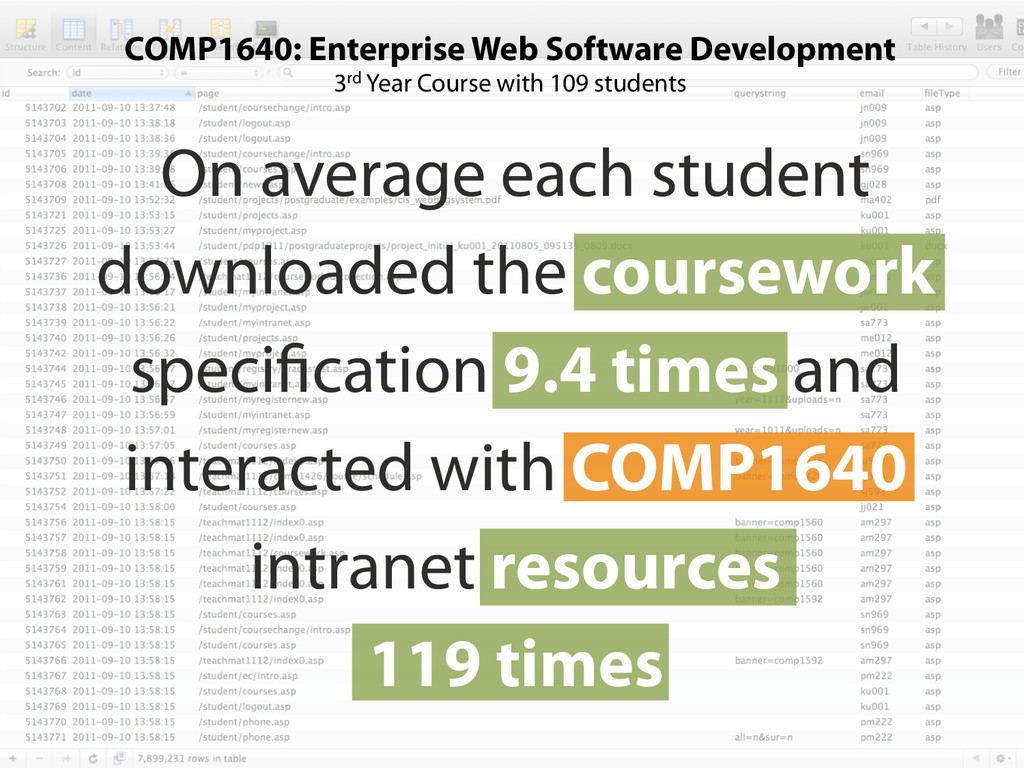
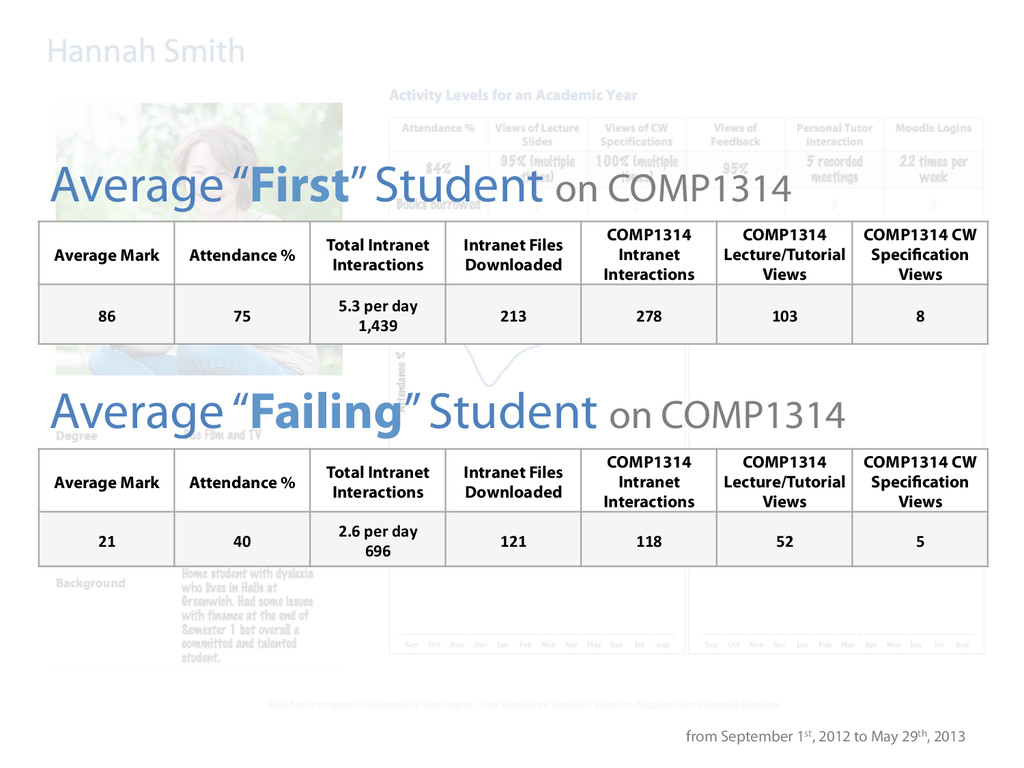
In order to identify which implicit measures might determine/represent a student’s progress, two Computing Undergraduate modules have been considered; a first year course called “COMP1314: Digital Media, Computing and Programming” and a 3rd year course “COMP1640: Enterprise Web Software Development”.
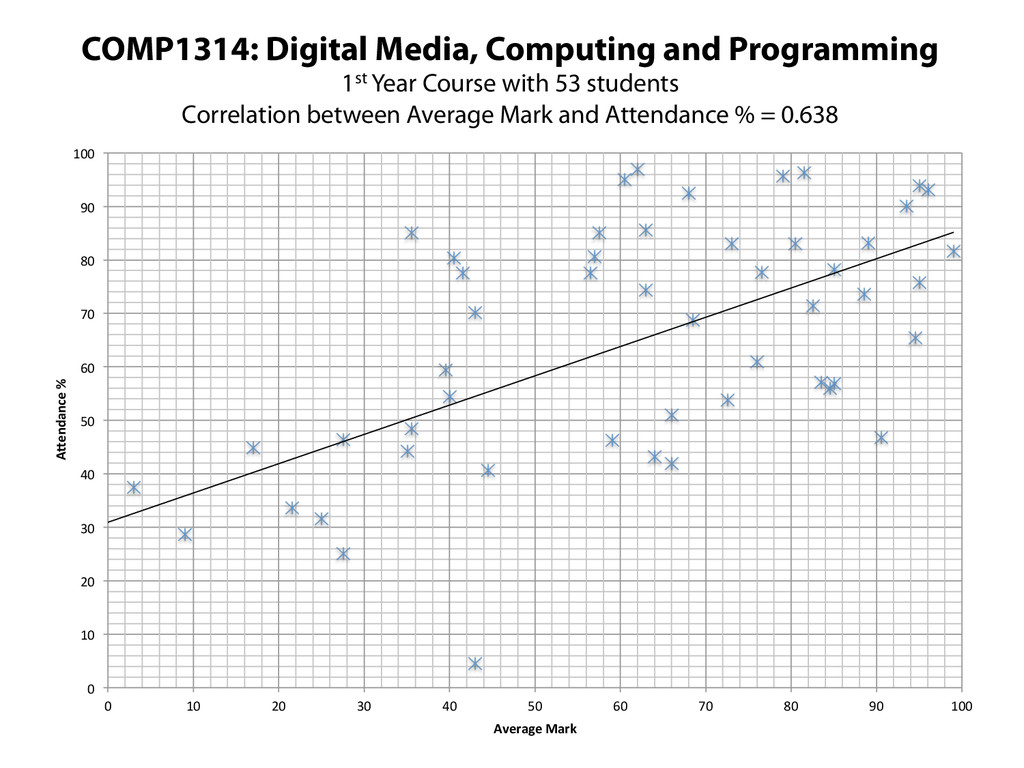
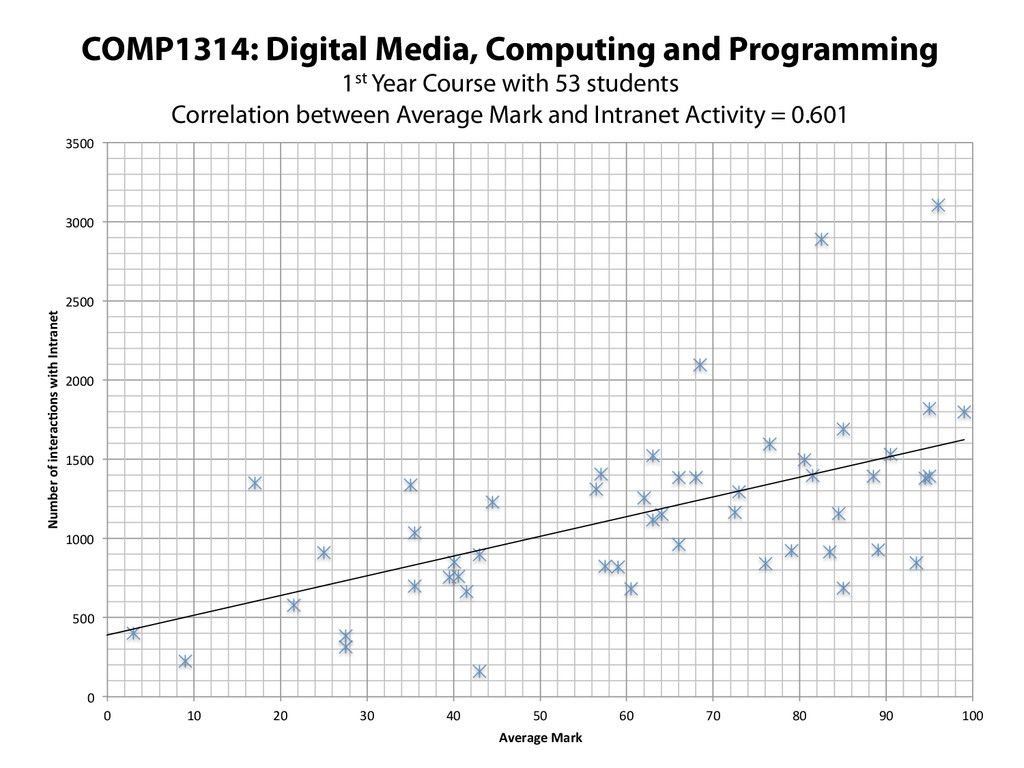
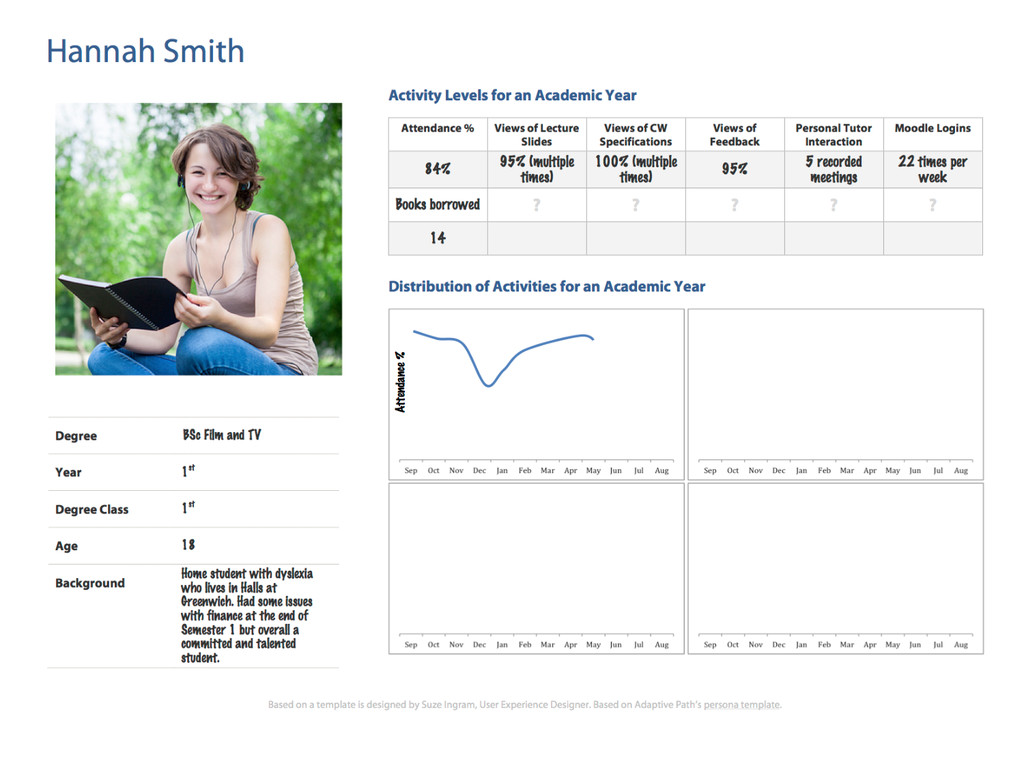
Preliminary results indicate that in COMP1314 there is a strong positive correlation between the final module mark and overall attendance at tutorial and lab sessions (0.64) and equally strong positive correlation with the number of interactions with resources related to COMP1314 e.g. views of lecture slides, and the module mark (0.63) i.e. students that have high levels of activity both physically and virtually with the module tend to have higher marks.
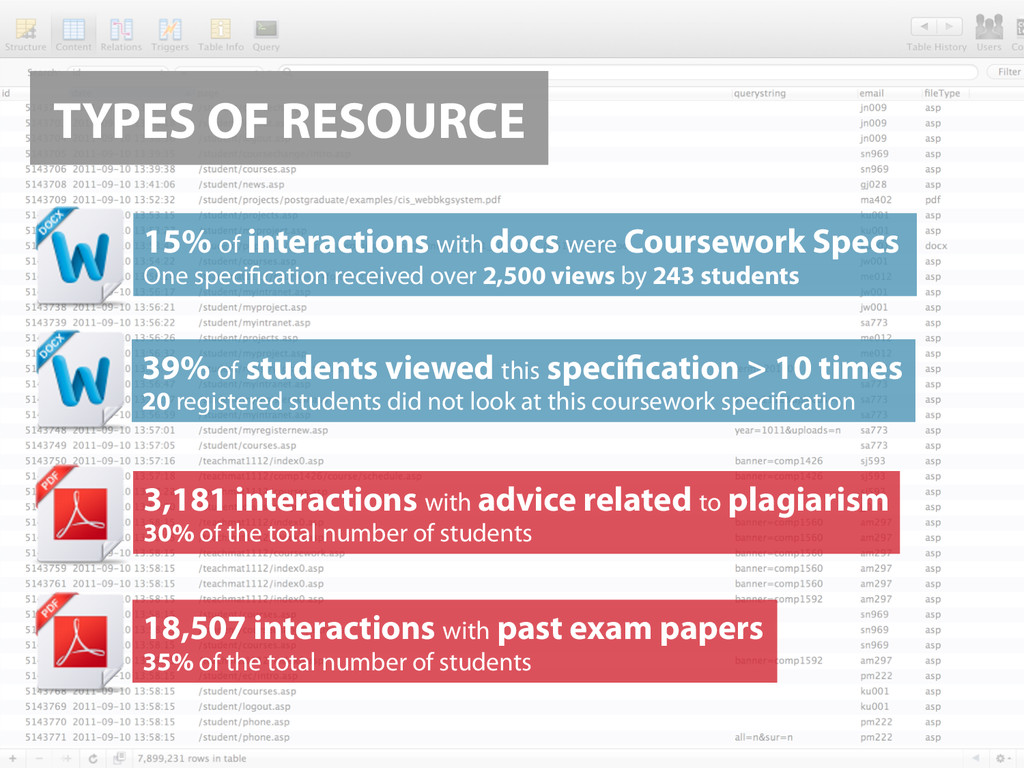
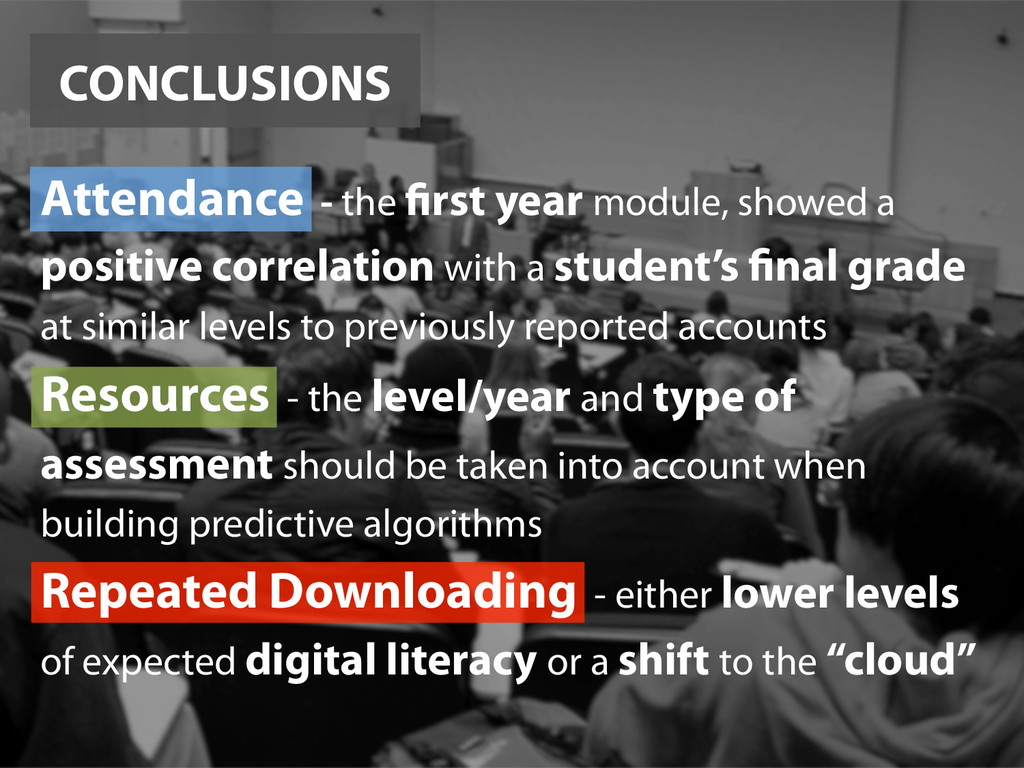
There is also strong positive correlation between the number of intranet interactions and a student’s overall attendance (0.44), perhaps countering the generally held belief that making materials/services available online decreases attendance in lectures. Interestingly there was a weak positive relationship (0.23) between the number of times the coursework specification had been viewed and a student’s final mark. A possible explanation for this is that students with higher levels of digital literacy (and therefore might be expected to do well in a Digital Media module) save or print the coursework specification on first view instead of downloading it multiple times when needed.
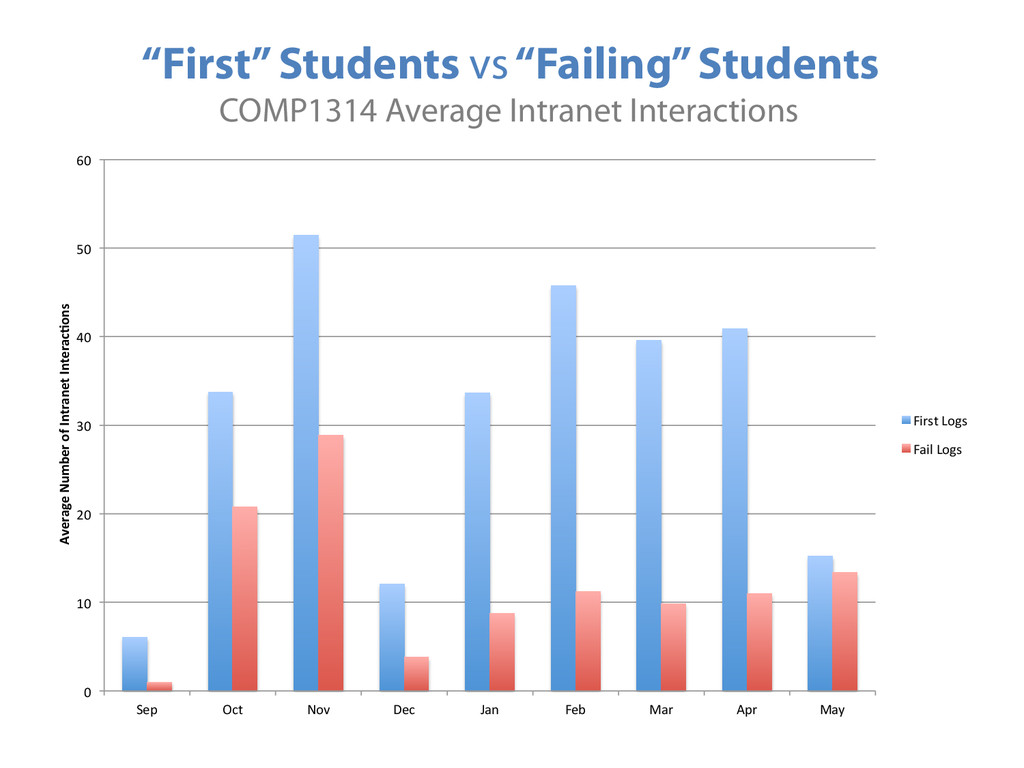
The distribution of intranet activity shows that the pattern of usage is similar to begin with for students on COMP1314 that eventually receive first class marks and those that fail, with relatively high levels of activity during October and November and a decrease in December. First class students then have a similar patter of activity to that in the first semester whereas failing students tend to remain at low levels. On average, failing students have half the number of interactions with the intranet than first class students throughout the year.
For the third year course, there was similar, strong positive correlation between attendance and the final mark (0.42) but weak correlation between interaction with module resources/pages and final mark (0.18) and there was in fact no relationship between views of module lecture/tutorial materials and the final mark (-0.07). Whether this reflects improved digital literacy, less reliance on module materials or simply the nature of the module is currently being investigated.

Conclusions
The results from this study indicate that attendance and interactions with a student intranet are useful measures for student engagement and predictors of success, particularly in a student's first year. Reasons for the difference in effect observed between first and third year modules have been tentatively identified, and further investigation is currently being undertaken using Bayesian Belief Network Analysis. This work shows that there are clear implications for LA, and for educators in general, regarding expected patterns and levels of activity for different types and levels of student.

Ed de Quincey

July 10, 2014
Tweet

More Decks by Ed de Quincey

Other Decks in Education

Transcript

  1. STUDENT ENGAGEMENT: An evaluation of the effectiveness of explicit and

    implicit Learning Analytics Dr Ed de Quincey & Dr Ray Stoneham, University of Greenwich Photo by willfolsom
  2. LOOKS SET TO BE A KEY CONCERN WITH THE RAPID

    DEVELOPMENT OF MOOCS WITHIN HE WORLDWIDE
  3. Learning Analytics has been defined as a method for “deciphering

    trends and patterns from educational big data … to further the advancement of a personalized, supportive system of higher education.” (Johnson et al., 2013) Co-authorship network map of physicians publishing on hepatitis C (detail) Source: http://www.flickr.com/photos/speedoflife/8274993170/
  4. We have collected the usage data of 3,576 students across

    the School (UG and PG) since September 2011. During this time there have been 7,899,231 interactions with the student intranet.
  5. We also have stored in our systems, detailed attendance data,

    programme and course information and coursework marks.
  6. PERIOD UNDER STUDY: September 1st 2012 to May 29th 2013

    2,544,374 interactions with 65 different file types from 2,634 students. 2,131,278 18,974 157,607 128,676 6,368 66,129 1,851 19,561
  7. TYPES OF RESOURCE 39% of students viewed this specification >

    10 times 20 registered students did not look at this coursework specification 3,181 interactions with advice related to plagiarism 30% of the total number of students 15% of interactions with docs were Coursework Specs One specification received over 2,500 views by 243 students 18,507 interactions with past exam papers 35% of the total number of students
  8. COMPARISON OF MEASURES Two Computing Undergraduate modules: •  A First

    year module: COMP1314 Digital Media, Computing and Programming •  30 credit introductory course assessed by 2 pieces of coursework and an exam. •  A Third year module: COMP1640 Enterprise Web Software Development •  a 15 credit final year course assessed by a piece of group coursework.
  9. For both of these modules, comparisons between the student attendance,

    final mark and intranet activity, categorized into various resource types, have been made. COMPARISON OF MEASURES
  10. COMP1314: Digital Media, Computing and Programming 1st Year Course with

    53 students Correlation between Average Mark and Attendance % = 0.638 0   10   20   30   40   50   60   70   80   90   100   0   10   20   30   40   50   60   70   80   90   100   A"endance  %   Average  Mark  
  11. COMP1314: Digital Media, Computing and Programming 1st Year Course with

    53 students Correlation between Average Mark and Intranet Activity = 0.601 0   500   1000   1500   2000   2500   3000   3500   0   10   20   30   40   50   60   70   80   90   100   Number  of  interac7ons  with  Intranet   Average  Mark  
  12. COMP1314: Digital Media, Computing and Programming 1st Year Course with

    53 students Correlation Intranet  interac4ons/Average  mark 0.601614385 Overall  a@endance/Average  mark 0.637771689 Intranet  interac4ons/Overall  a@endance 0.438059389 COMP1314  Intranet  interac4ons/Average  mark 0.627753051 Lecture/tutorial  slide  views/Average  mark 0.480171638 Lecture  slide/tutorial  views/Overall  a@endance 0.45670929 Coursework  specifica4on  views/Average  mark 0.229025047
  13. COMP1314: Digital Media, Computing and Programming 1st Year Course with

    53 students Each lecture slide handout has been viewed on average 76 times whereas each tutorial instruction has been viewed on average 142 times.
  14. COMP1640: Enterprise Web Software Development 3rd Year Course with 109

    students Correlation between Average Mark and Intranet Activity = 0.18
  15. COMP1640: Enterprise Web Software Development 3rd Year Course with 109

    students Correlation Intranet  interac4ons/Average  mark 0.168484881 Overall  a@endance/Average  mark 0.418583626 Intranet  interac4ons/Overall  a@endance 0.234846724 COMP1640  Intranet  interac4ons/Average  mark 0.188256752 Lecture/tutorial  slide  views/Average  mark -0.067577432 Lecture  slide/tutorial  views/Overall  a@endance 0.183237816 Coursework  specifica4on  views/Average  mark 0.378425564
  16. COMP1640: Enterprise Web Software Development 3rd Year Course with 109

    students On average each student downloaded the coursework specification 9.4 times and interacted with COMP1640 intranet resources 119 times
  17. Average Mark Attendance % Total Intranet Interactions Intranet Files Downloaded

    COMP1314 Intranet Interactions COMP1314 Lecture/Tutorial Views COMP1314 CW Specification Views 86   75   5.3  per  day   1,439   213   278   103   8   Average “First” Student on COMP1314 Average Mark Attendance % Total Intranet Interactions Intranet Files Downloaded COMP1314 Intranet Interactions COMP1314 Lecture/Tutorial Views COMP1314 CW Specification Views 21   40   2.6  per  day   696   121   118   52   5   Average “Failing” Student on COMP1314 from September 1st, 2012 to May 29th, 2013
  18. “First” Students vs “Failing” Students COMP1314 Average Intranet Interactions  

    0   10   20   30   40   50   60   Sep   Oct   Nov   Dec   Jan   Feb   Mar   Apr   May   Average  Number  of  Intranet  Interac7ons   First  Logs   Fail  Logs  
  19. CONCLUSIONS Attendance - the first year module, showed a positive

    correlation with a student’s final grade at similar levels to previously reported accounts Resources - the level/year and type of assessment should be taken into account when building predictive algorithms Repeated Downloading - either lower levels of expected digital literacy or a shift to the “cloud”