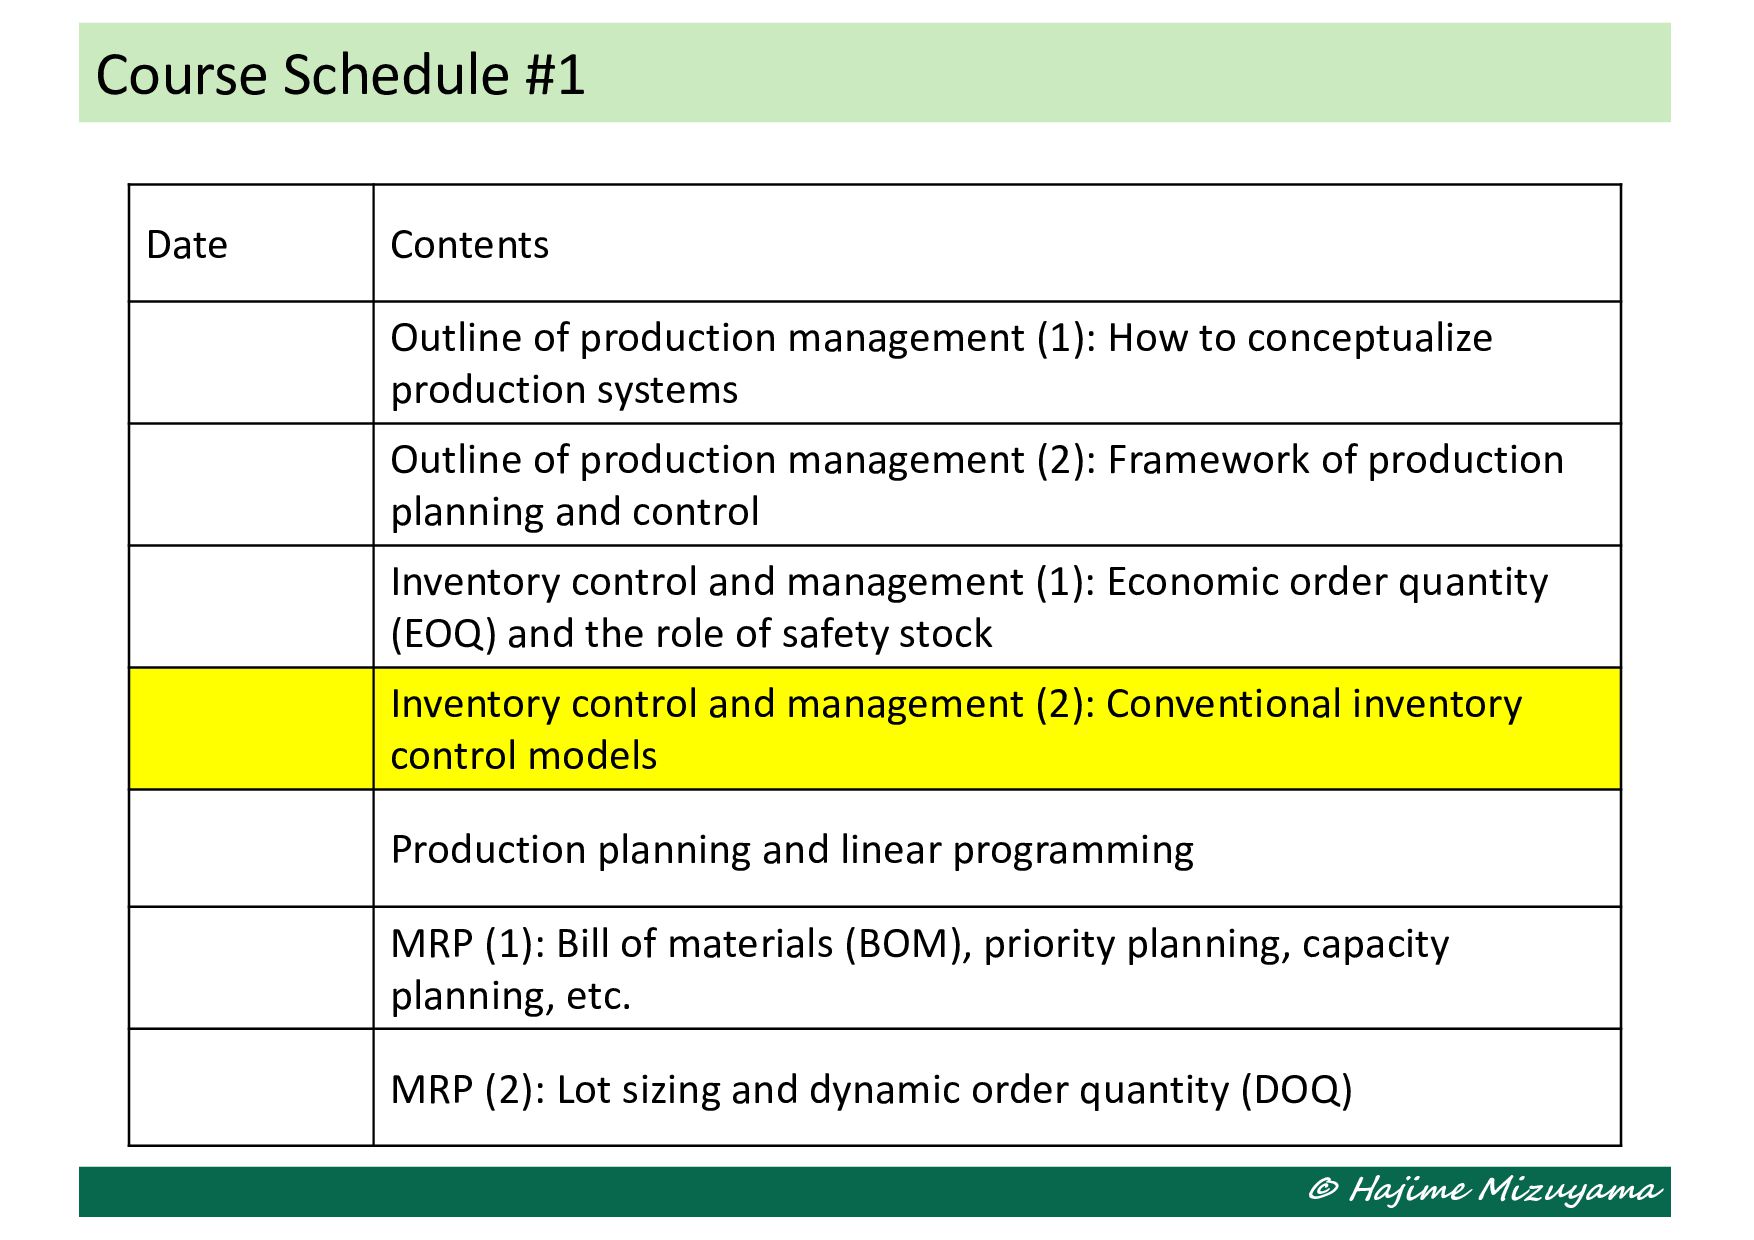
production management (1): How to conceptualize production systems Outline of production management (2): Framework of production planning and control Inventory control and management (1): Economic order quantity (EOQ) and the role of safety stock Inventory control and management (2): Conventional inventory control models Production planning and linear programming MRP (1): Bill of materials (BOM), priority planning, capacity planning, etc. MRP (2): Lot sizing and dynamic order quantity (DOQ)
receipt Delivery Demand side Supply side Inventory level Time When & how many? At the beginning of time period t + LT +1. (= At the end of time period t + LT.) At the end of time period t.
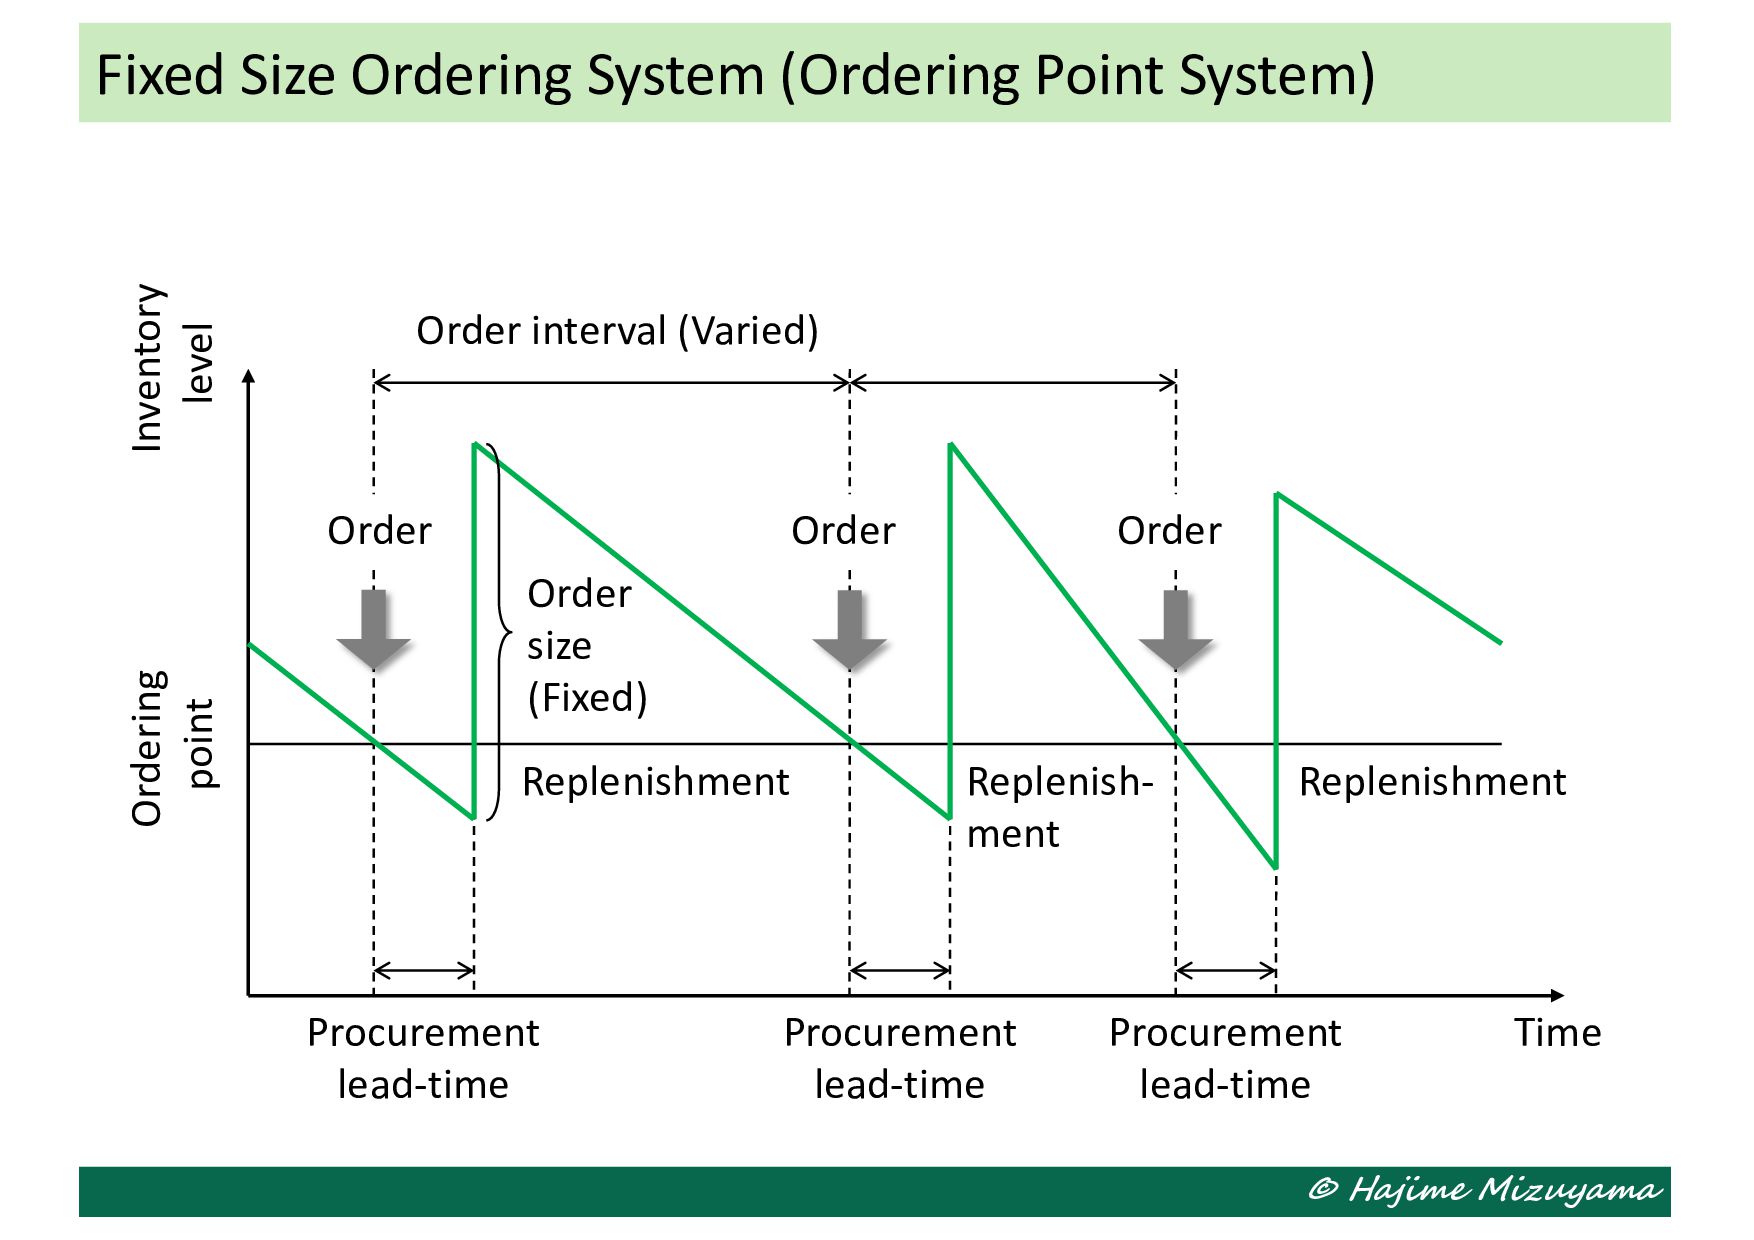
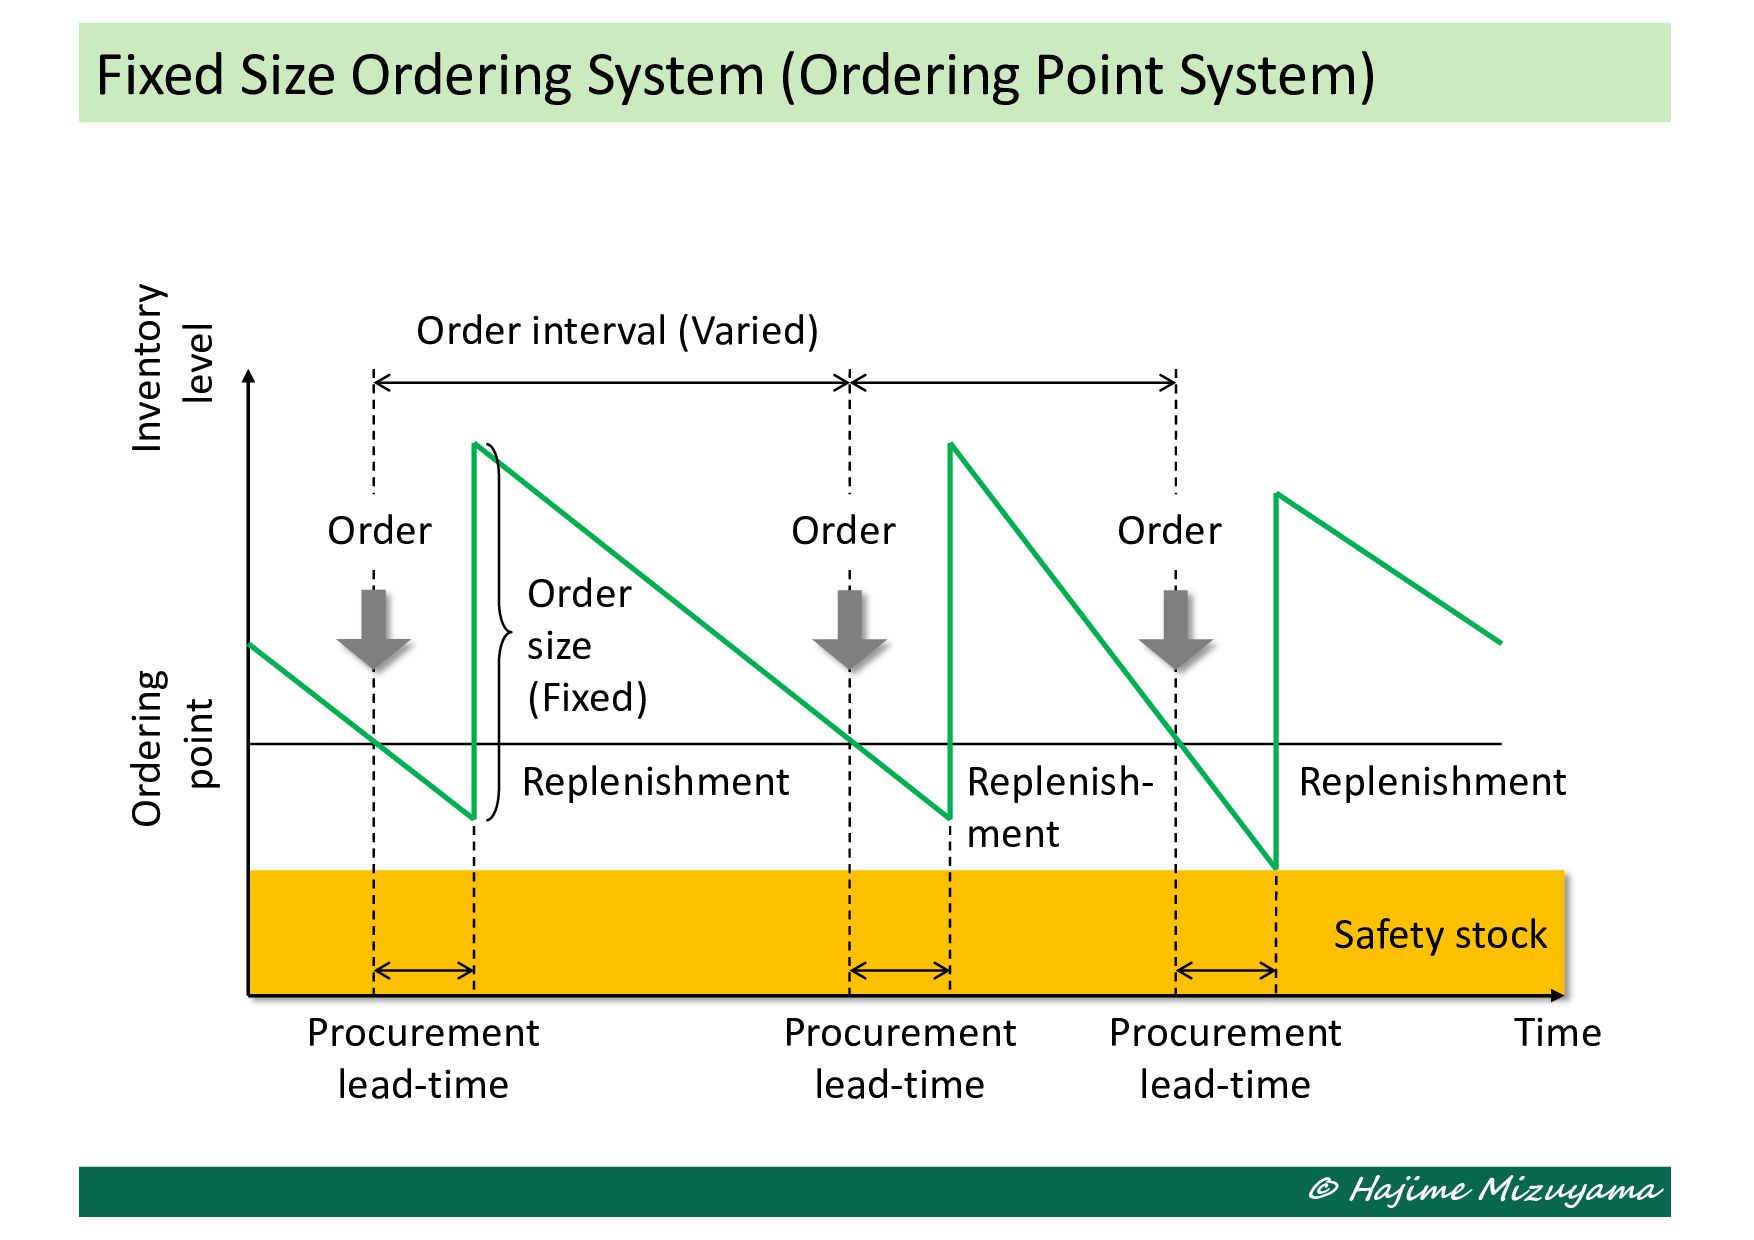
Order Replenishment Time Procurement lead-time Order size (Fixed) Order interval (Varied) Inventory level Ordering point Order Order Replenishment Replenish- ment Procurement lead-time Procurement lead-time
Point System) Order Replenishment Time Procurement lead-time Order size (Fixed) Order interval (Varied) Inventory level Ordering point Order Order Replenishment Replenish- ment Procurement lead-time Procurement lead-time
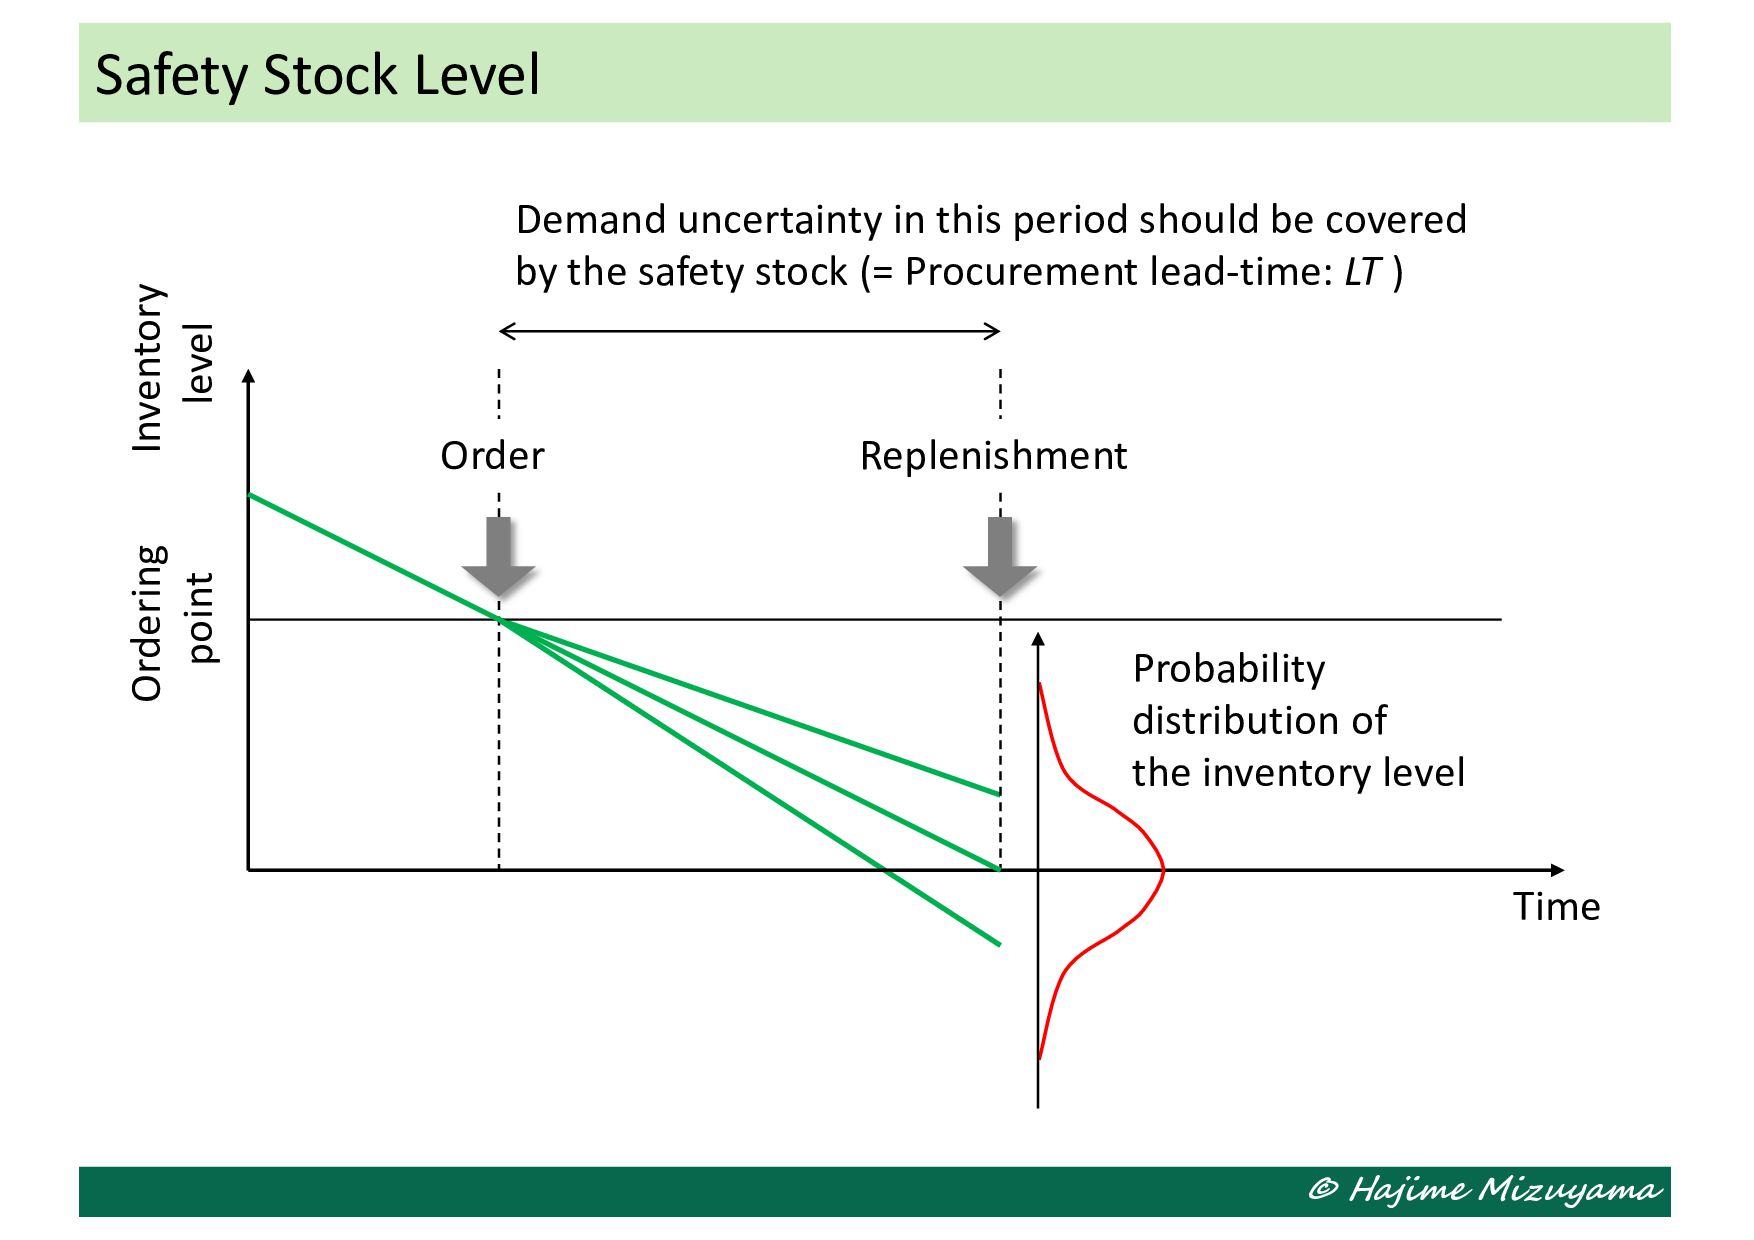
inventory level Demand uncertainty in this period should be covered by the safety stock (= Procurement lead-time: LT ) Time Inventory level Ordering point Order Replenishment
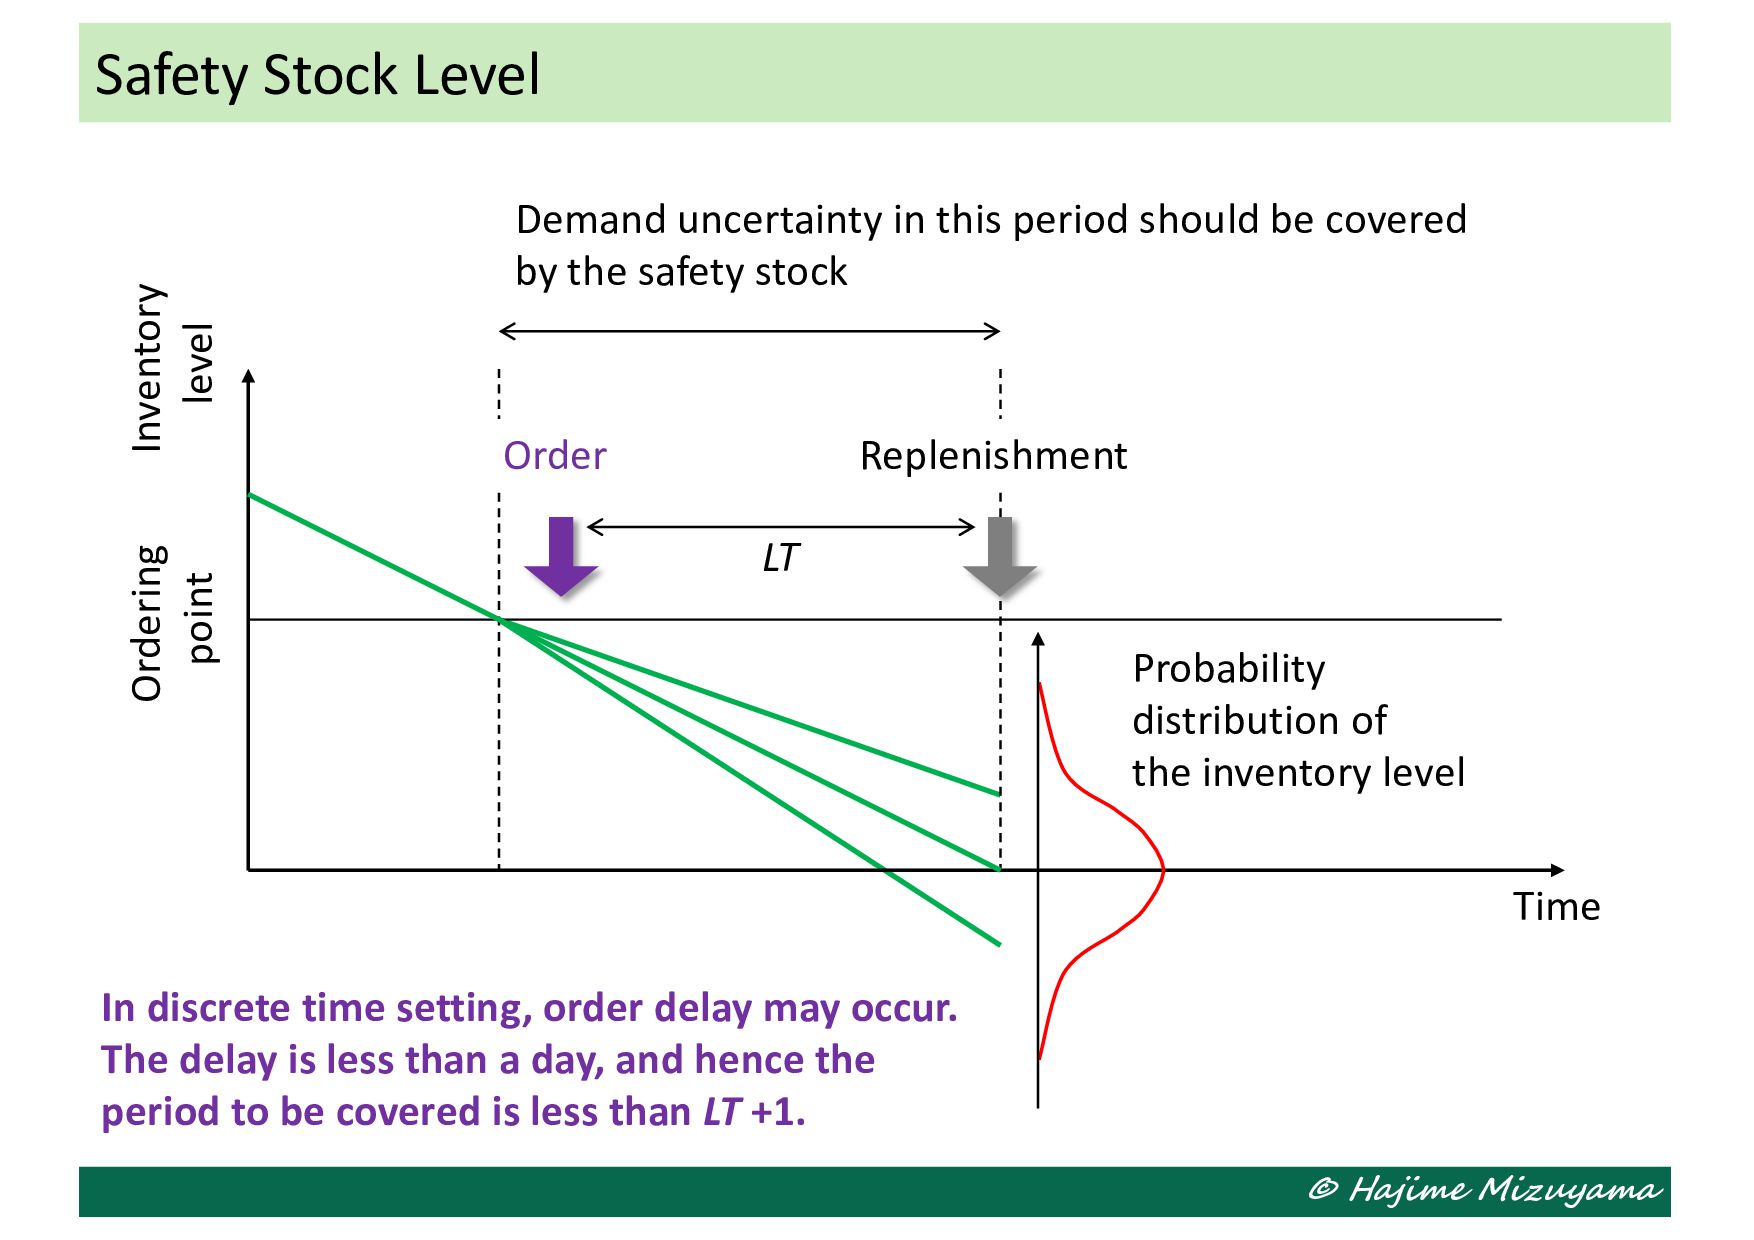
inventory level Time Inventory level Ordering point Replenishment Order In discrete time setting, order delay may occur. The delay is less than a day, and hence the period to be covered is less than LT +1. LT Demand uncertainty in this period should be covered by the safety stock
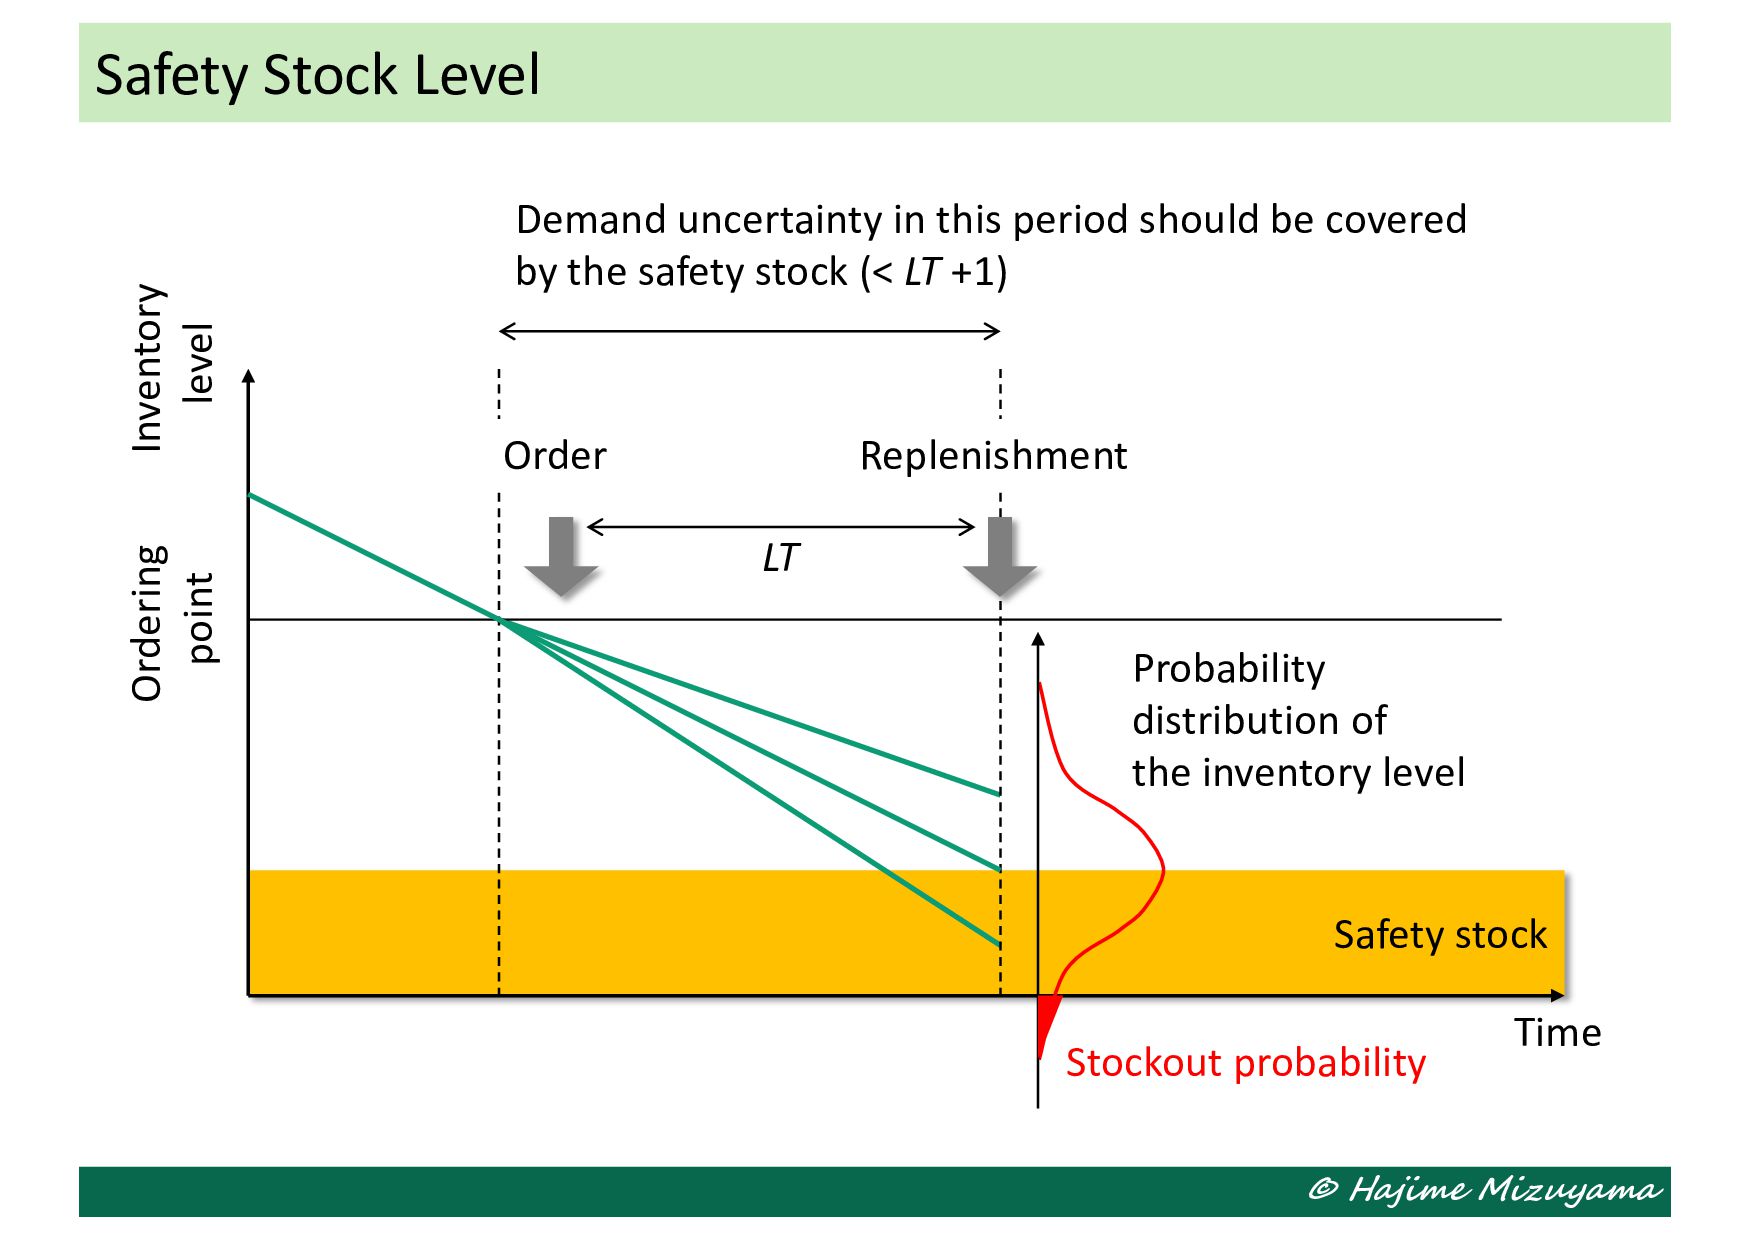
Demand uncertainty in this period should be covered by the safety stock (< LT +1) Inventory level Ordering point Order Replenishment Time Probability distribution of the inventory level LT
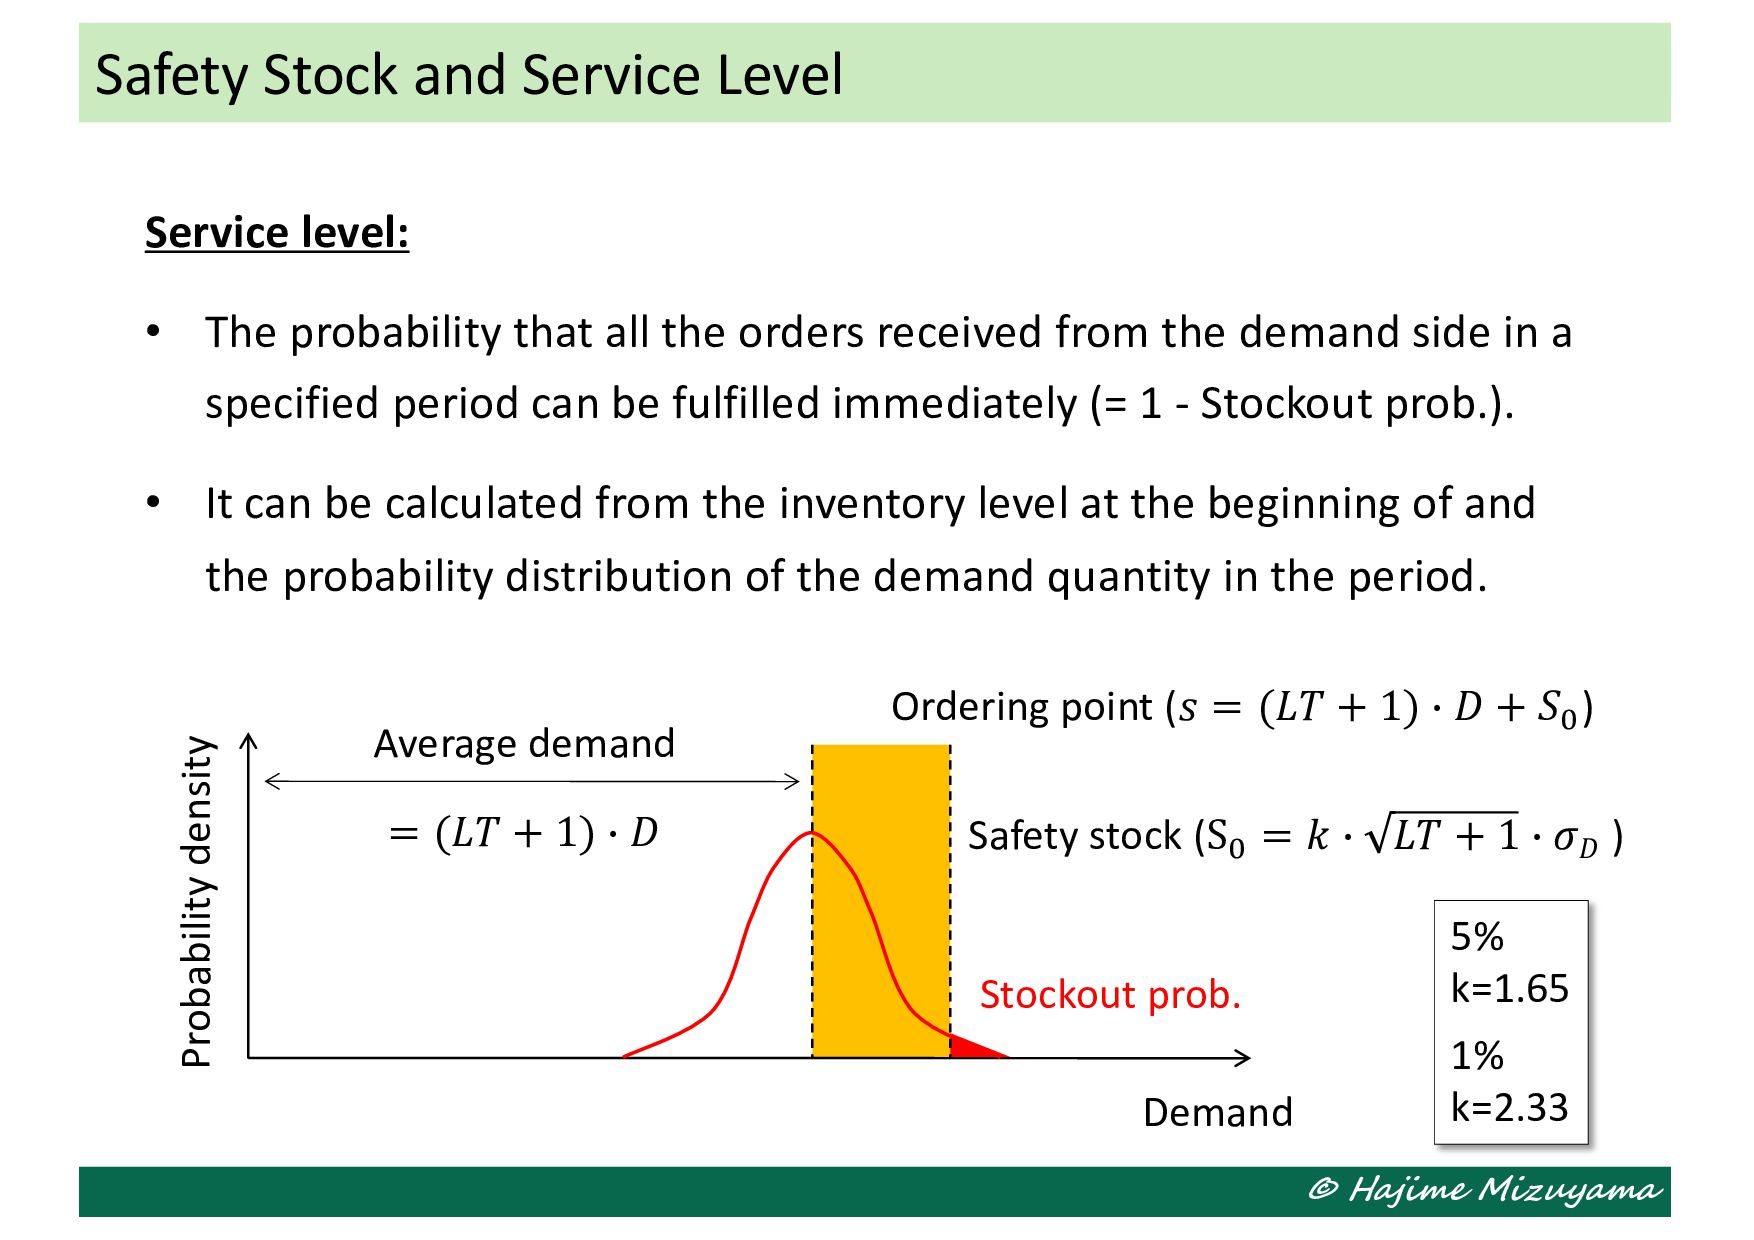
$ 𝐿𝑇 + 1 $ 𝜎𝐷 ) Ordering point (𝑠 = (𝐿𝑇 + 1) $ 𝐷 + 𝑆! ) 5% k=1.65 1% k=2.33 Service level: • The probability that all the orders received from the demand side in a specified period can be fulfilled immediately (= 1 - Stockout prob.). • It can be calculated from the inventory level at the beginning of and the probability distribution of the demand quantity in the period. Safety Stock and Service Level Probability density Demand Average demand = (𝐿𝑇 + 1) $ 𝐷
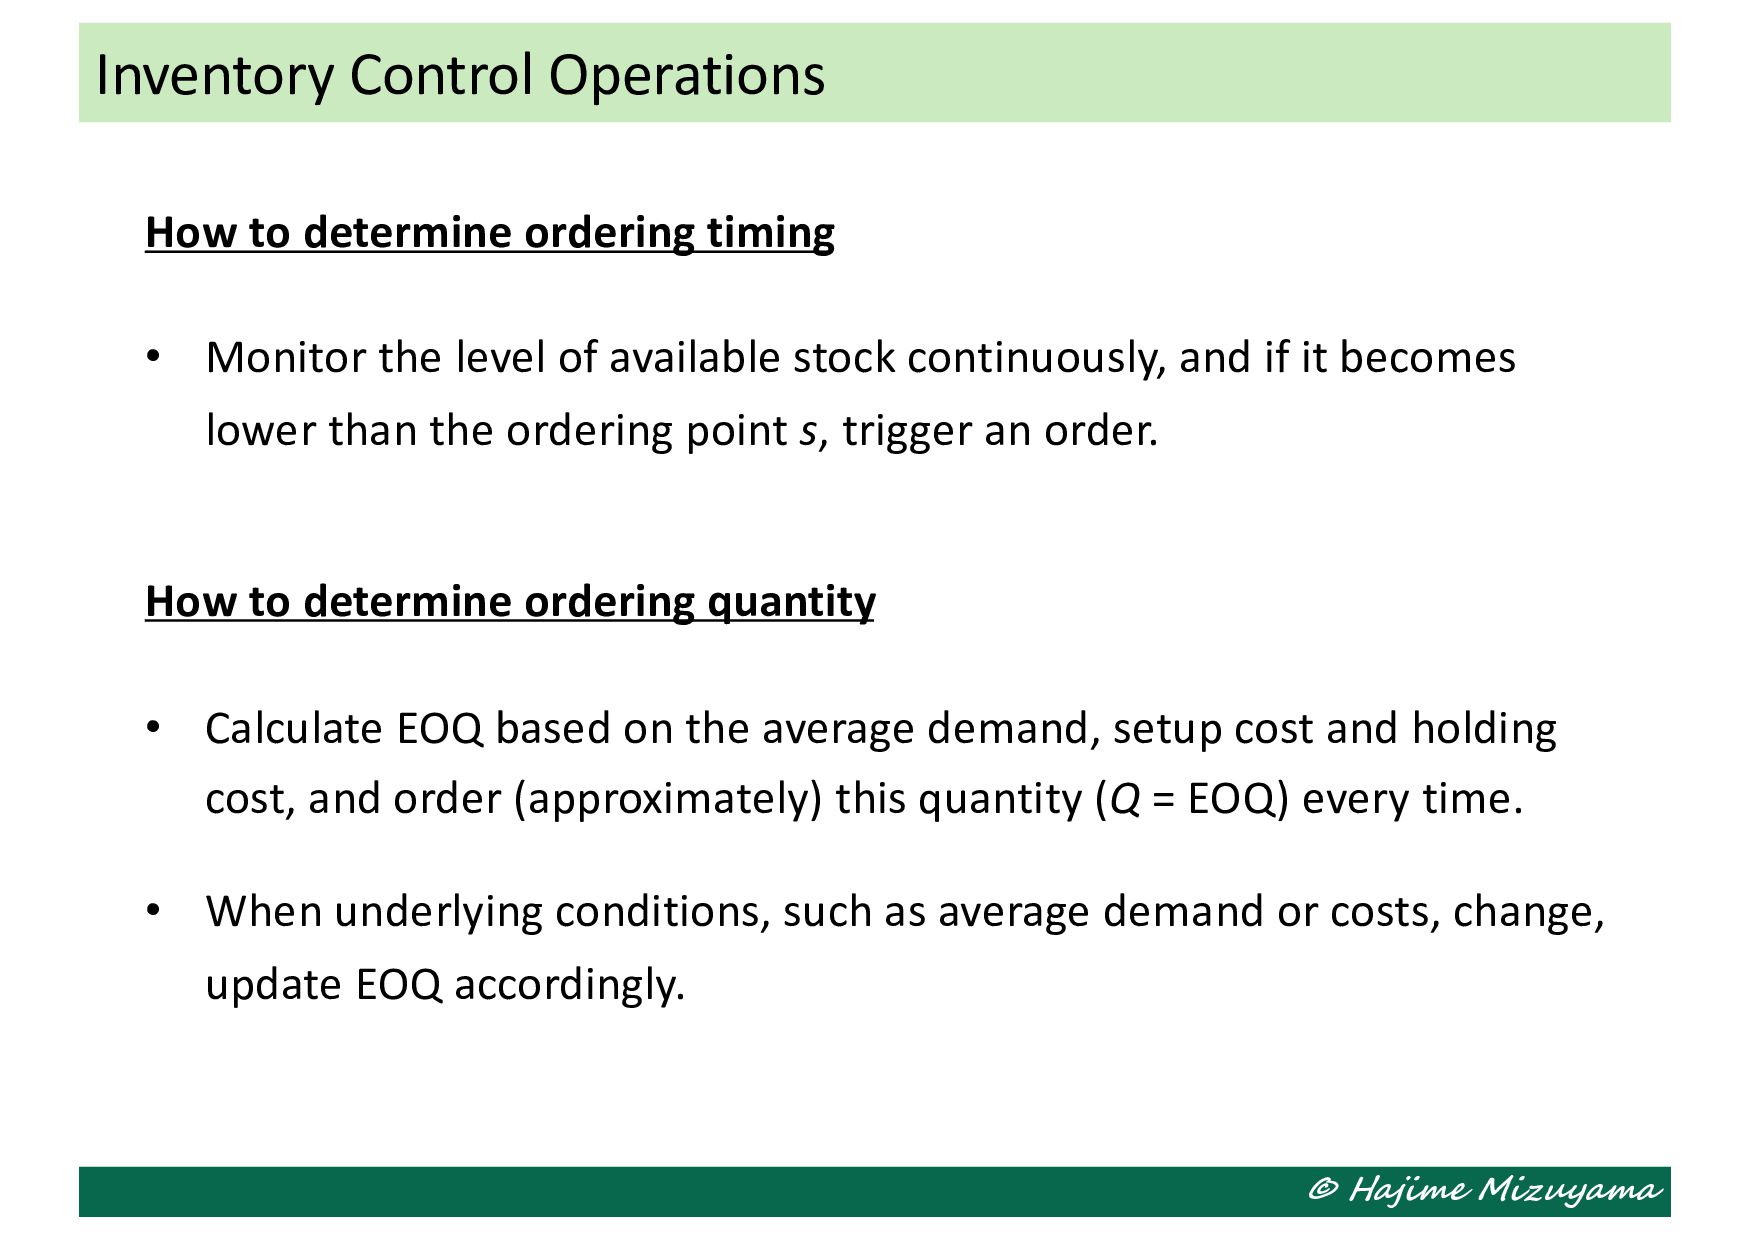
timing • Monitor the level of available stock continuously, and if it becomes lower than the ordering point s, trigger an order. How to determine ordering quantity • Calculate EOQ based on the average demand, setup cost and holding cost, and order (approximately) this quantity (Q = EOQ) every time. • When underlying conditions, such as average demand or costs, change, update EOQ accordingly.
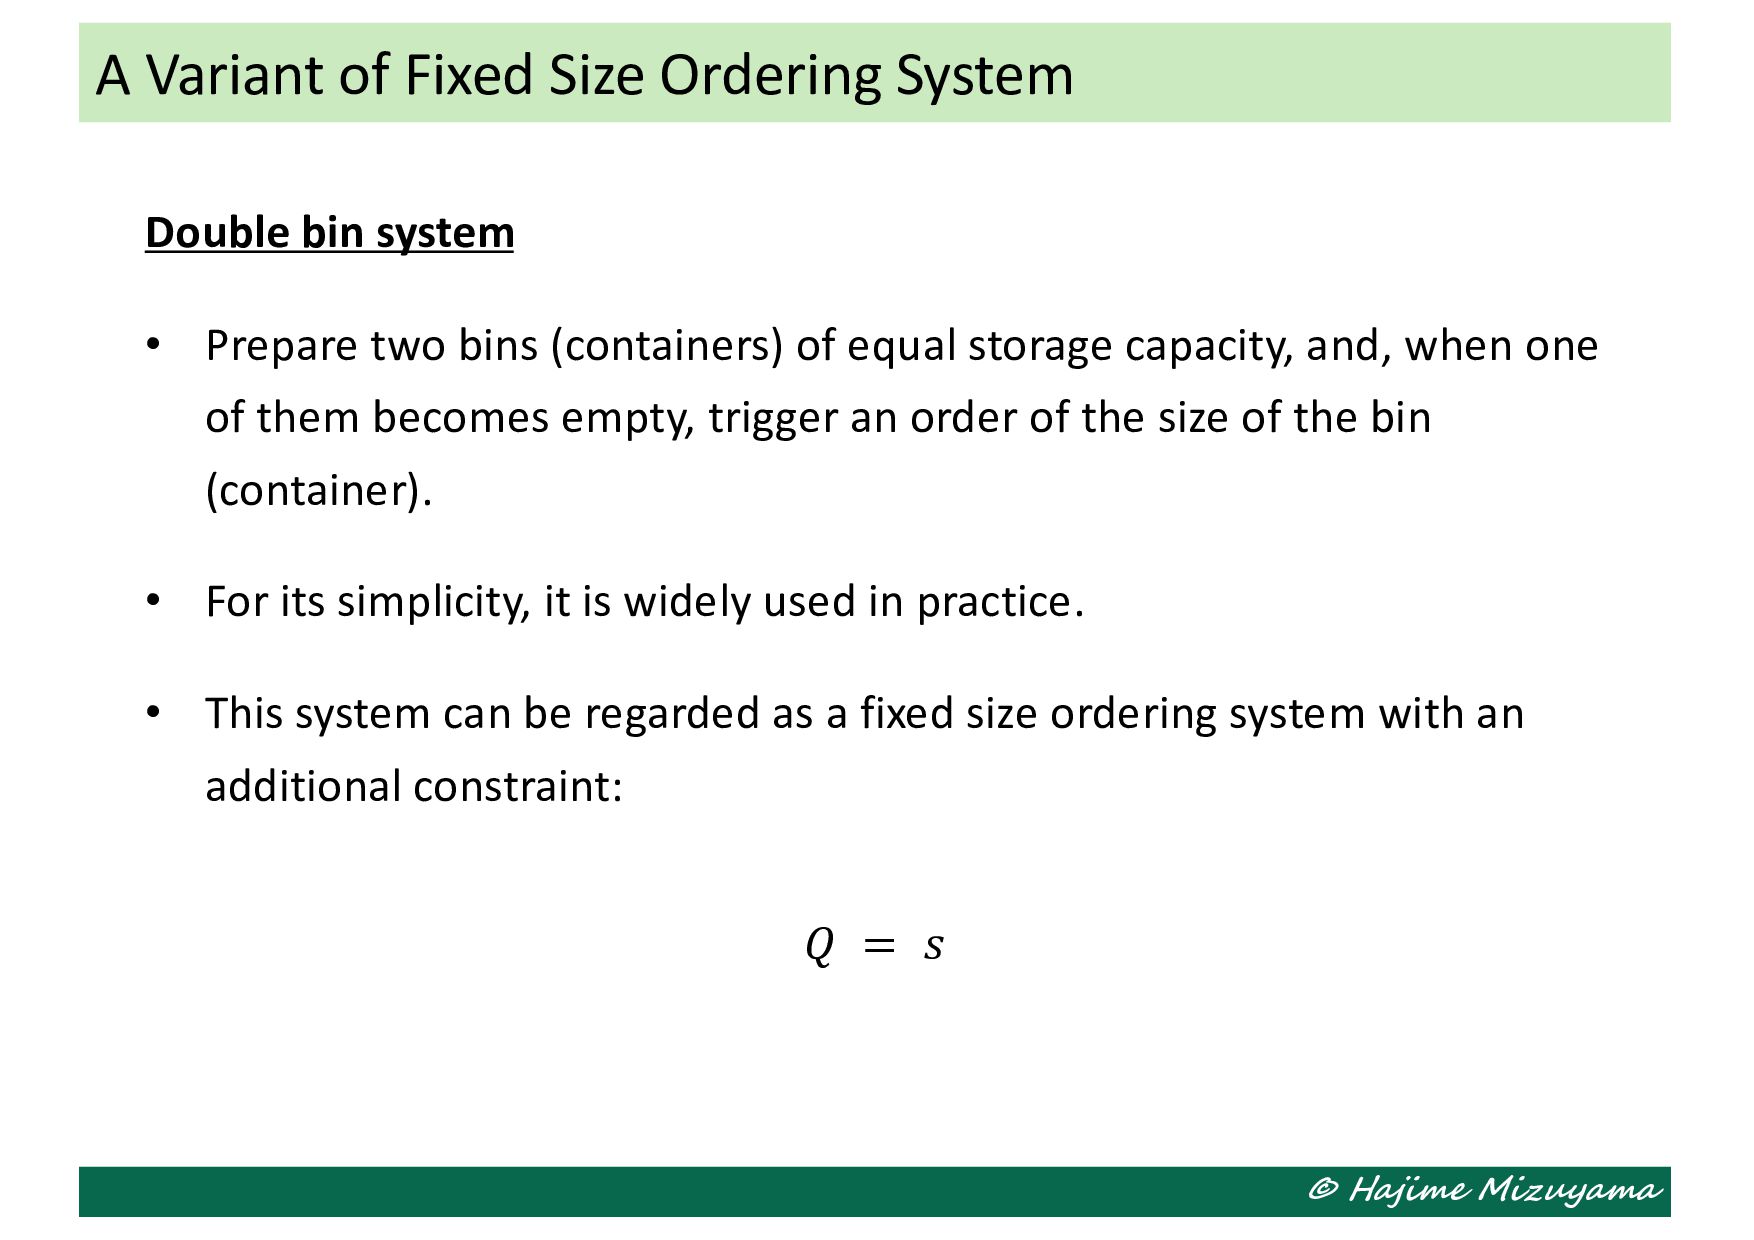
(containers) of equal storage capacity, and, when one of them becomes empty, trigger an order of the size of the bin (container). • For its simplicity, it is widely used in practice. • This system can be regarded as a fixed size ordering system with an additional constraint: 𝑄 = 𝑠 A Variant of Fixed Size Ordering System
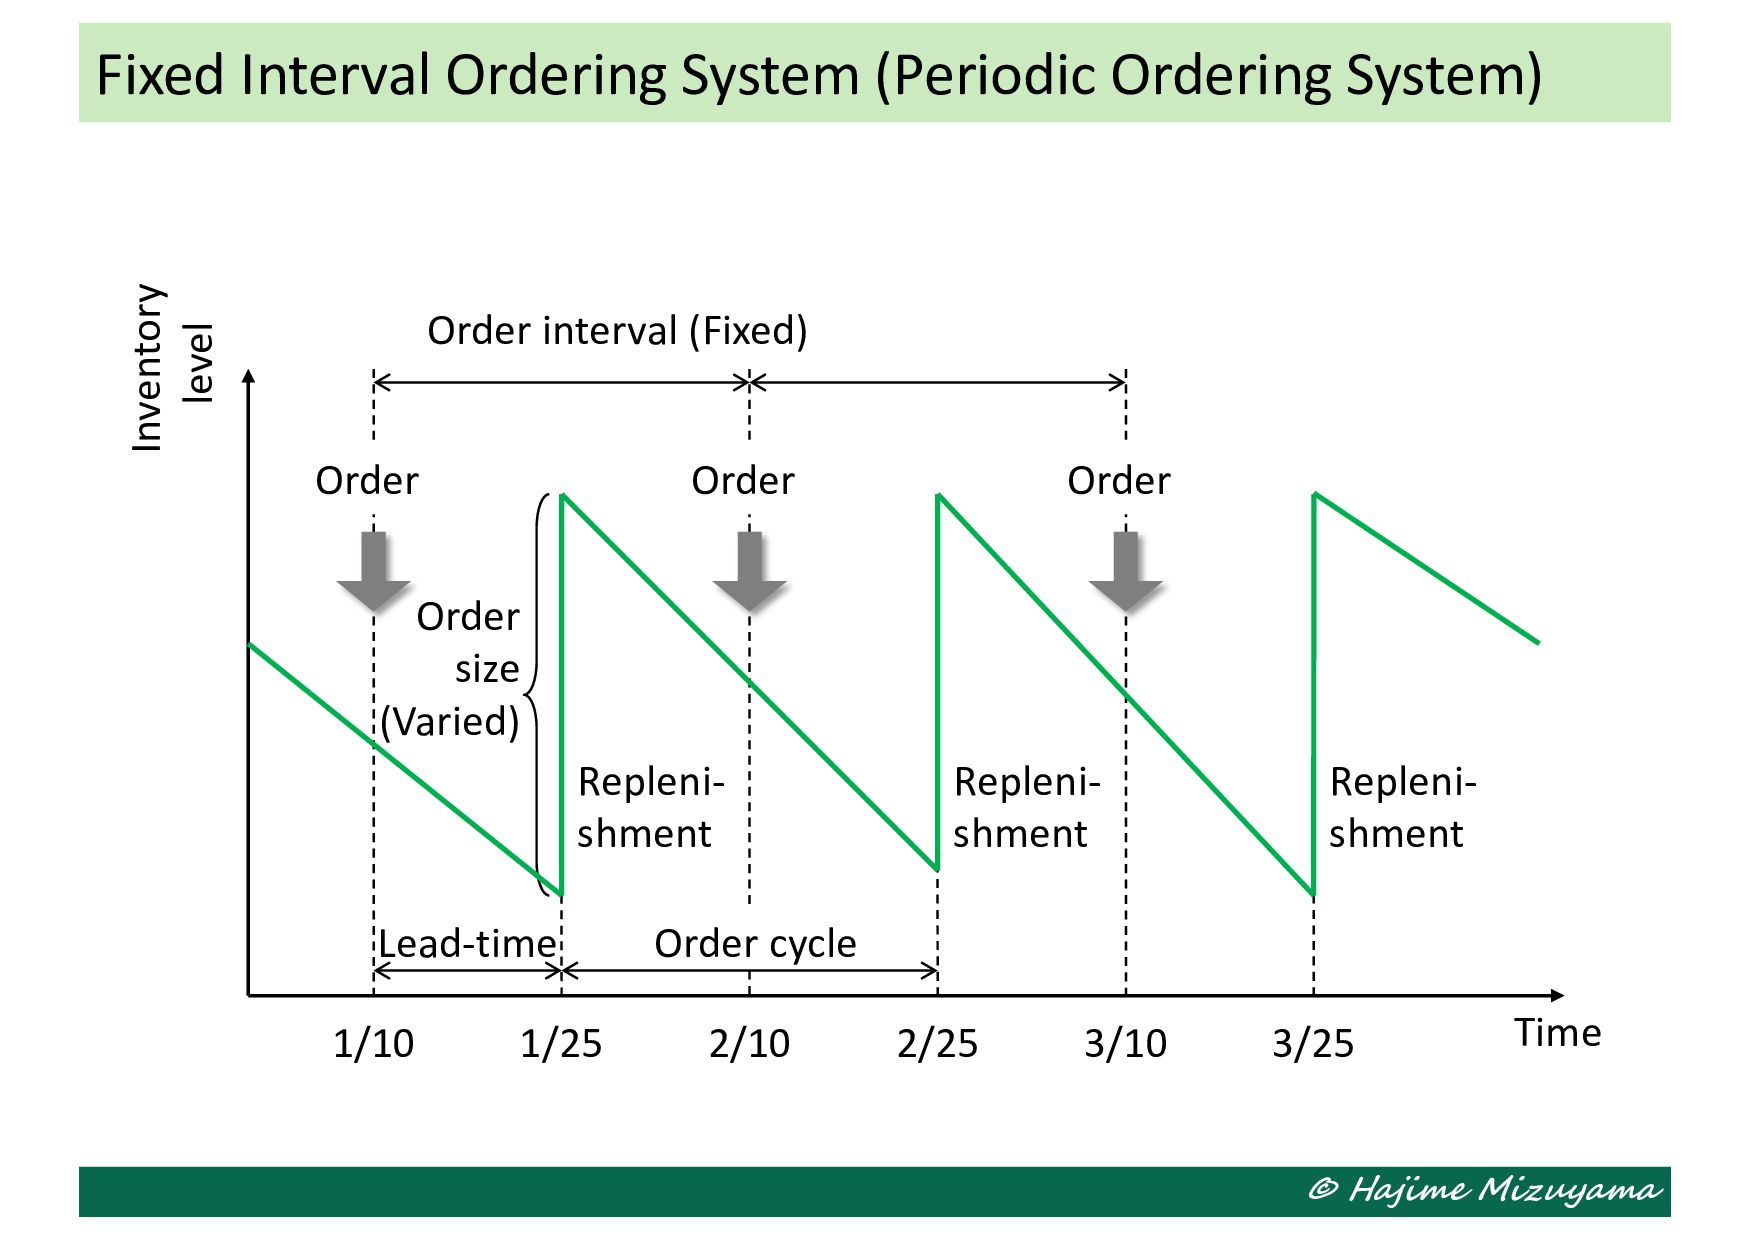
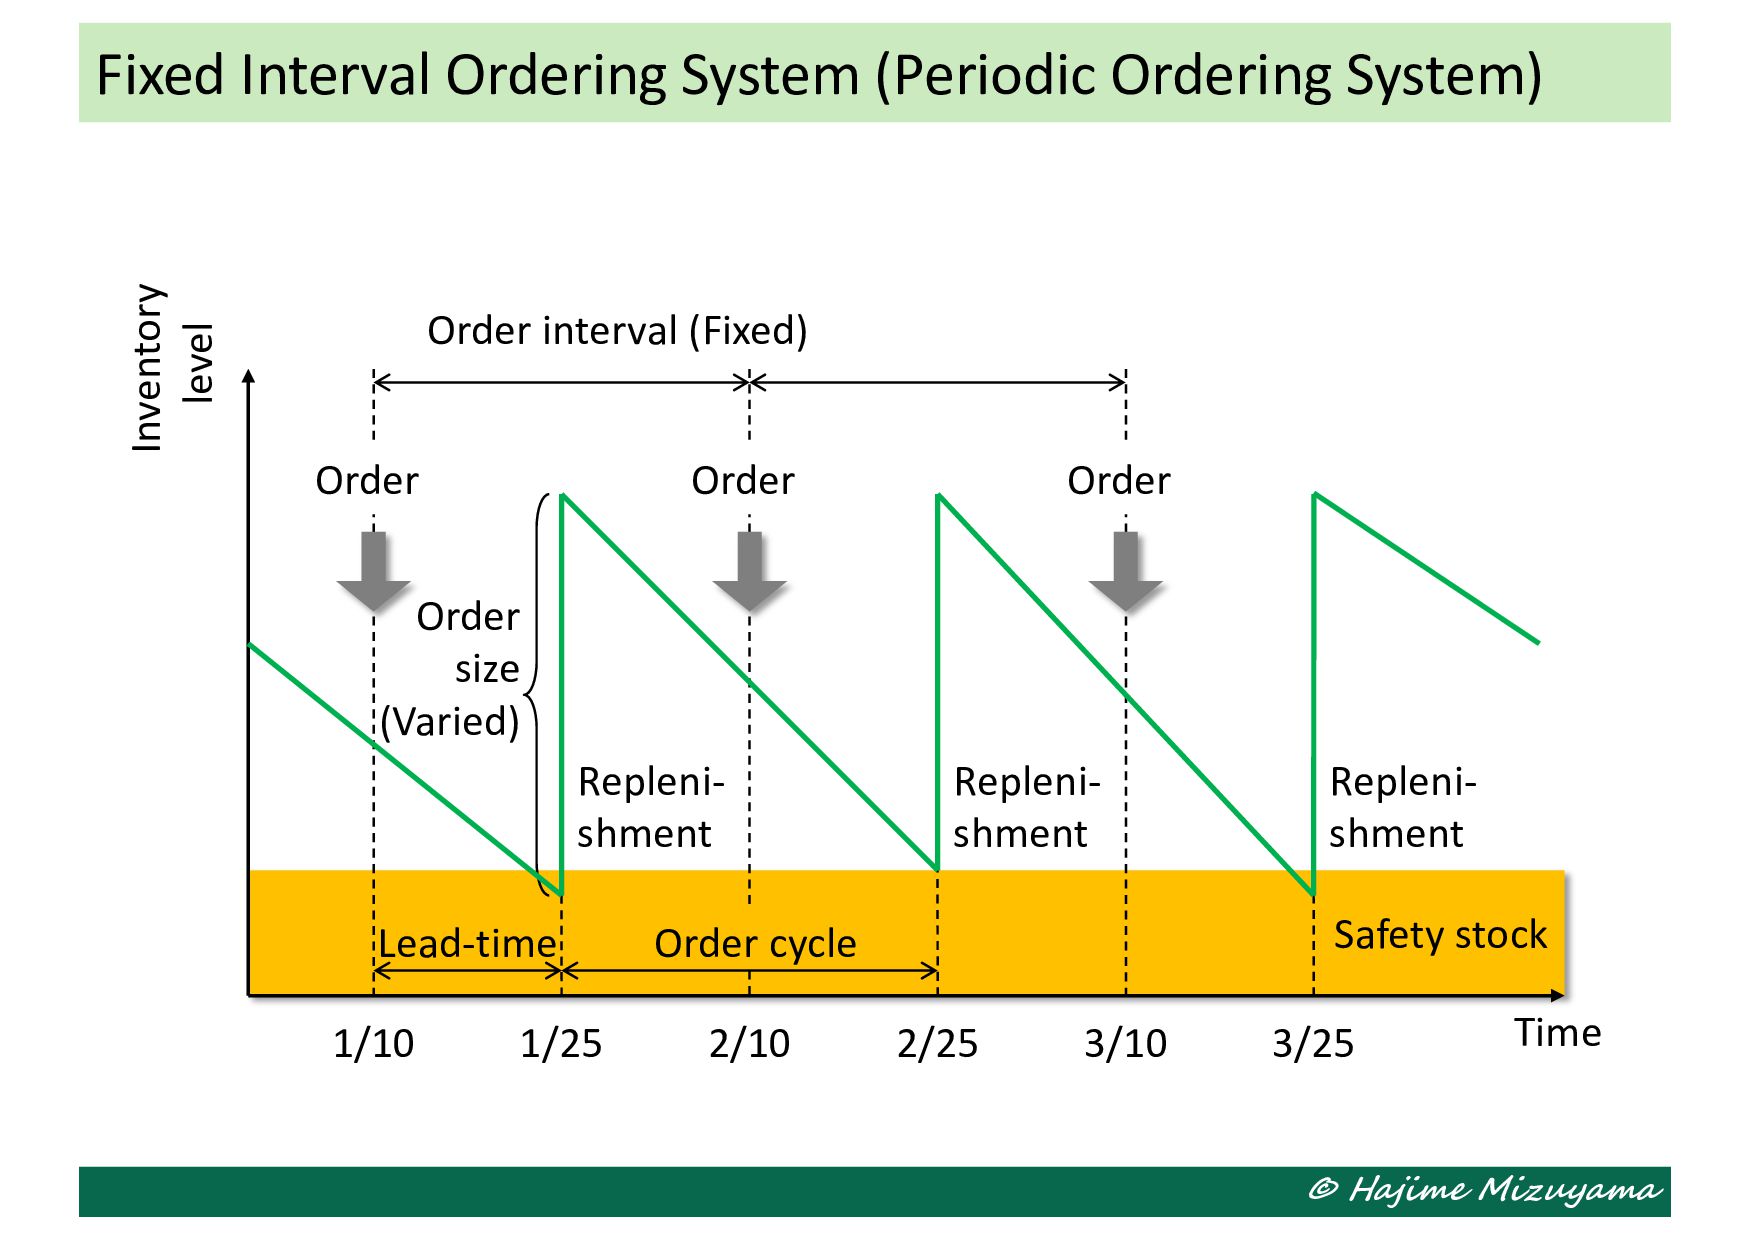
1/10 1/25 2/10 2/25 3/10 3/25 Lead-time Inventory level Order interval (Fixed) Order Order Order Repleni- shment Repleni- shment Repleni- shment Order size (Varied) Time Order cycle
Ordering System) 1/10 1/25 2/10 2/25 3/10 3/25 Lead-time Order cycle Inventory level Order interval (Fixed) Order Order Order Repleni- shment Repleni- shment Repleni- shment Order size (Varied) Time
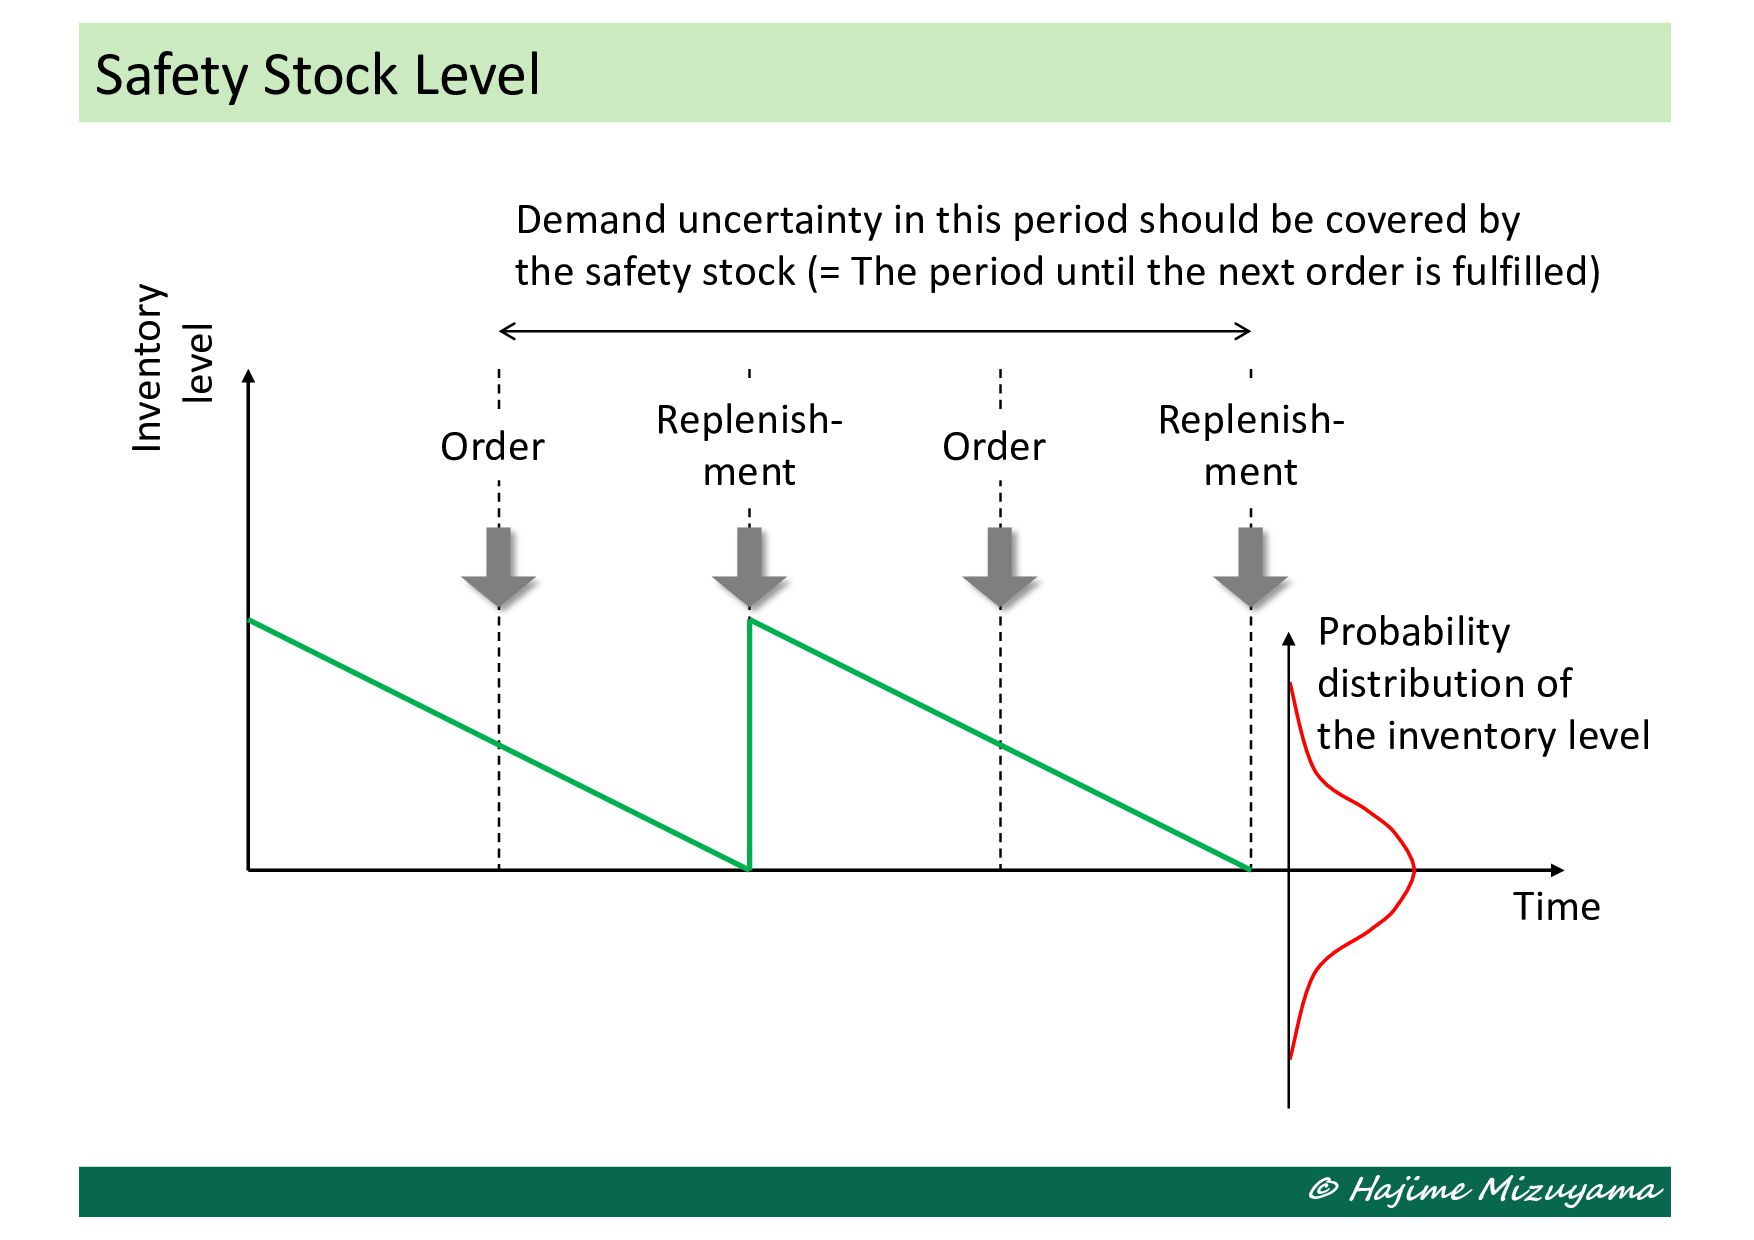
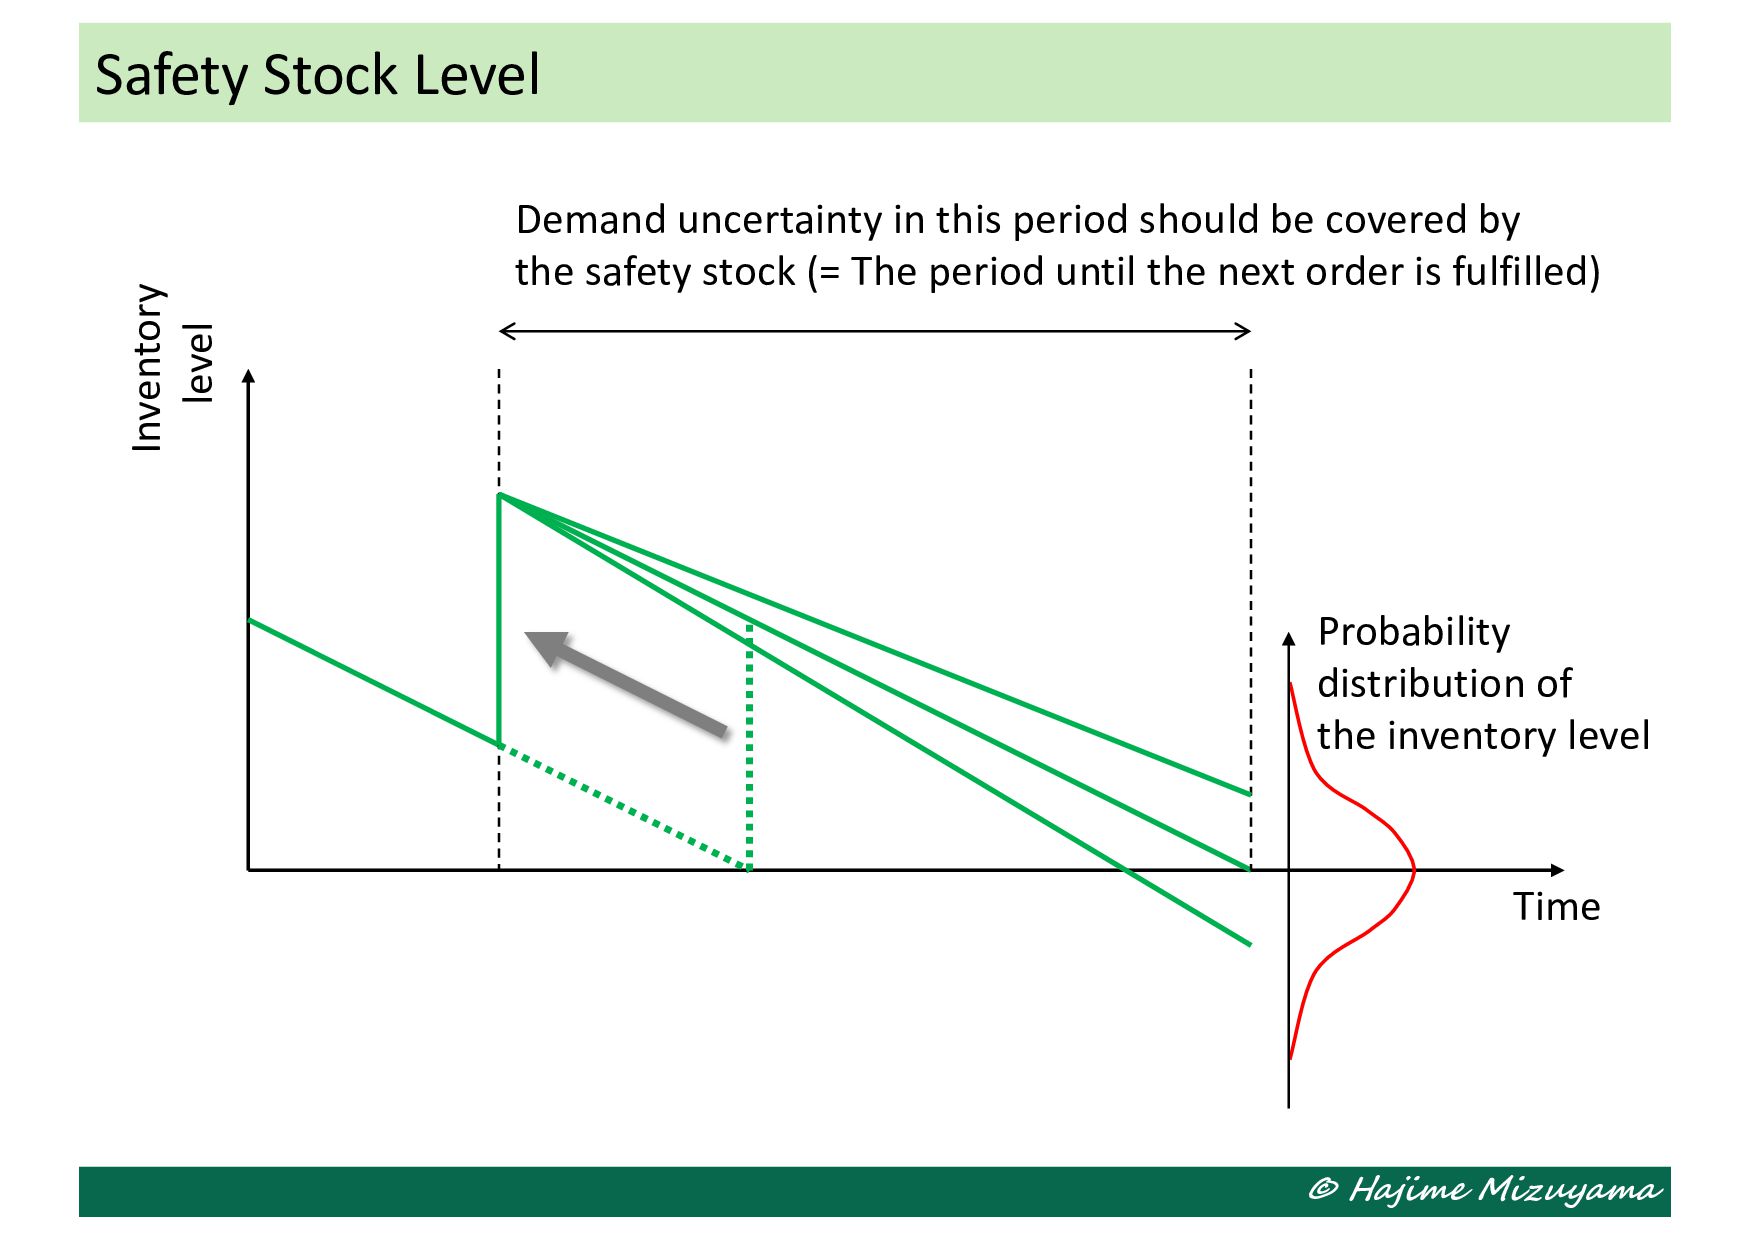
inventory level Inventory level Order Replenish- ment Order Replenish- ment Time Demand uncertainty in this period should be covered by the safety stock (= The period until the next order is fulfilled)
inventory level Time Demand uncertainty in this period should be covered by the safety stock (= The period until the next order is fulfilled) Inventory level
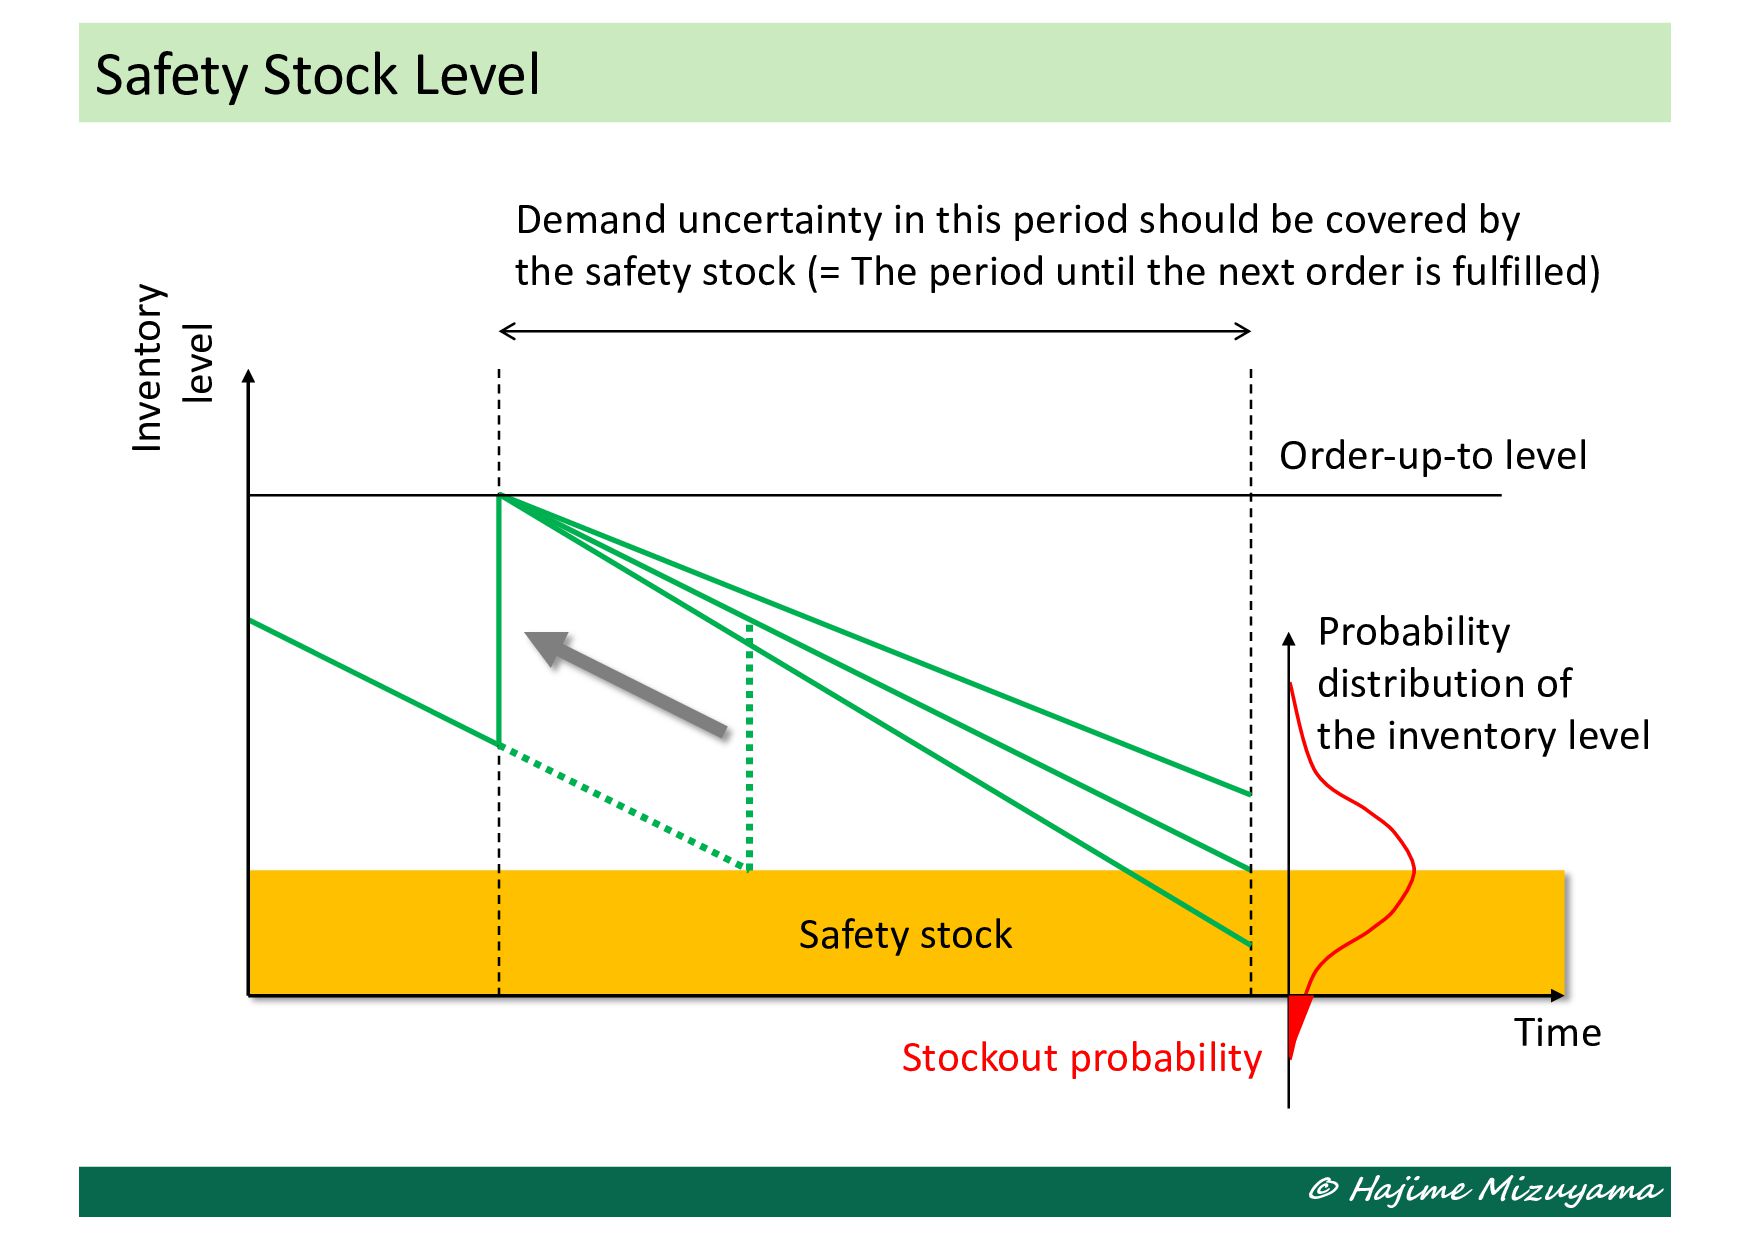
Probability distribution of the inventory level Inventory level Time Order-up-to level Demand uncertainty in this period should be covered by the safety stock (= The period until the next order is fulfilled)
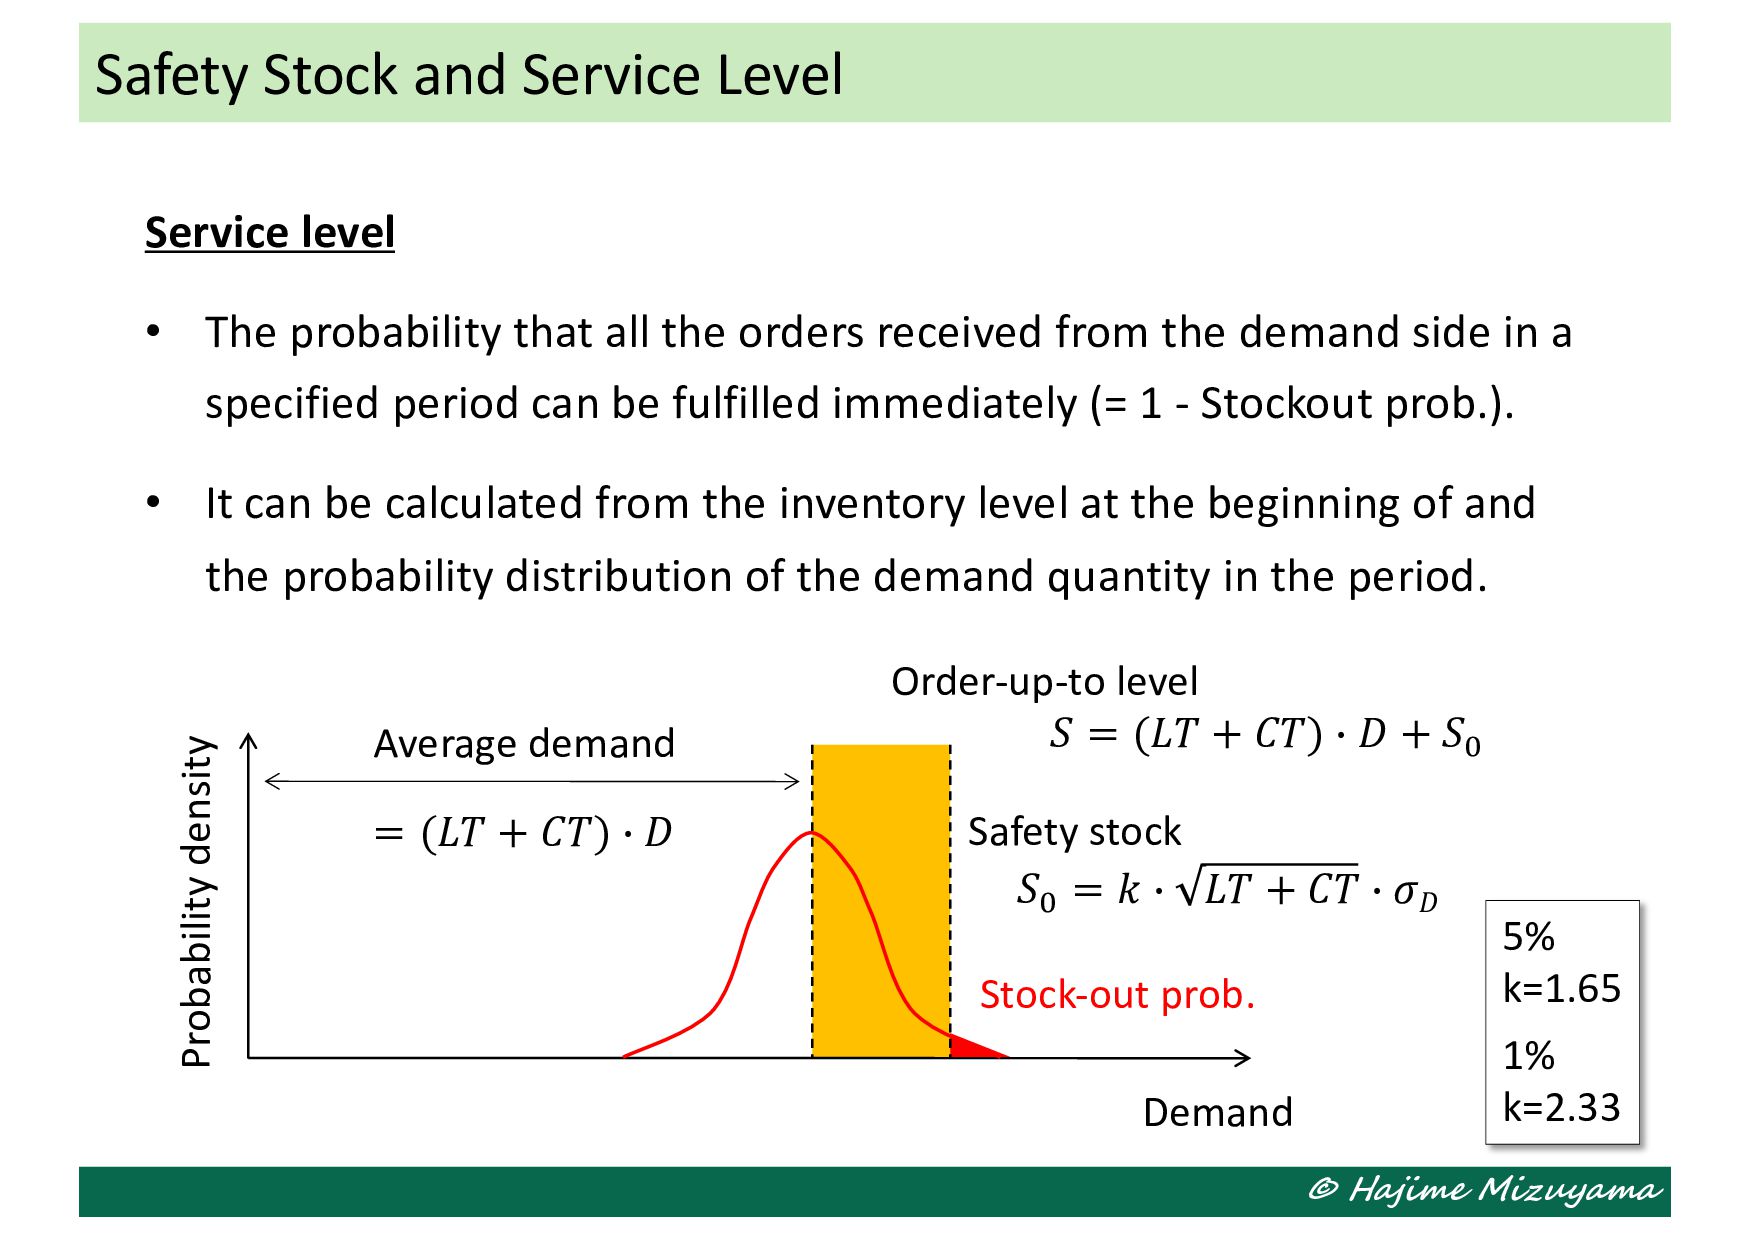
$ 𝐿𝑇 + 𝐶𝑇 $ 𝜎𝐷 Order-up-to level 𝑆 = (𝐿𝑇 + 𝐶𝑇) $ 𝐷 + 𝑆! 5% k=1.65 1% k=2.33 Service level • The probability that all the orders received from the demand side in a specified period can be fulfilled immediately (= 1 - Stockout prob.). • It can be calculated from the inventory level at the beginning of and the probability distribution of the demand quantity in the period. Safety Stock and Service Level Probability density Demand Average demand = (𝐿𝑇 + 𝐶𝑇) $ 𝐷
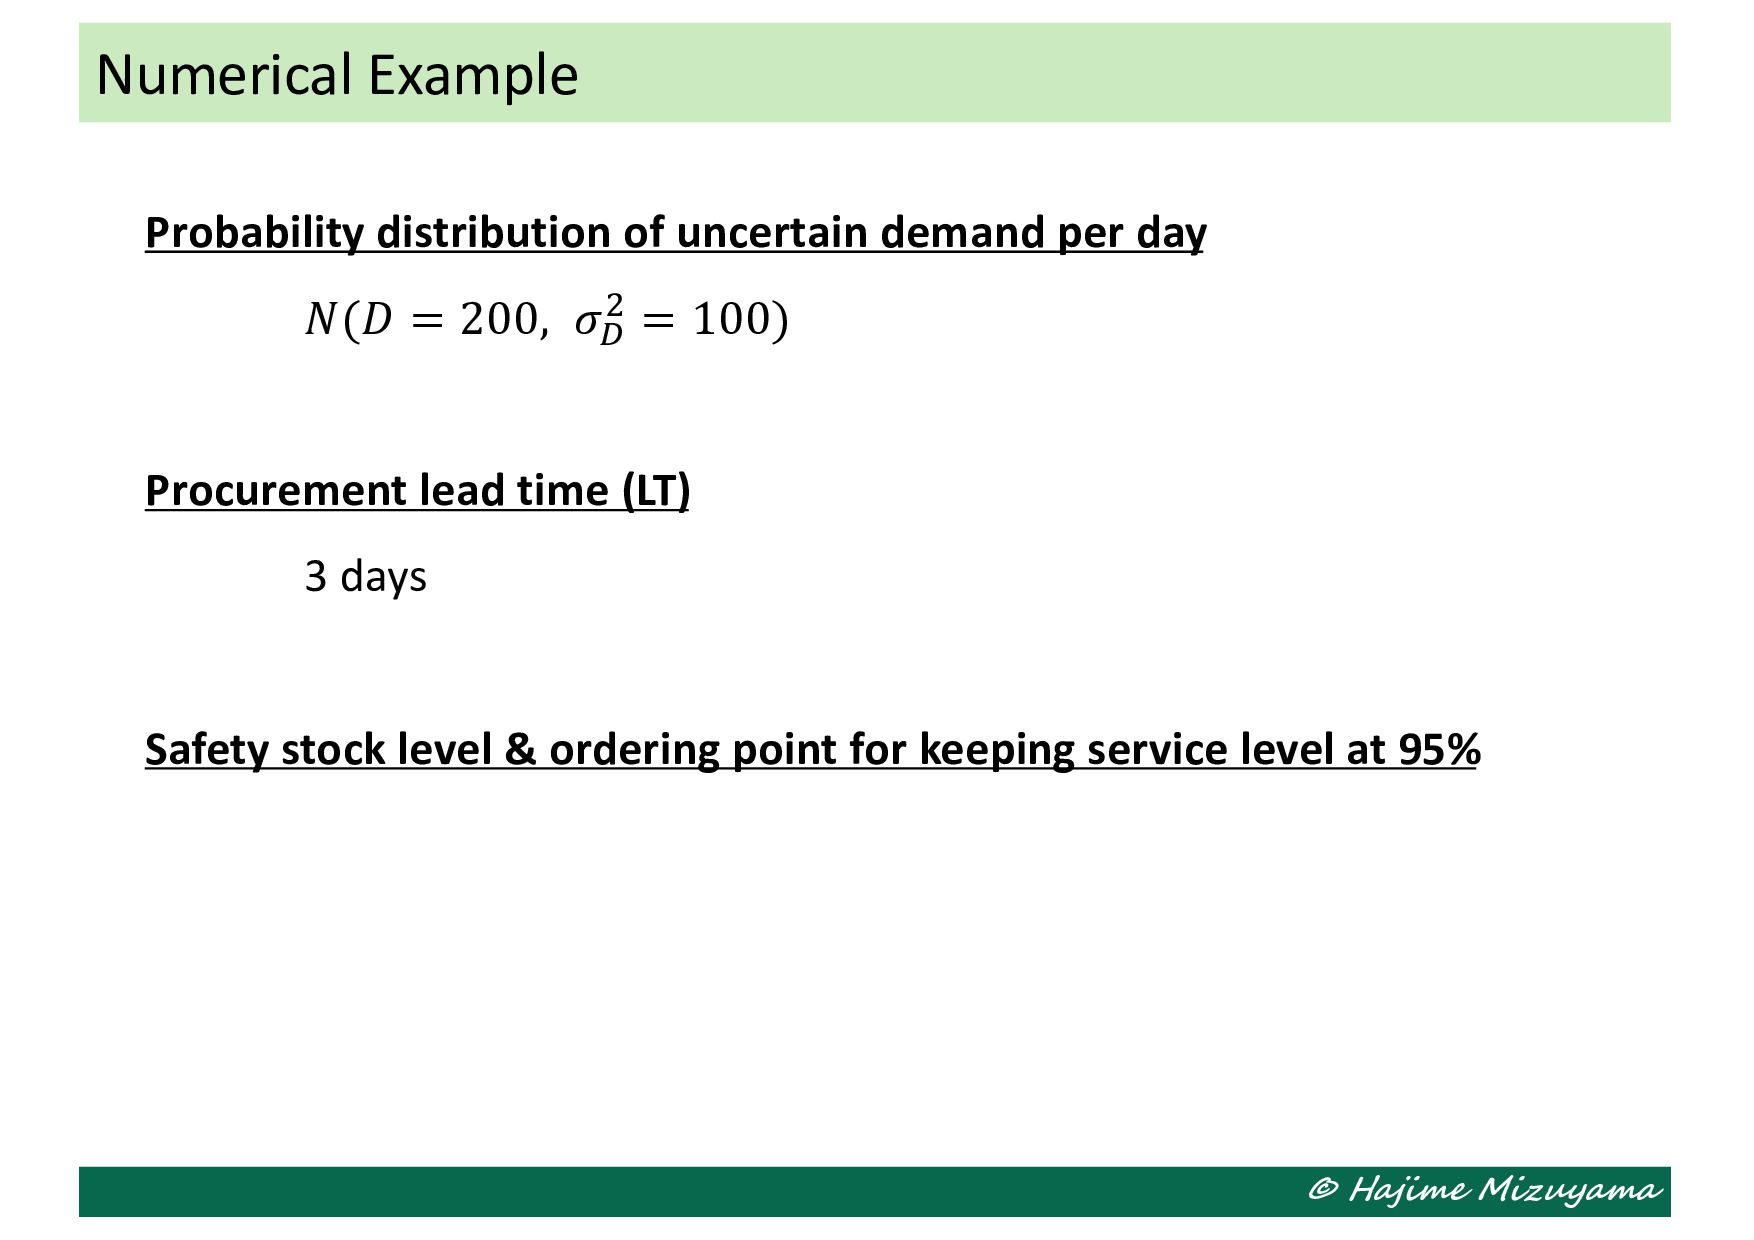
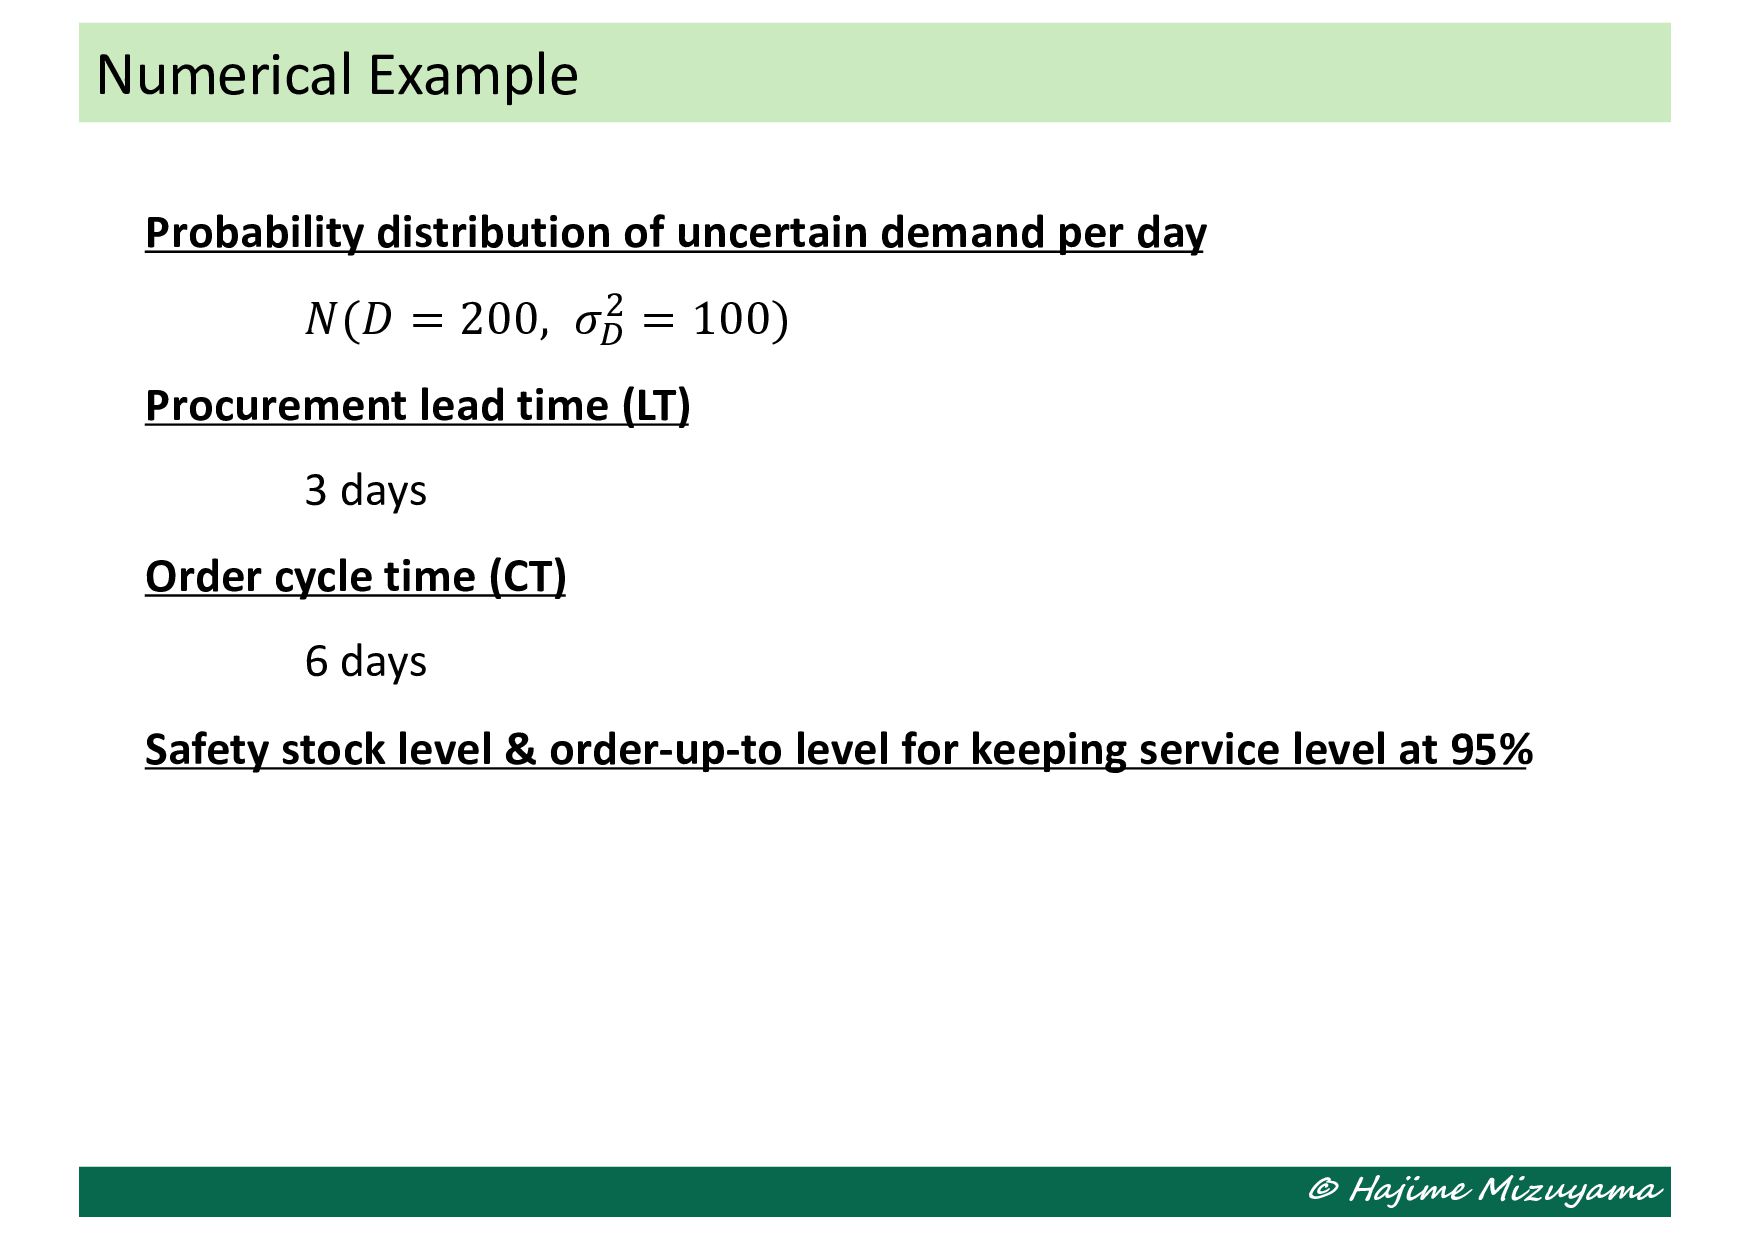
𝑁(𝐷 = 200, 𝜎! " = 100) Procurement lead time (LT) 3 days Order cycle time (CT) 6 days Safety stock level & order-up-to level for keeping service level at 95% Numerical Example
timing • Order periodically, e.g., every Monday, on nth day in every month, etc. How to determine ordering quantity • Q = Expected demand until the next order is fulfilled + Safety stock - Available stock at the time of ordering When this is treated as a constant value, it is called the order-up-to level S.
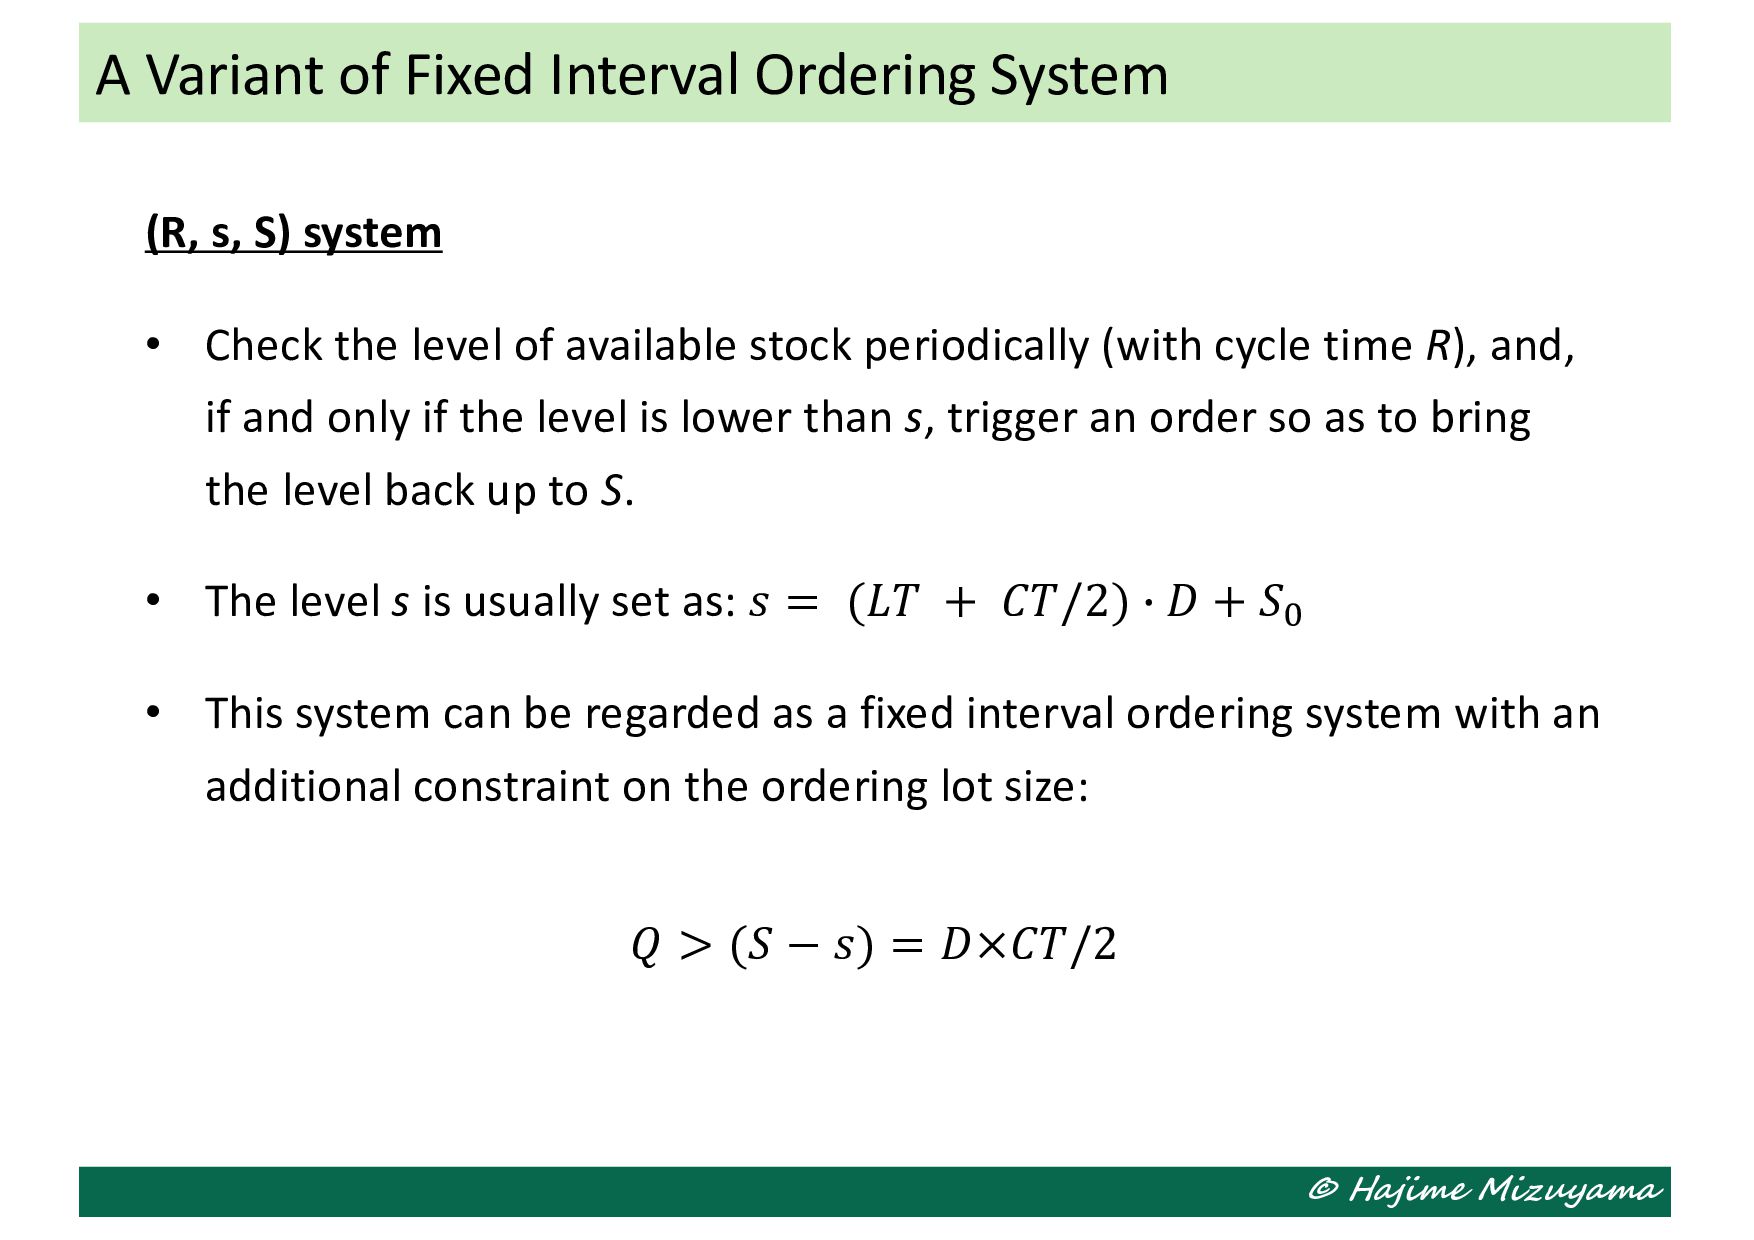
level of available stock periodically (with cycle time R), and, if and only if the level is lower than s, trigger an order so as to bring the level back up to S. • The level s is usually set as: 𝑠 = (𝐿𝑇 + 𝐶𝑇/2) 3 𝐷 + 𝑆# • This system can be regarded as a fixed interval ordering system with an additional constraint on the ordering lot size: 𝑄 > (𝑆 − 𝑠) = 𝐷×𝐶𝑇/2 A Variant of Fixed Interval Ordering System
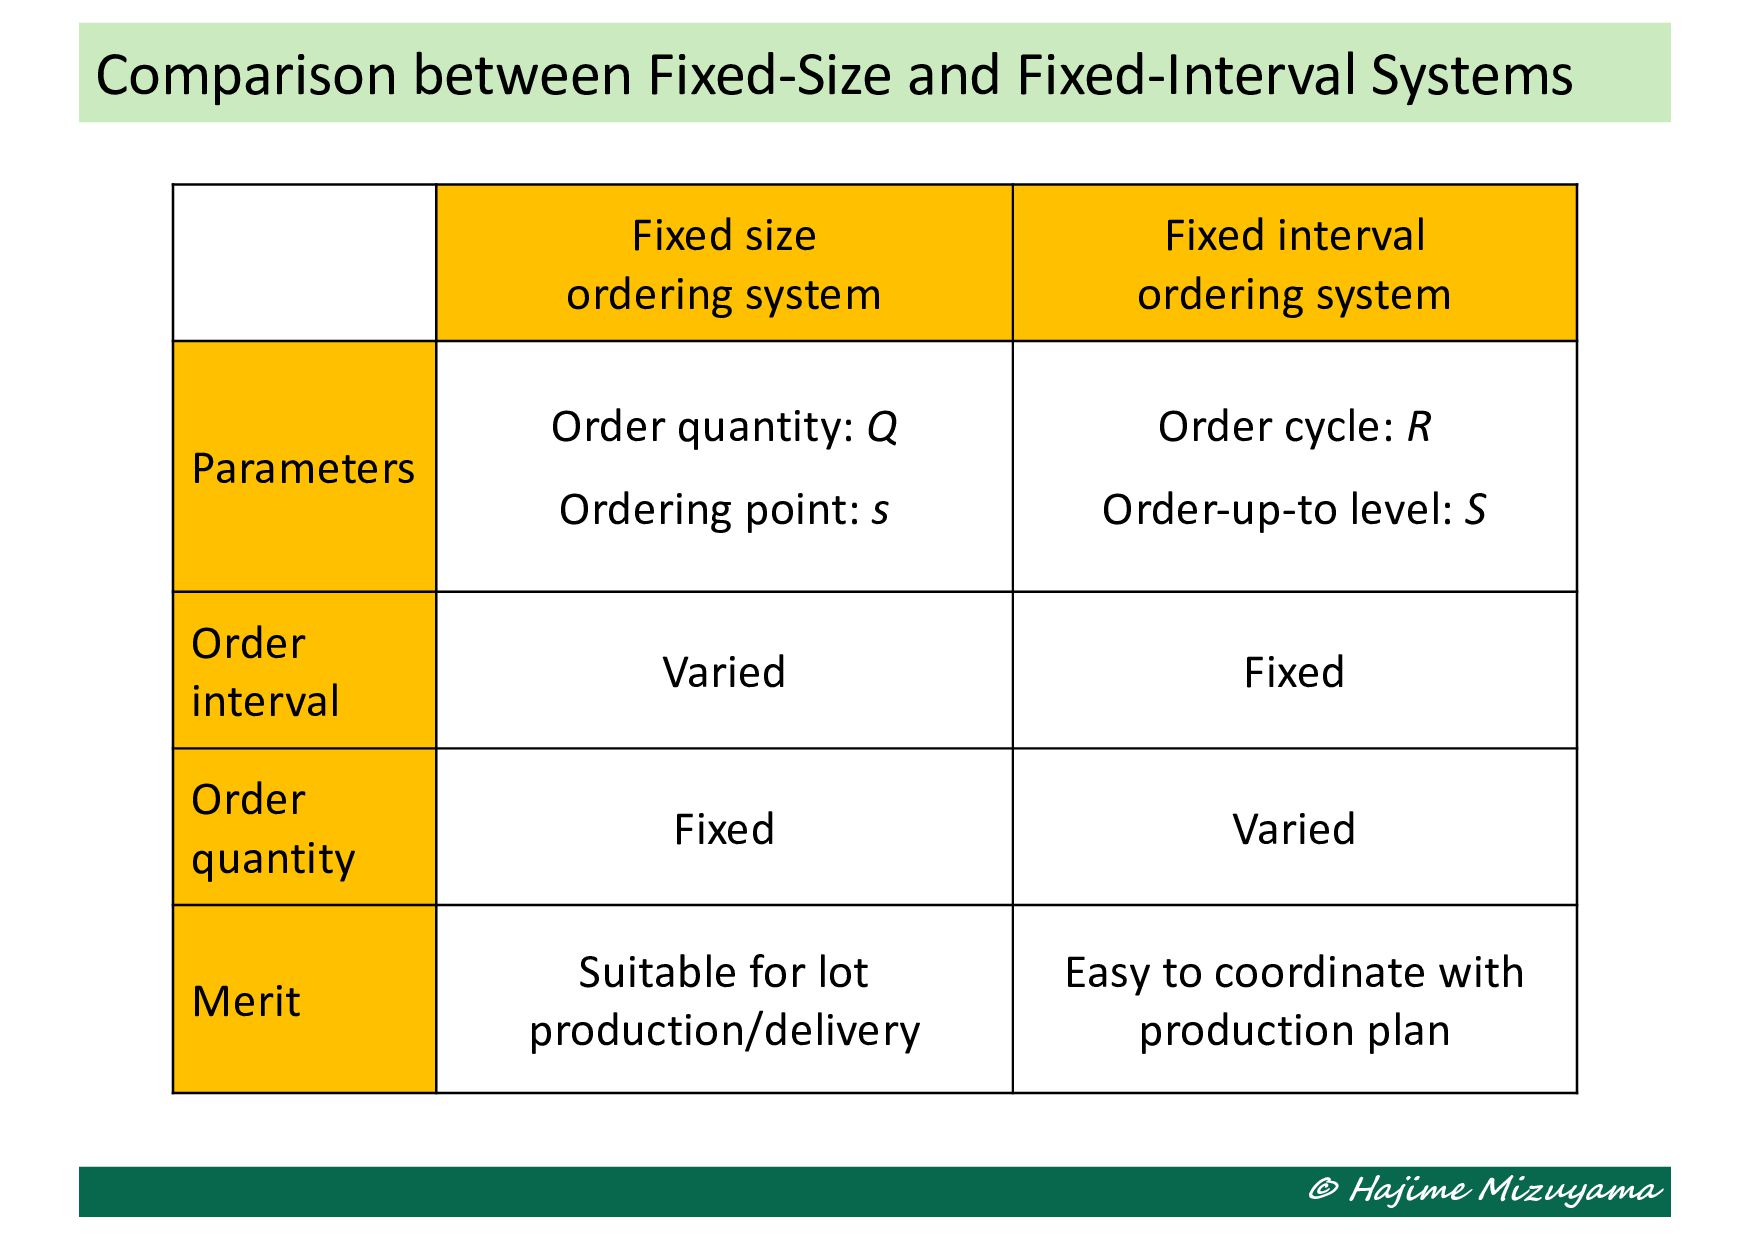
system Parameters Order quantity: Q Ordering point: s Order cycle: R Order-up-to level: S Order interval Varied Fixed Order quantity Fixed Varied Merit Suitable for lot production/delivery Easy to coordinate with production plan Comparison between Fixed-Size and Fixed-Interval Systems