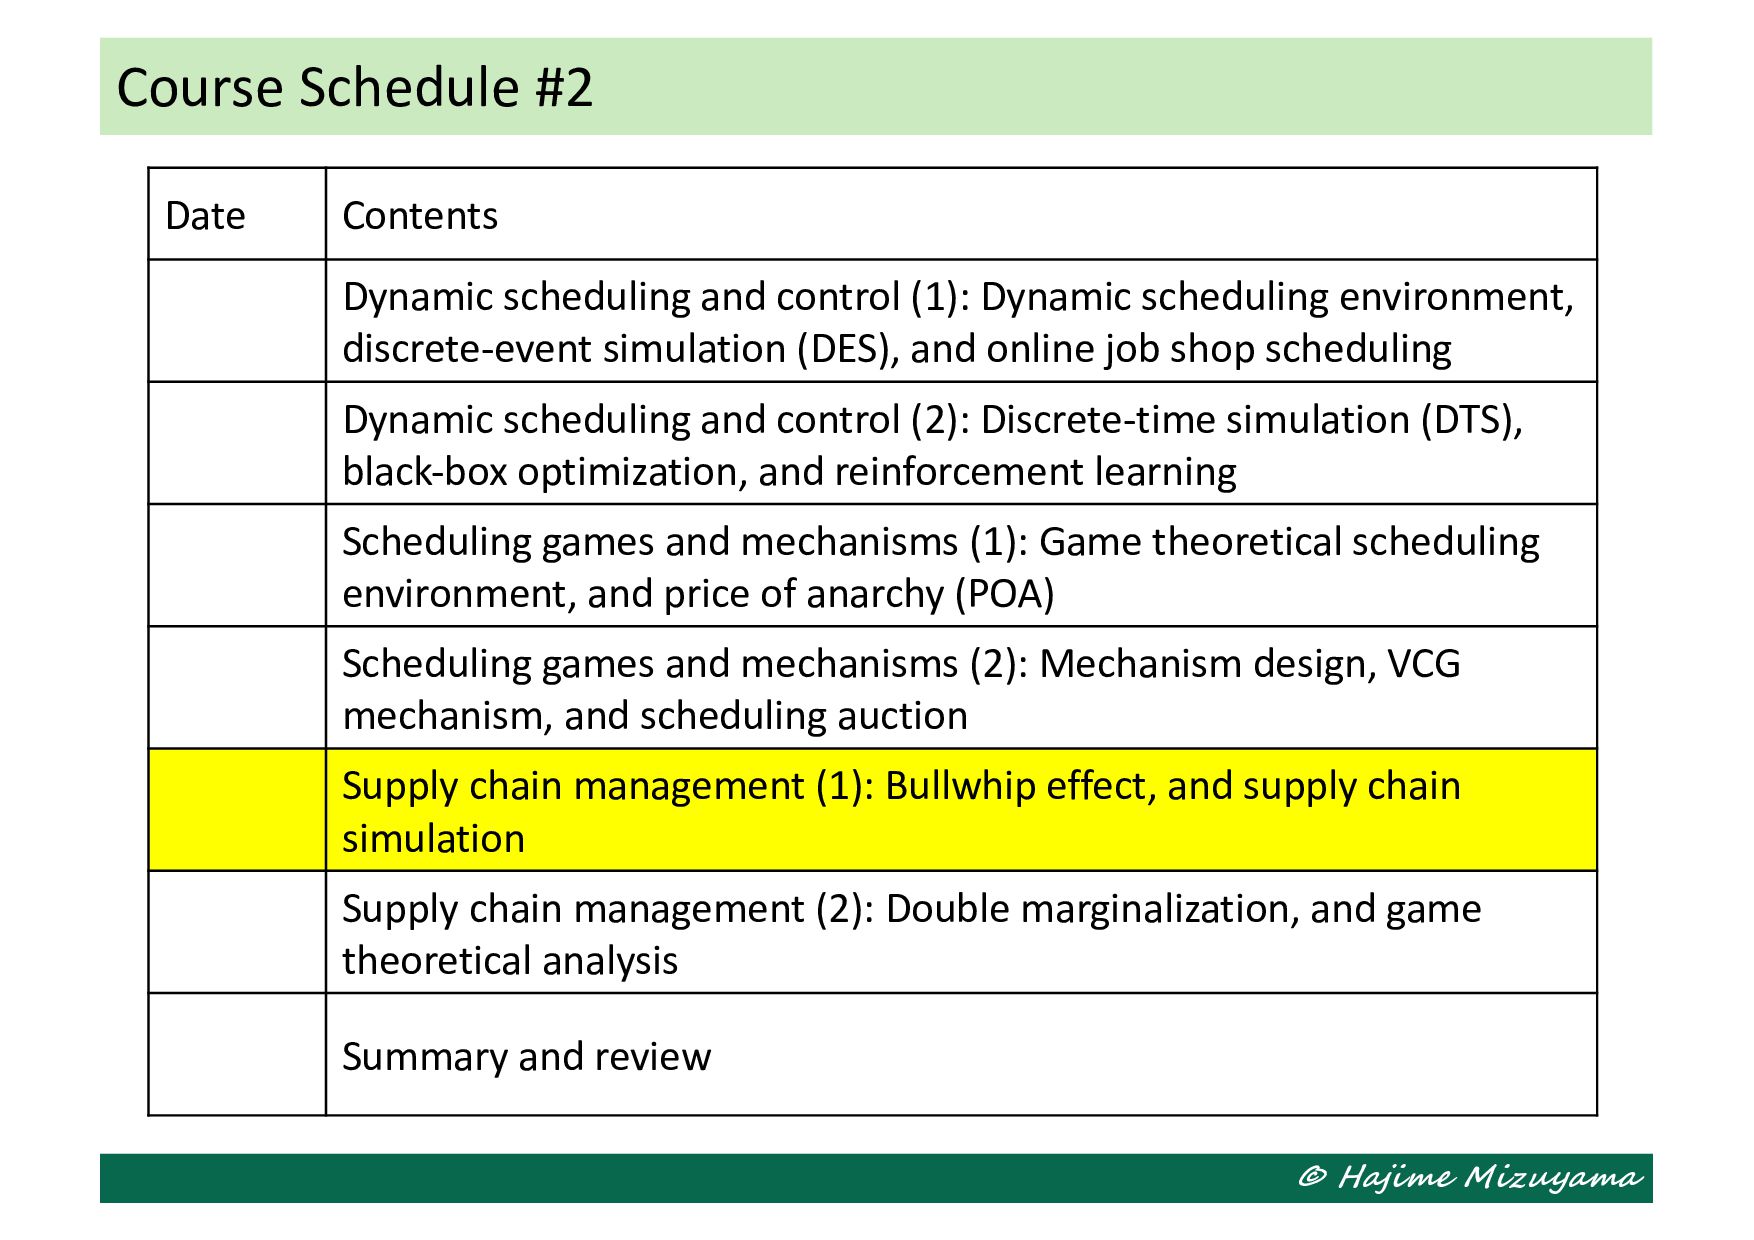
and control (1): Dynamic scheduling environment, discrete-event simulation (DES), and online job shop scheduling Dynamic scheduling and control (2): Discrete-time simulation (DTS), black-box optimization, and reinforcement learning Scheduling games and mechanisms (1): Game theoretical scheduling environment, and price of anarchy (POA) Scheduling games and mechanisms (2): Mechanism design, VCG mechanism, and scheduling auction Supply chain management (1): Bullwhip effect, and supply chain simulation Supply chain management (2): Double marginalization, and game theoretical analysis Summary and review
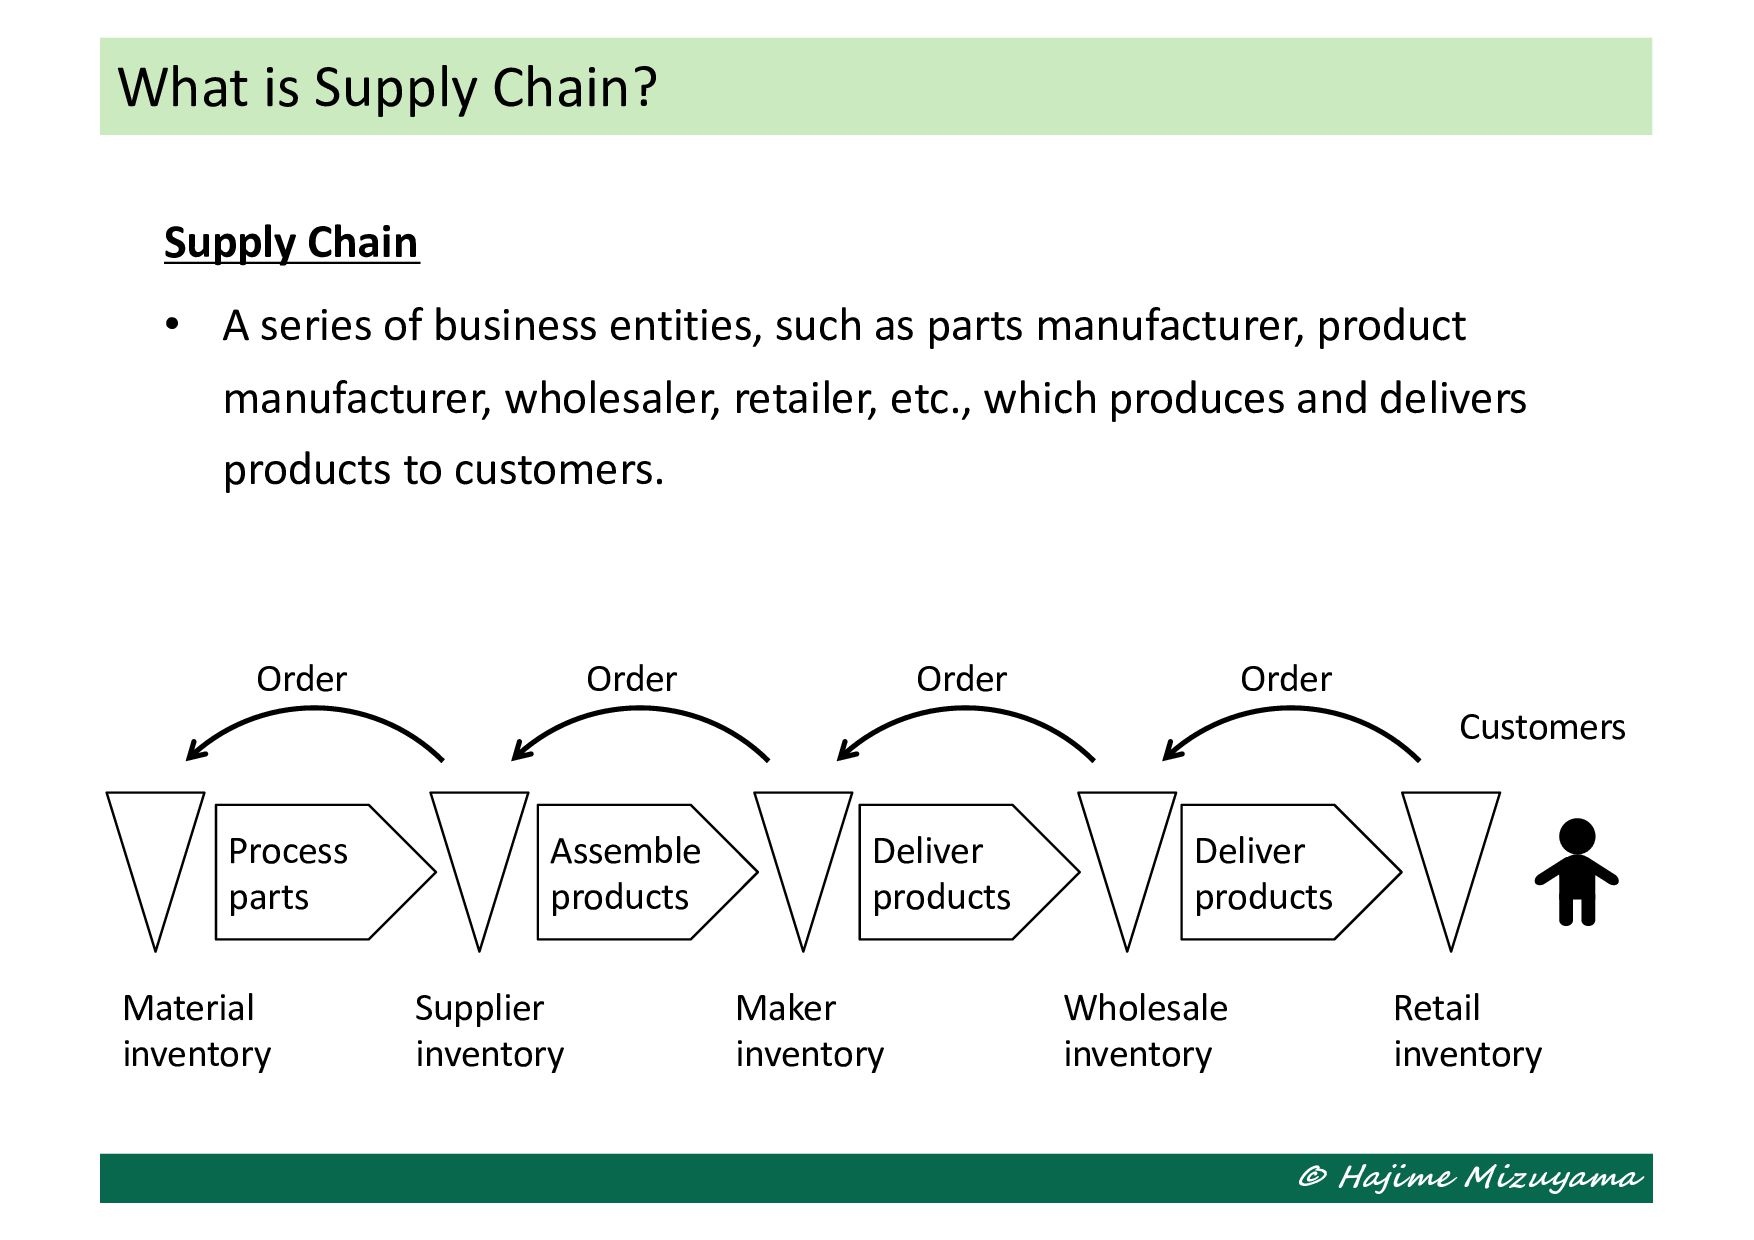
entities, such as parts manufacturer, product manufacturer, wholesaler, retailer, etc., which produces and delivers products to customers. What is Supply Chain? Process parts Assemble products Deliver products Deliver products Retail inventory Wholesale inventory Maker inventory Supplier inventory Material inventory Customers Order Order Order Order
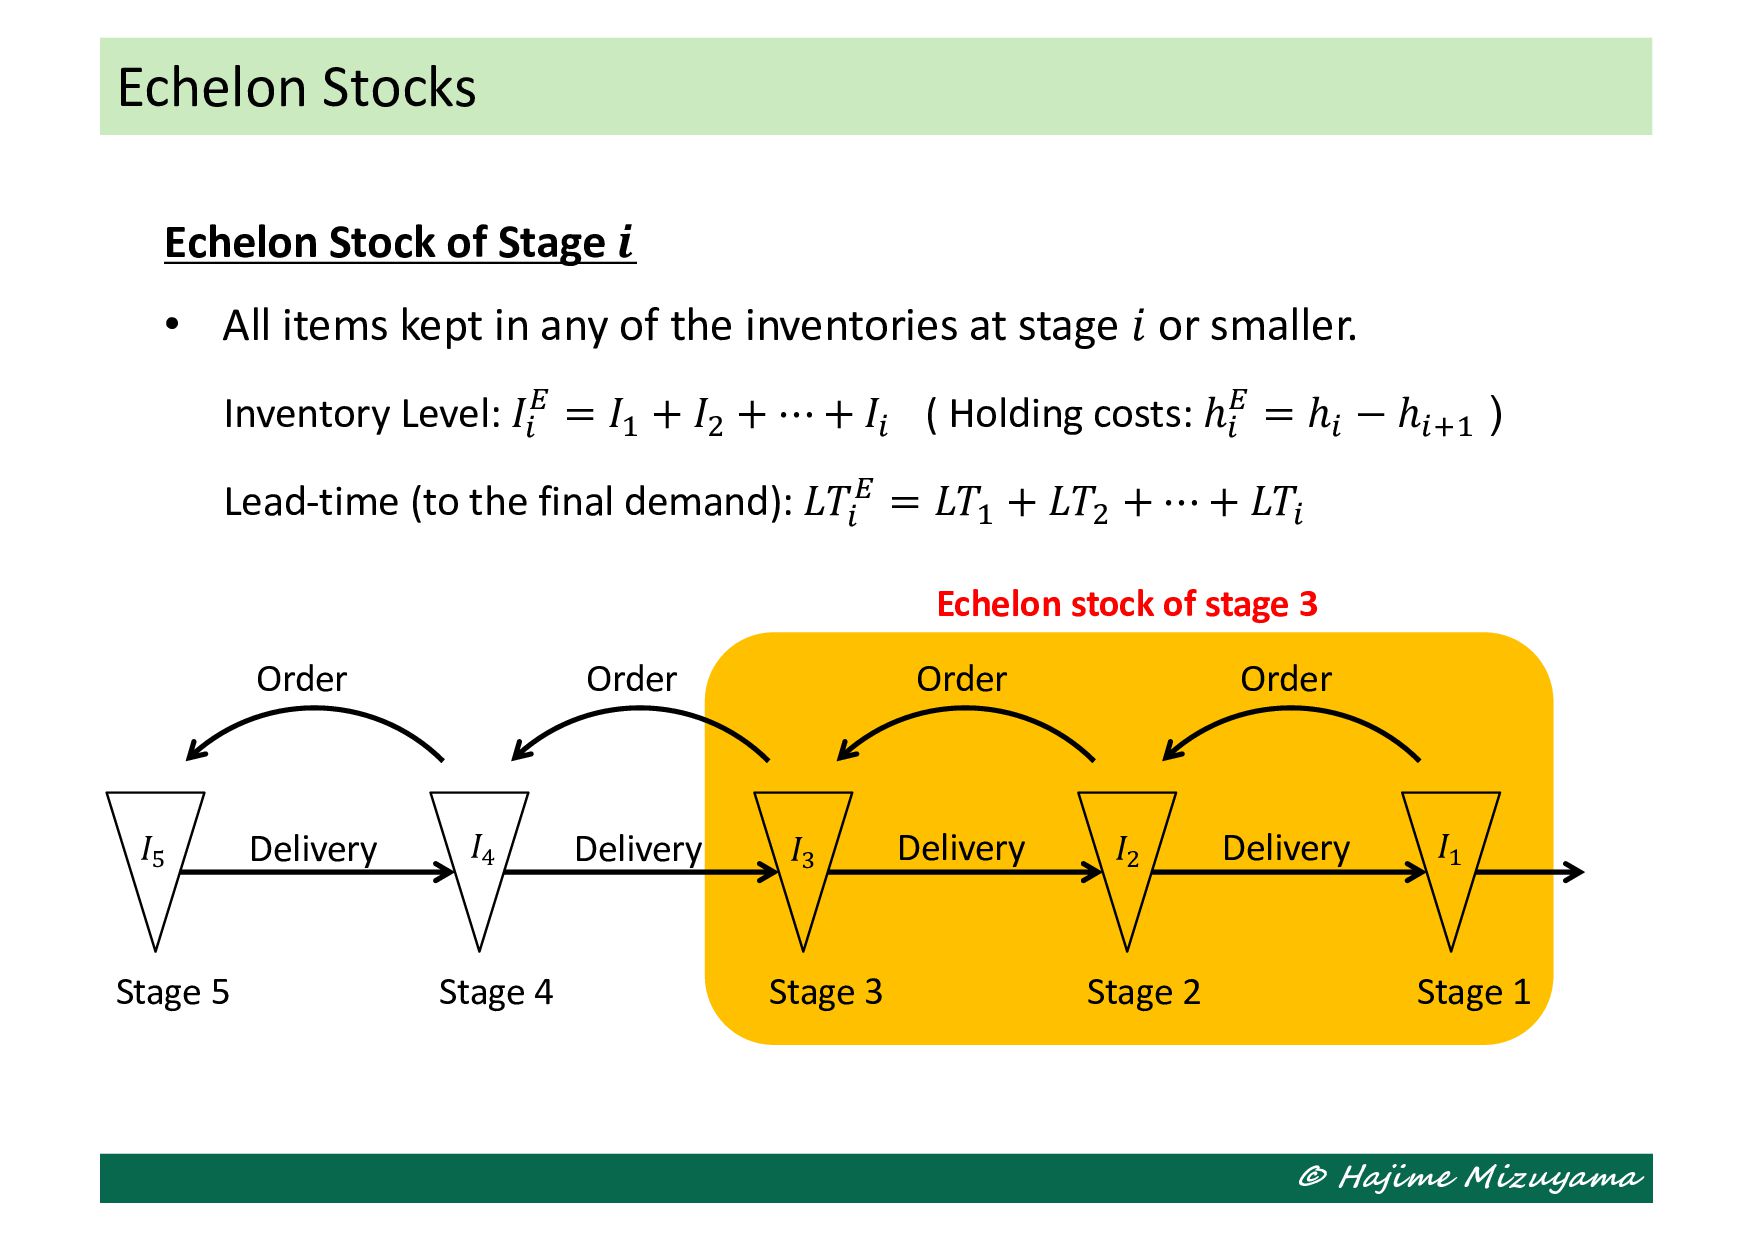
entities, such as parts manufacturer, product manufacturer, wholesaler, retailer, etc., which produces and delivers products to customers. • It is often conceptualized as a network of inventories. How to Conceptualize Supply Chain? Stage 1 Order Order Order Order Delivery Delivery Delivery Delivery Stage 2 Stage 3 Stage 4 Stage 5 𝐼! 𝐼" 𝐼# 𝐼$ 𝐼%
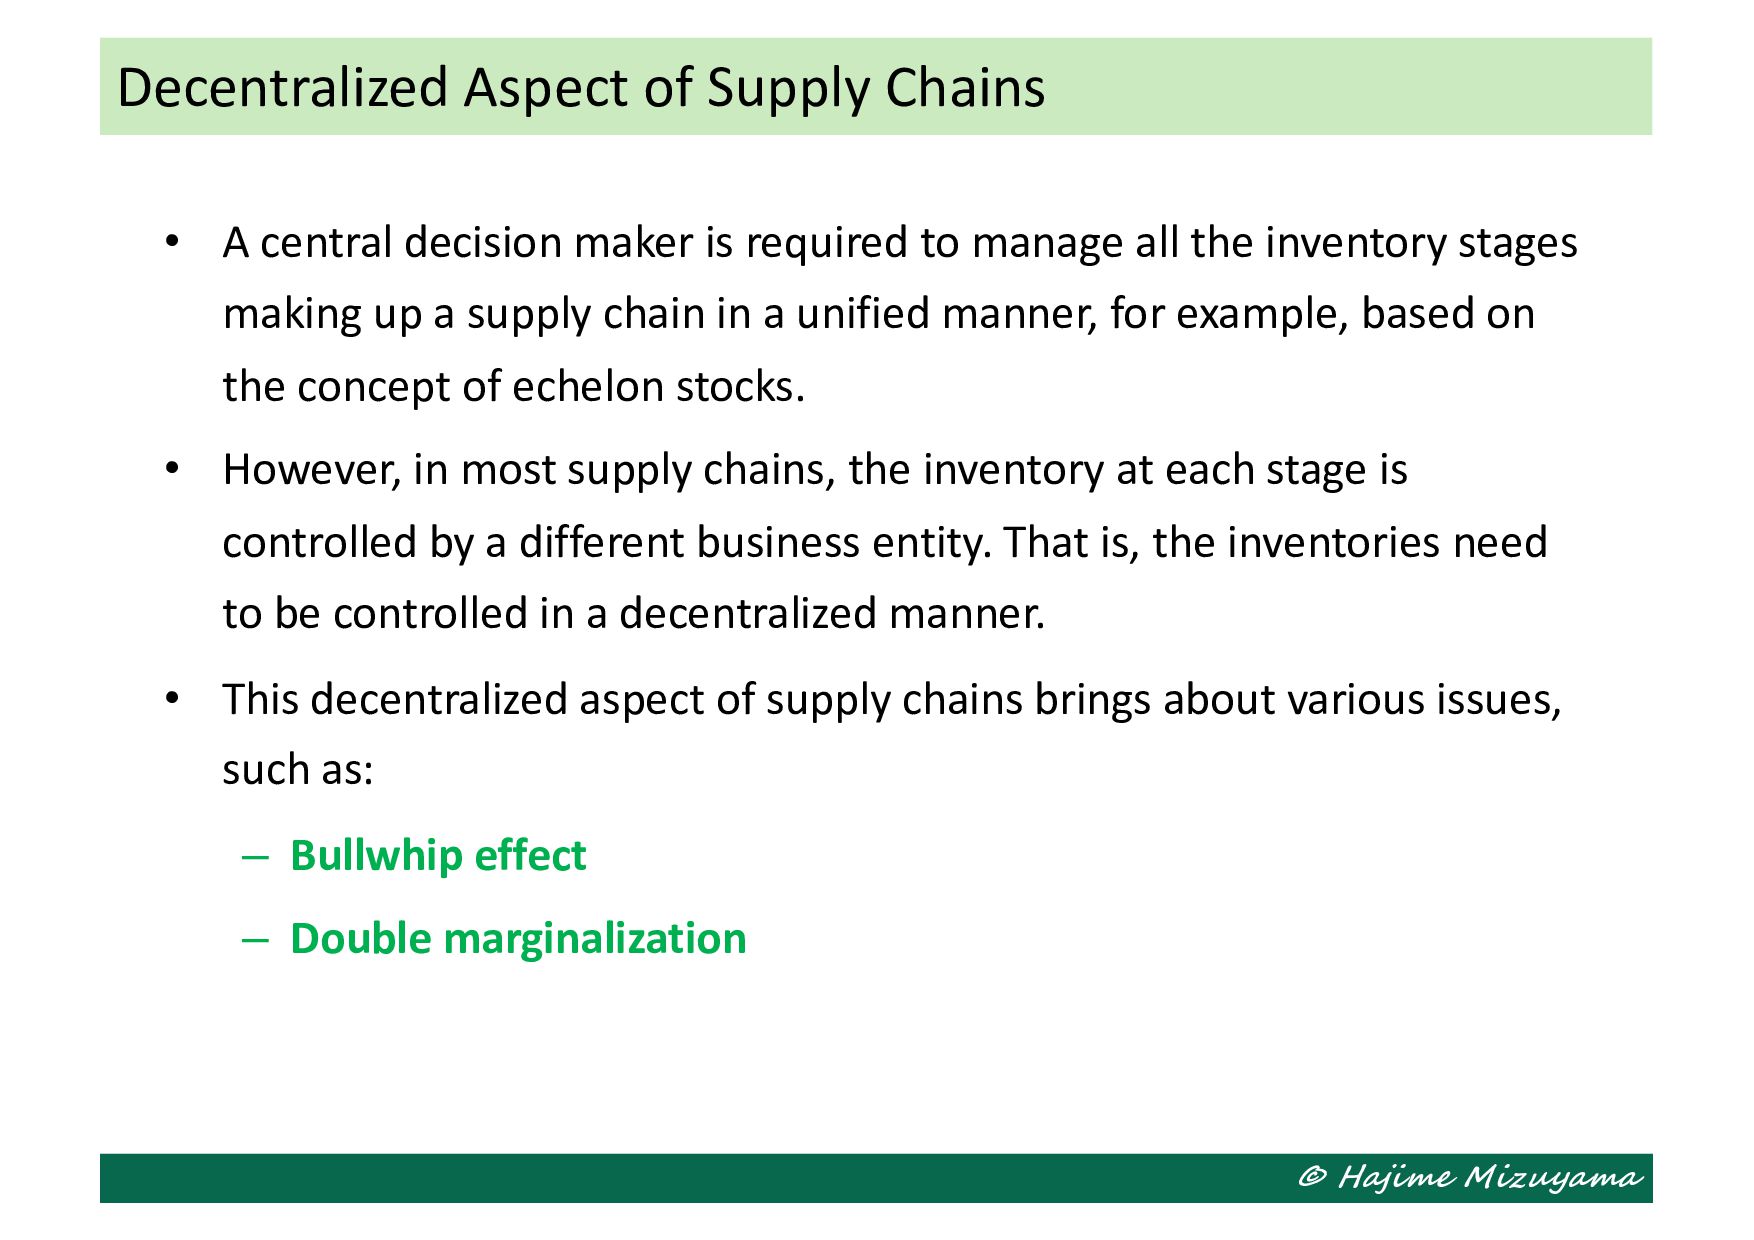
to manage all the inventory stages making up a supply chain in a unified manner, for example, based on the concept of echelon stocks. • However, in most supply chains, the inventory at each stage is controlled by a different business entity. That is, the inventories need to be controlled in a decentralized manner. • This decentralized aspect of supply chains brings about various issues, such as: – Bullwhip effect – Double marginalization Decentralized Aspect of Supply Chains
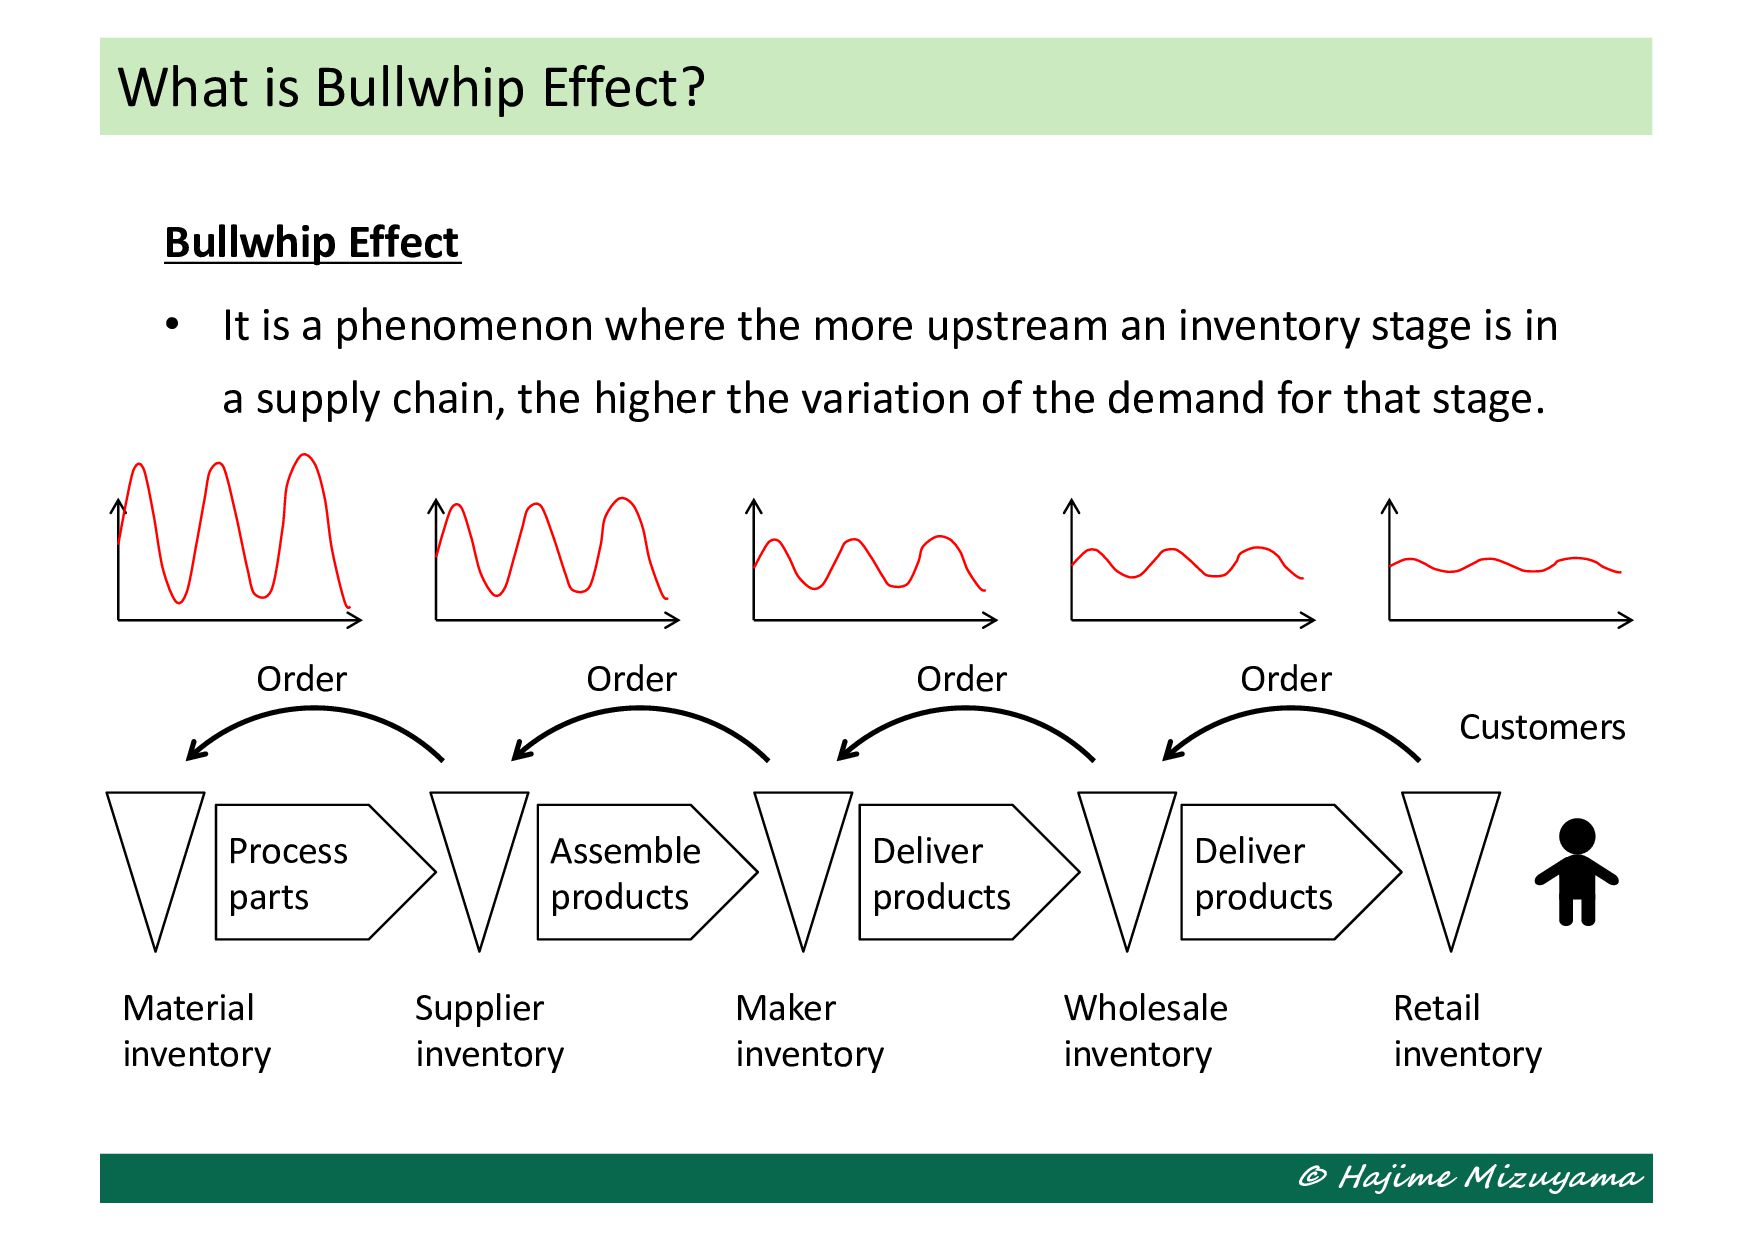
where the more upstream an inventory stage is in a supply chain, the higher the variation of the demand for that stage. What is Bullwhip Effect? Process parts Assemble products Deliver products Deliver products Retail inventory Wholesale inventory Maker inventory Supplier inventory Material inventory Customers Order Order Order Order
sensitive to small fluctuation of the demand. • The fluctuation is amplified over the lead-time, when calculating the order quantity. • Order batching, or other lot sizing policy, may translate a large order quantity even larger and a small one even smaller. • Volume discount, or other sales promotion measures, may lead to ordering more items than necessary. • Behavioral and human factors, such as panic ordering after shortage, risk-averse attitude, etc. Potential Causes of Bullwhip Effect
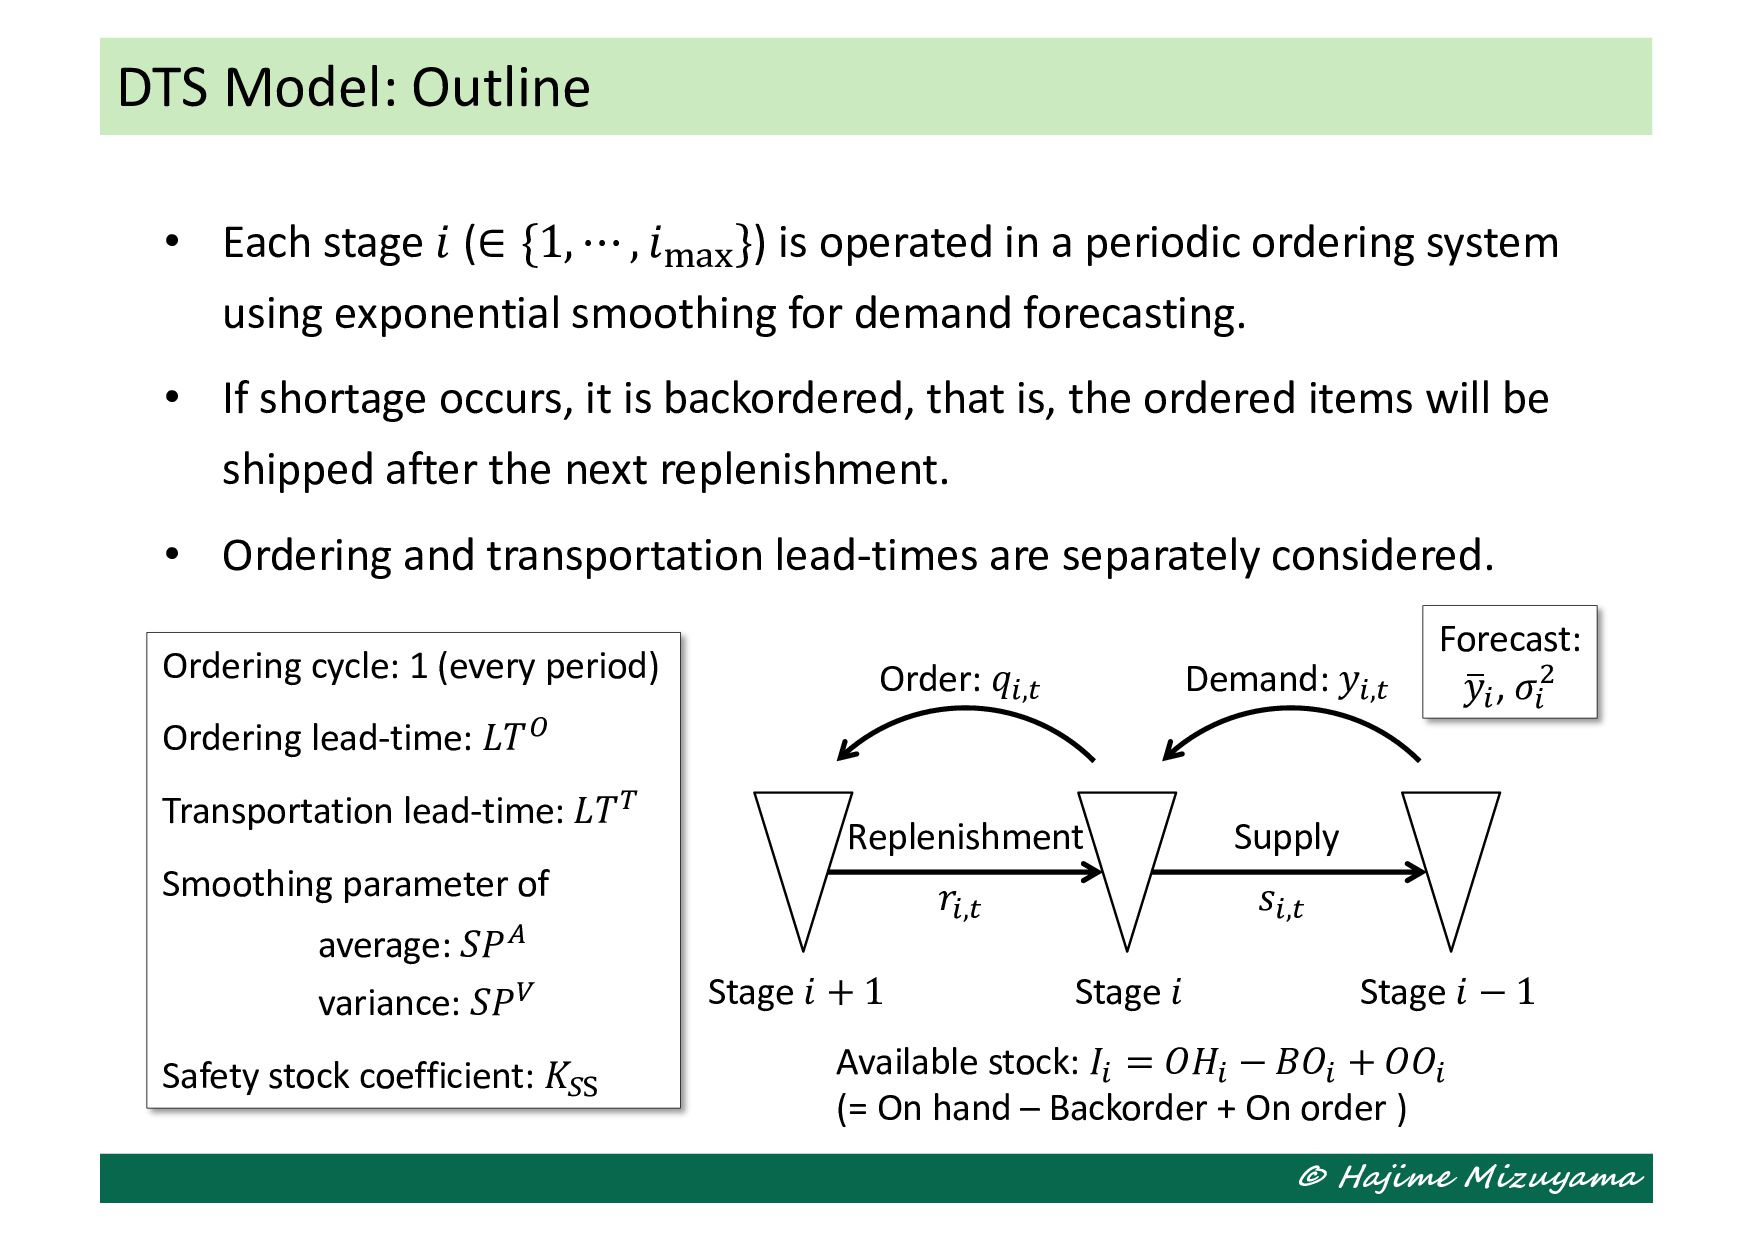
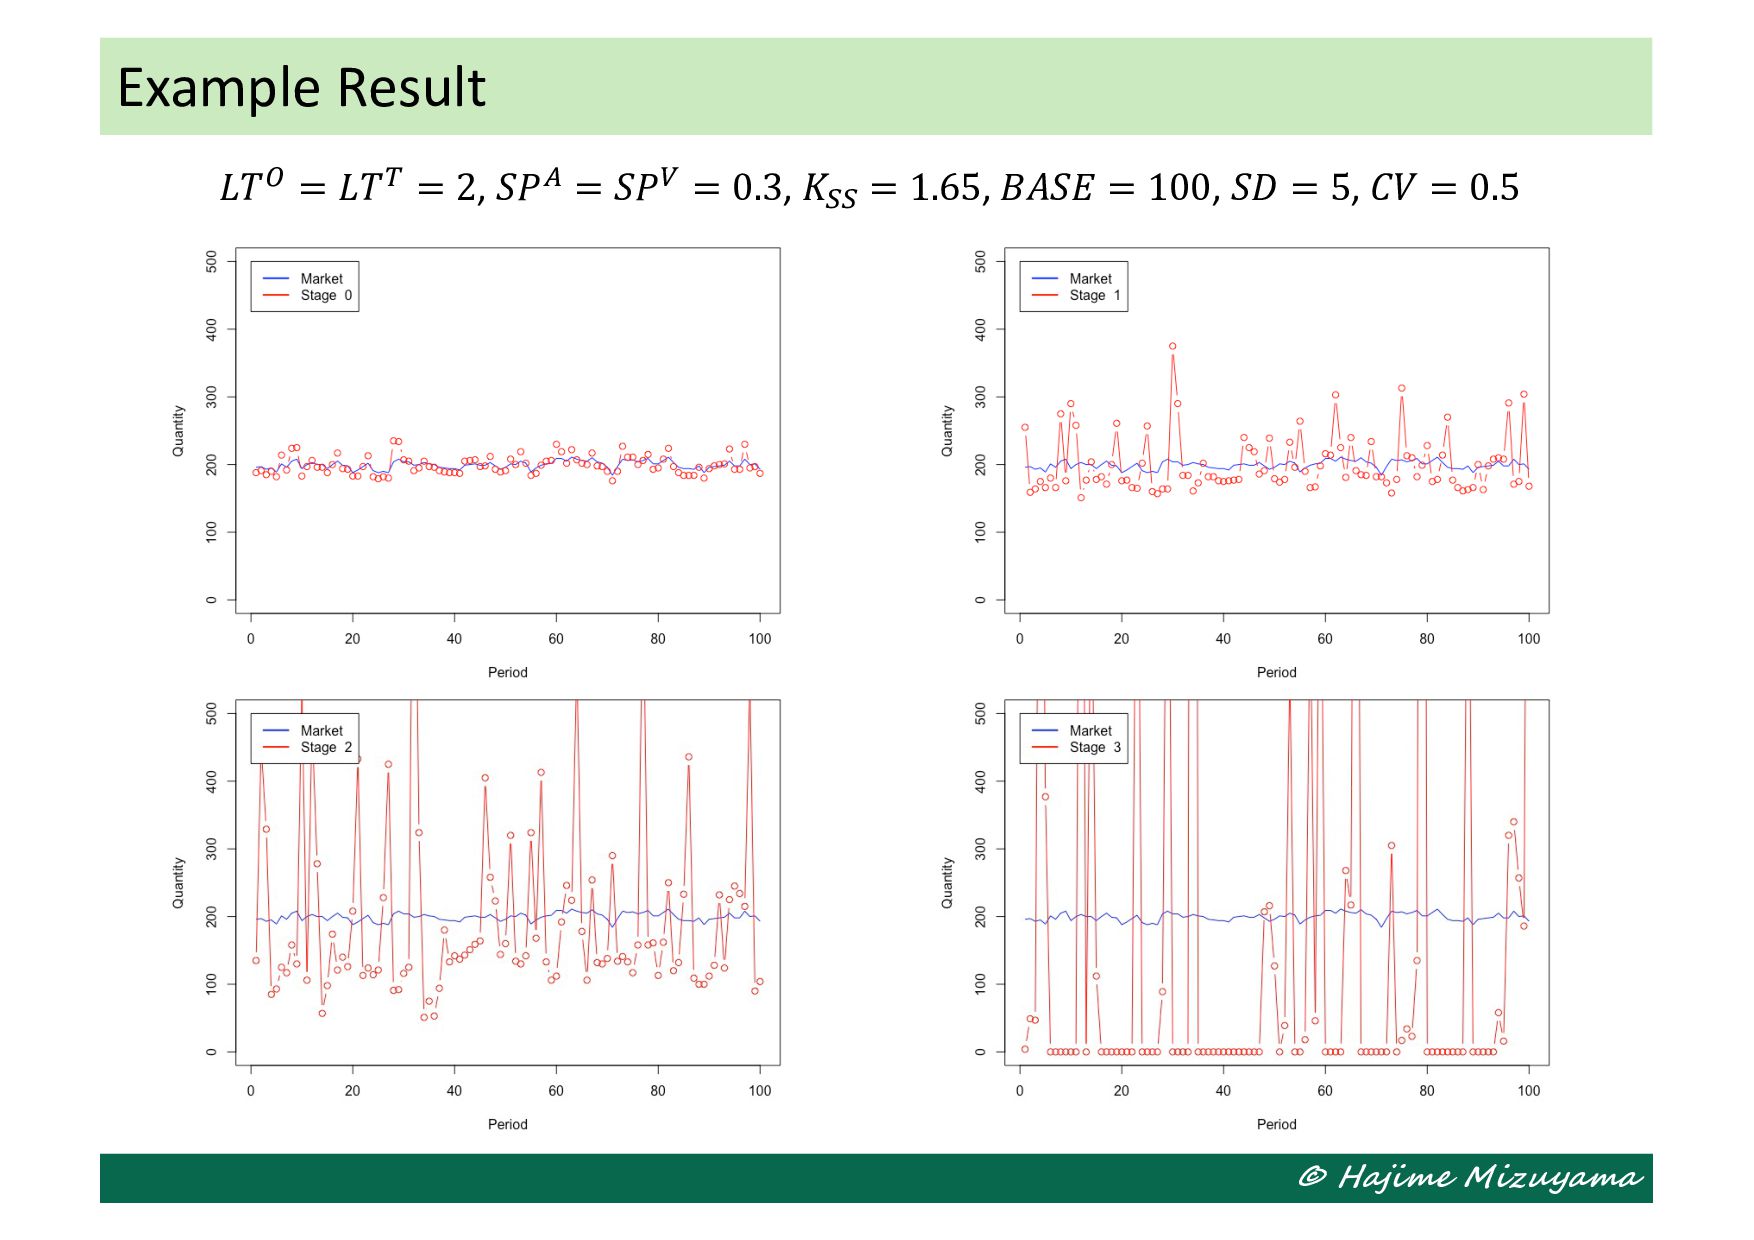
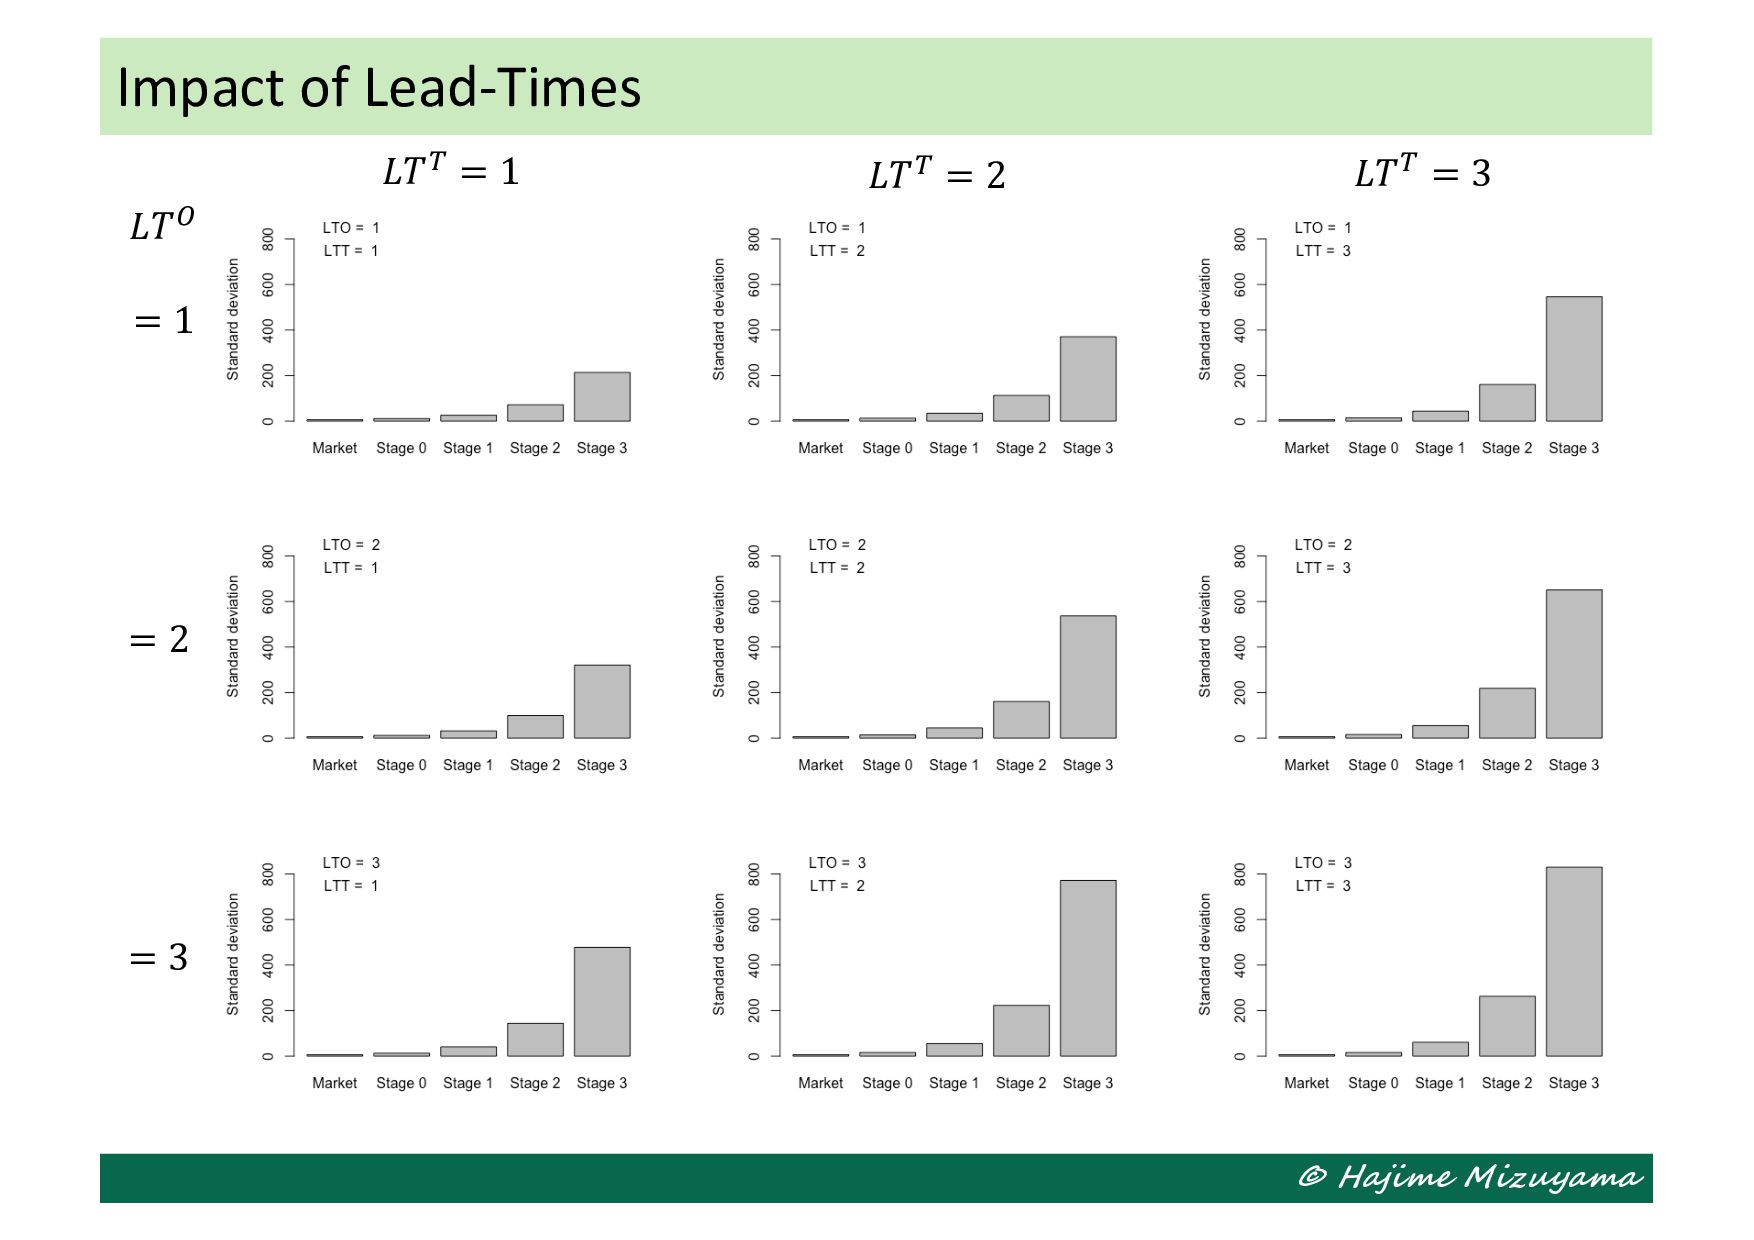
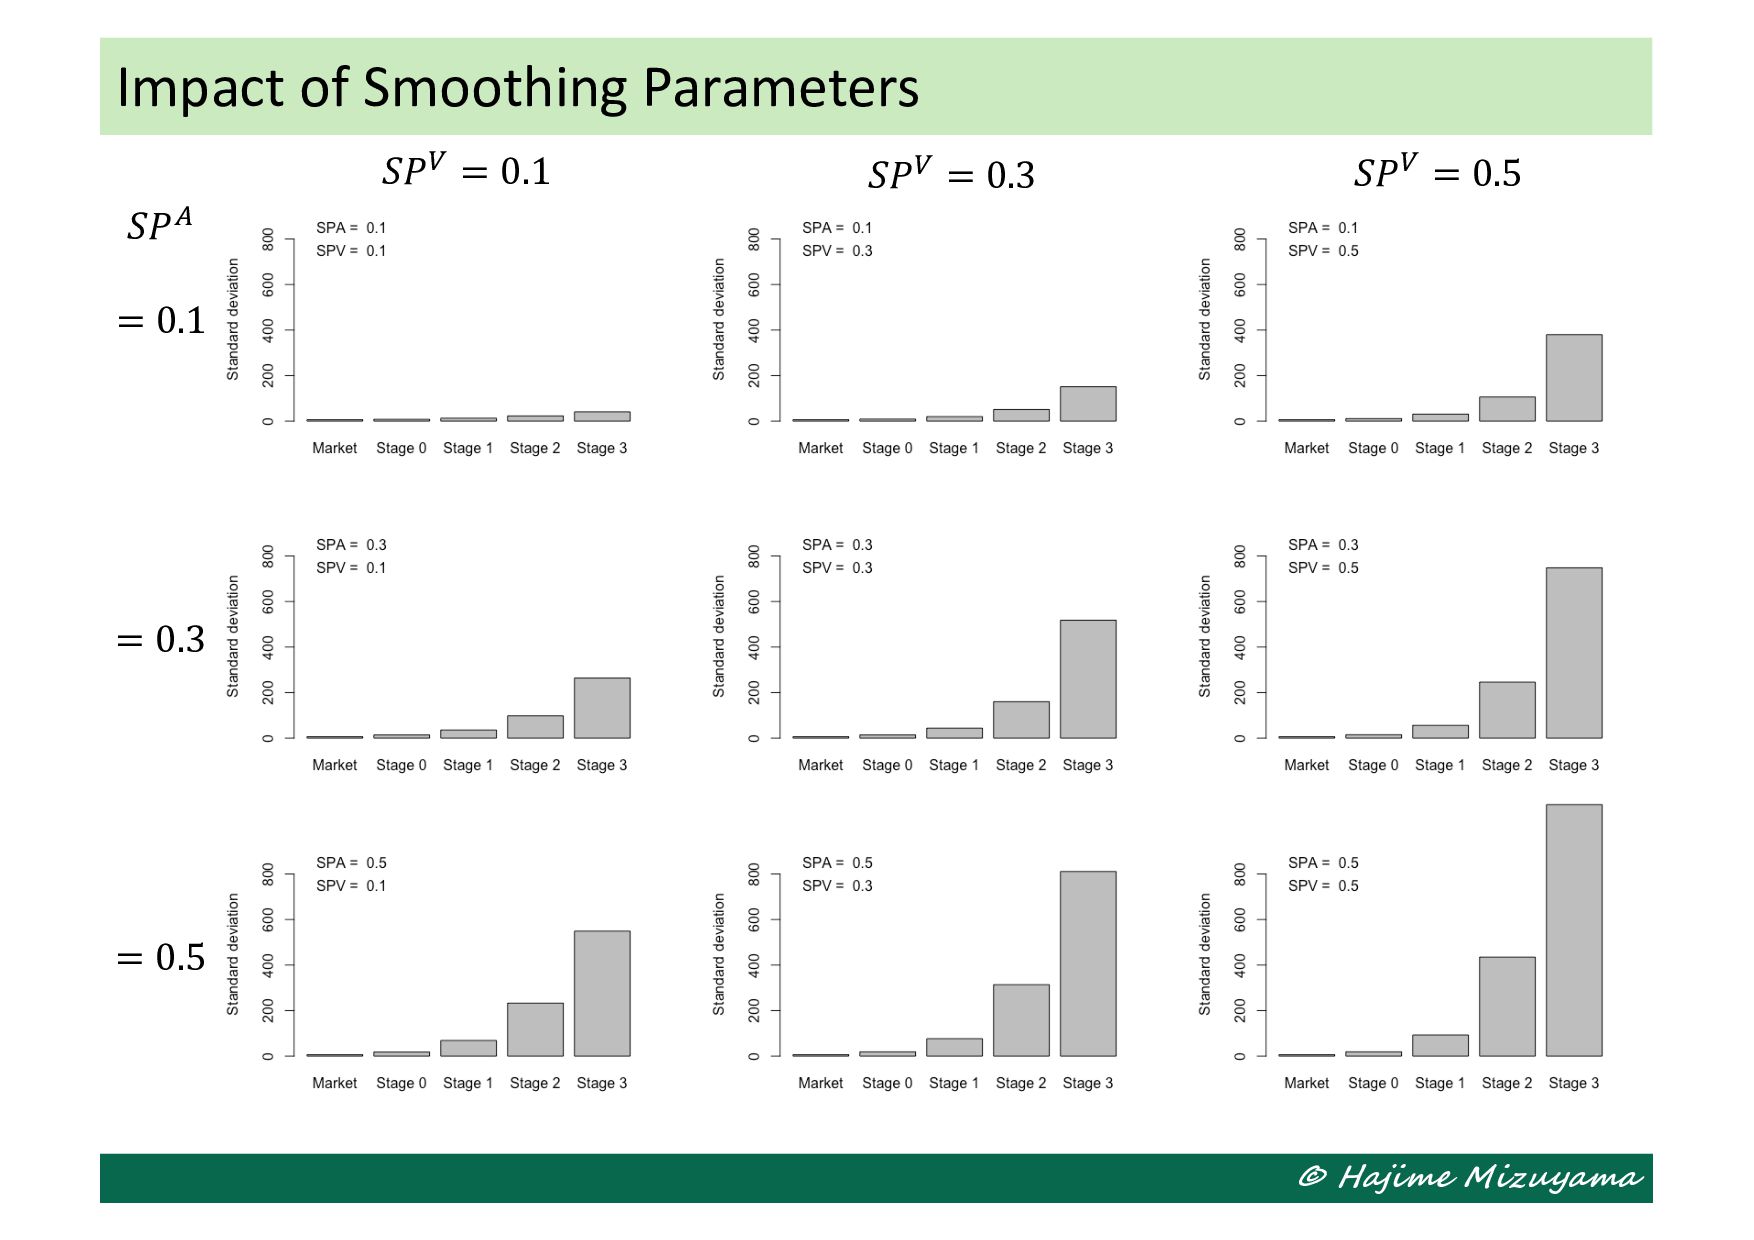
(∈ {1, ⋯ , 𝑖"#$ }) is operated in a periodic ordering system using exponential smoothing for demand forecasting. • If shortage occurs, it is backordered, that is, the ordered items will be shipped after the next replenishment. • Ordering and transportation lead-times are separately considered. Stage 𝑖 − 1 Demand: 𝑦!,# Order: 𝑞!,# Supply Replenishment Stage 𝑖 Stage 𝑖 + 1 Ordering cycle: 1 (every period) Ordering lead-time: 𝐿𝑇$ Transportation lead-time: 𝐿𝑇% Smoothing parameter of average: 𝑆𝑃& variance: 𝑆𝑃' Safety stock coefficient: 𝐾() 𝑠!,# 𝑟!,# Forecast: . 𝑦!, 𝜎! * Available stock: 𝐼! = 𝑂𝐻! − 𝐵𝑂! + 𝑂𝑂! (= On hand – Backorder + On order )
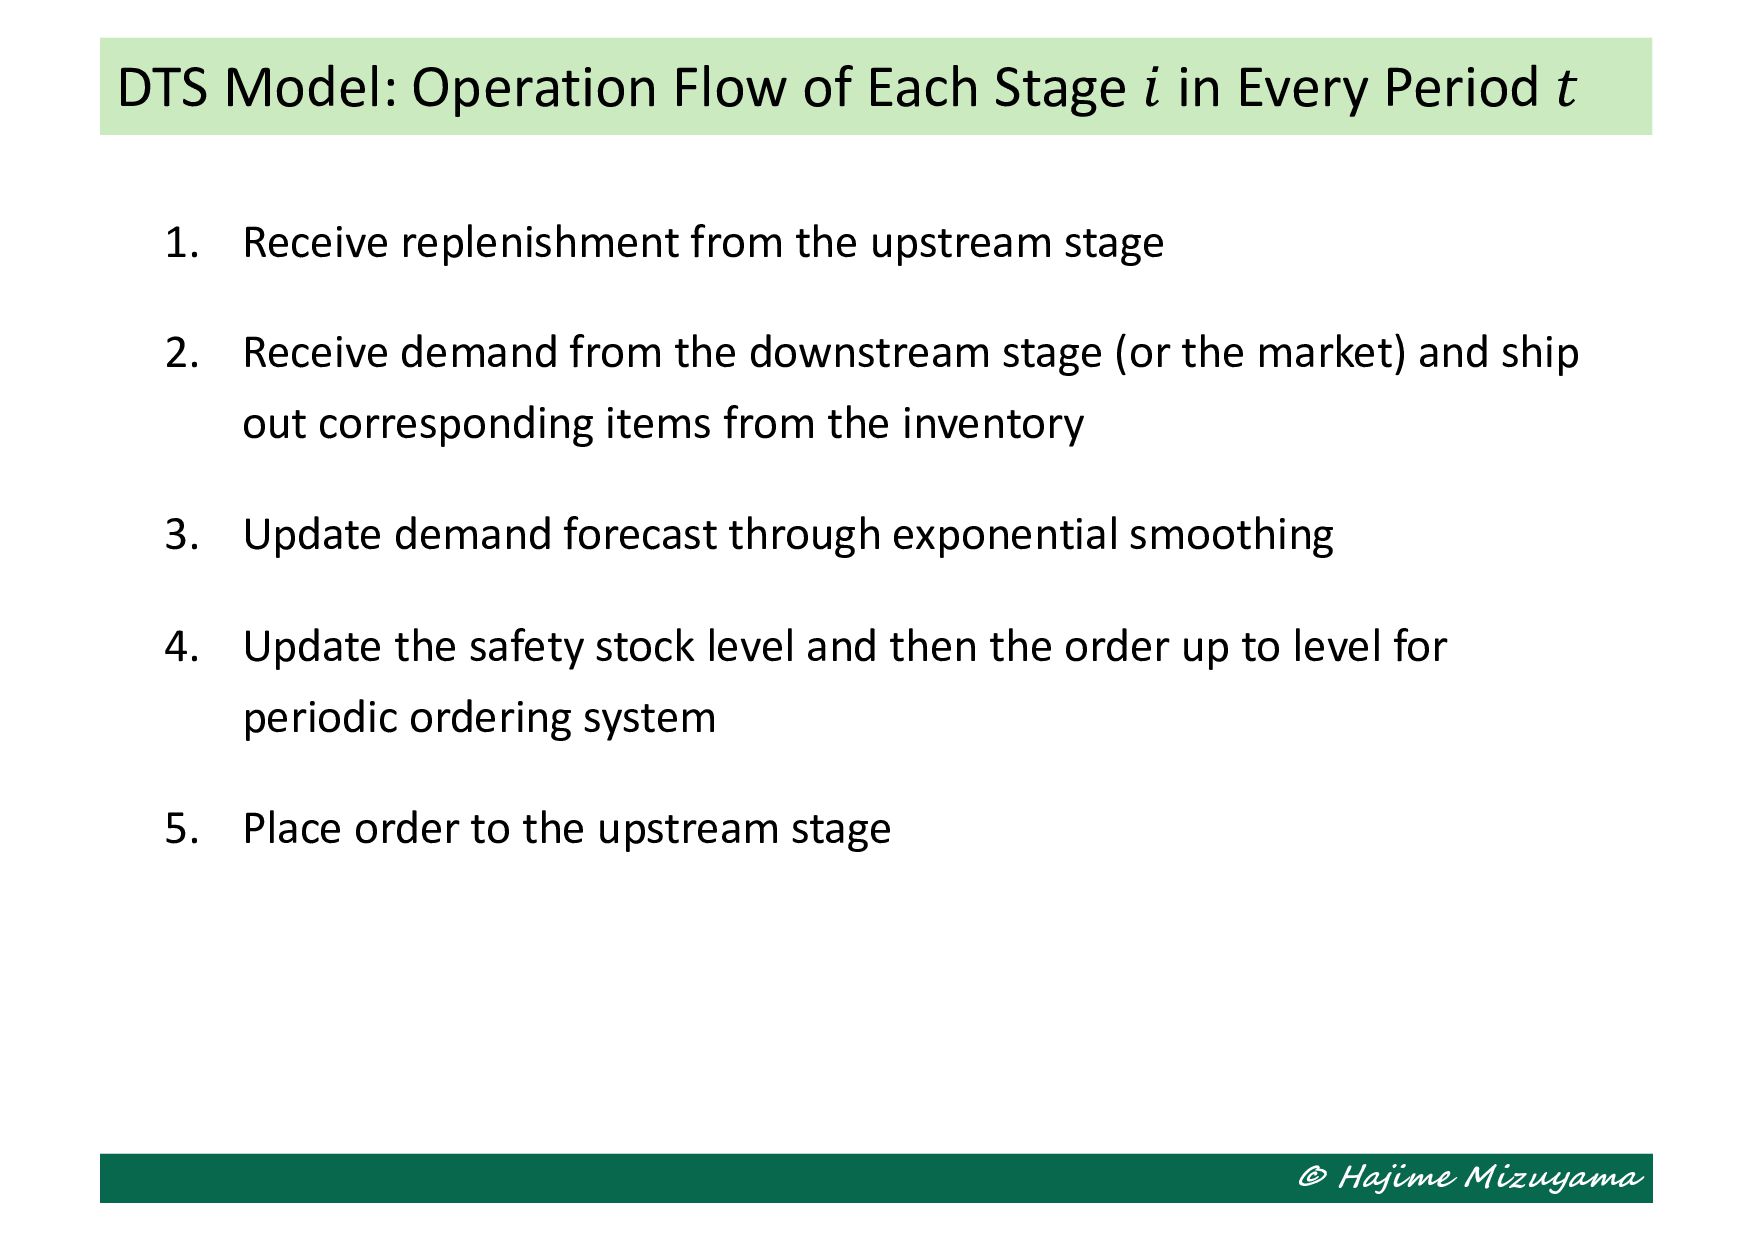
2. Receive demand from the downstream stage (or the market) and ship out corresponding items from the inventory 3. Update demand forecast through exponential smoothing 4. Update the safety stock level and then the order up to level for periodic ordering system 5. Place order to the upstream stage DTS Model: Operation Flow of Each Stage 𝑖 in Every Period 𝑡
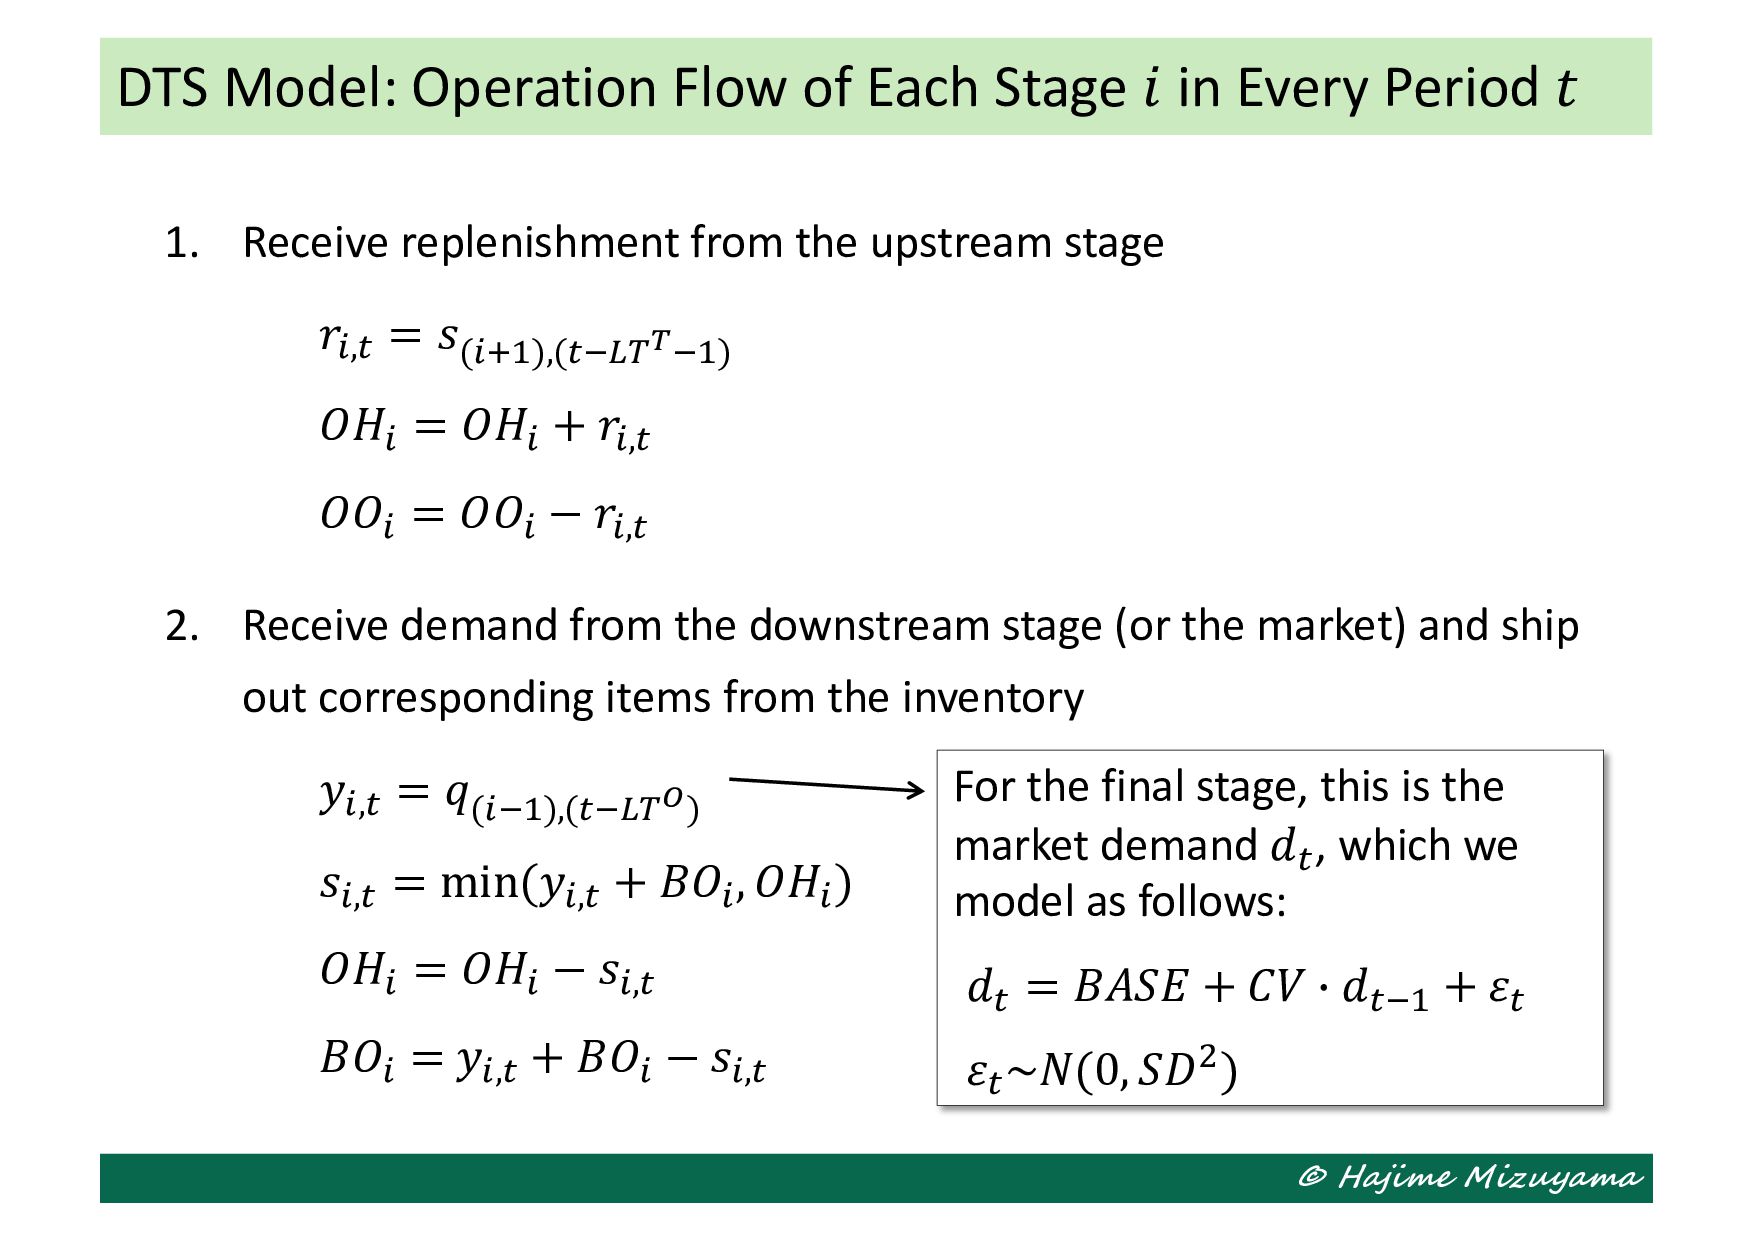
𝑟%,' = 𝑠(%)*),(',-.+,*) 𝑂𝐻% = 𝑂𝐻% + 𝑟%,' 𝑂𝑂% = 𝑂𝑂% − 𝑟%,' 2. Receive demand from the downstream stage (or the market) and ship out corresponding items from the inventory 𝑦%,' = 𝑞(%,*),(',-.,) 𝑠%,' = min(𝑦%,' + 𝐵𝑂% , 𝑂𝐻% ) 𝑂𝐻% = 𝑂𝐻% − 𝑠%,' 𝐵𝑂% = 𝑦%,' + 𝐵𝑂% − 𝑠%,' DTS Model: Operation Flow of Each Stage 𝑖 in Every Period 𝑡 For the final stage, this is the market demand 𝑑', which we model as follows: 𝑑' = 𝐵𝐴𝑆𝐸 + 𝐶𝑉 > 𝑑',* + 𝜀' 𝜀' ~𝑁(0, 𝑆𝐷/)
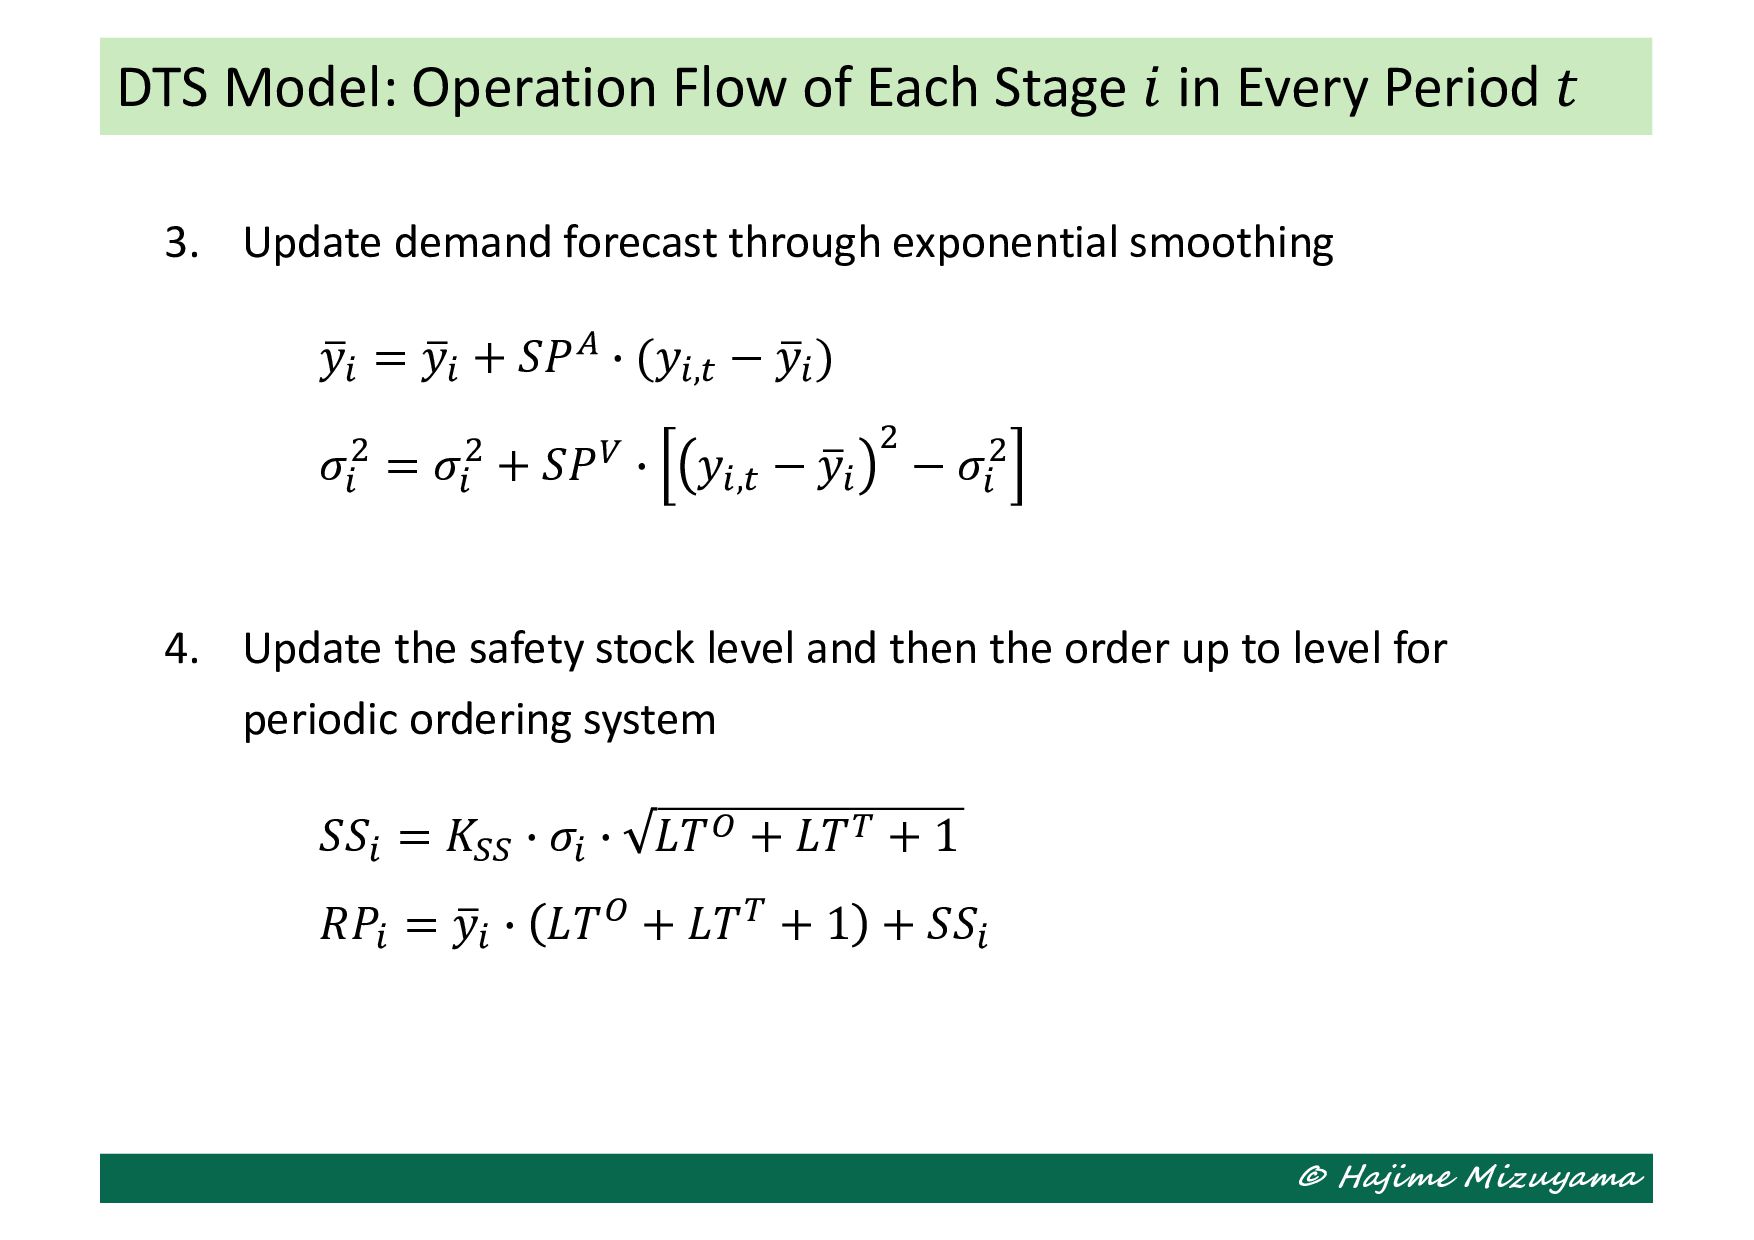
D 𝑦% = D 𝑦% + 𝑆𝑃0 > (𝑦%,' − D 𝑦% ) 𝜎% / = 𝜎% / + 𝑆𝑃1 > 𝑦%,' − D 𝑦% / − 𝜎% / 4. Update the safety stock level and then the order up to level for periodic ordering system 𝑆𝑆% = 𝐾22 > 𝜎% > 𝐿𝑇3 + 𝐿𝑇. + 1 𝑅𝑃% = D 𝑦% > 𝐿𝑇3 + 𝐿𝑇. + 1 + 𝑆𝑆% DTS Model: Operation Flow of Each Stage 𝑖 in Every Period 𝑡
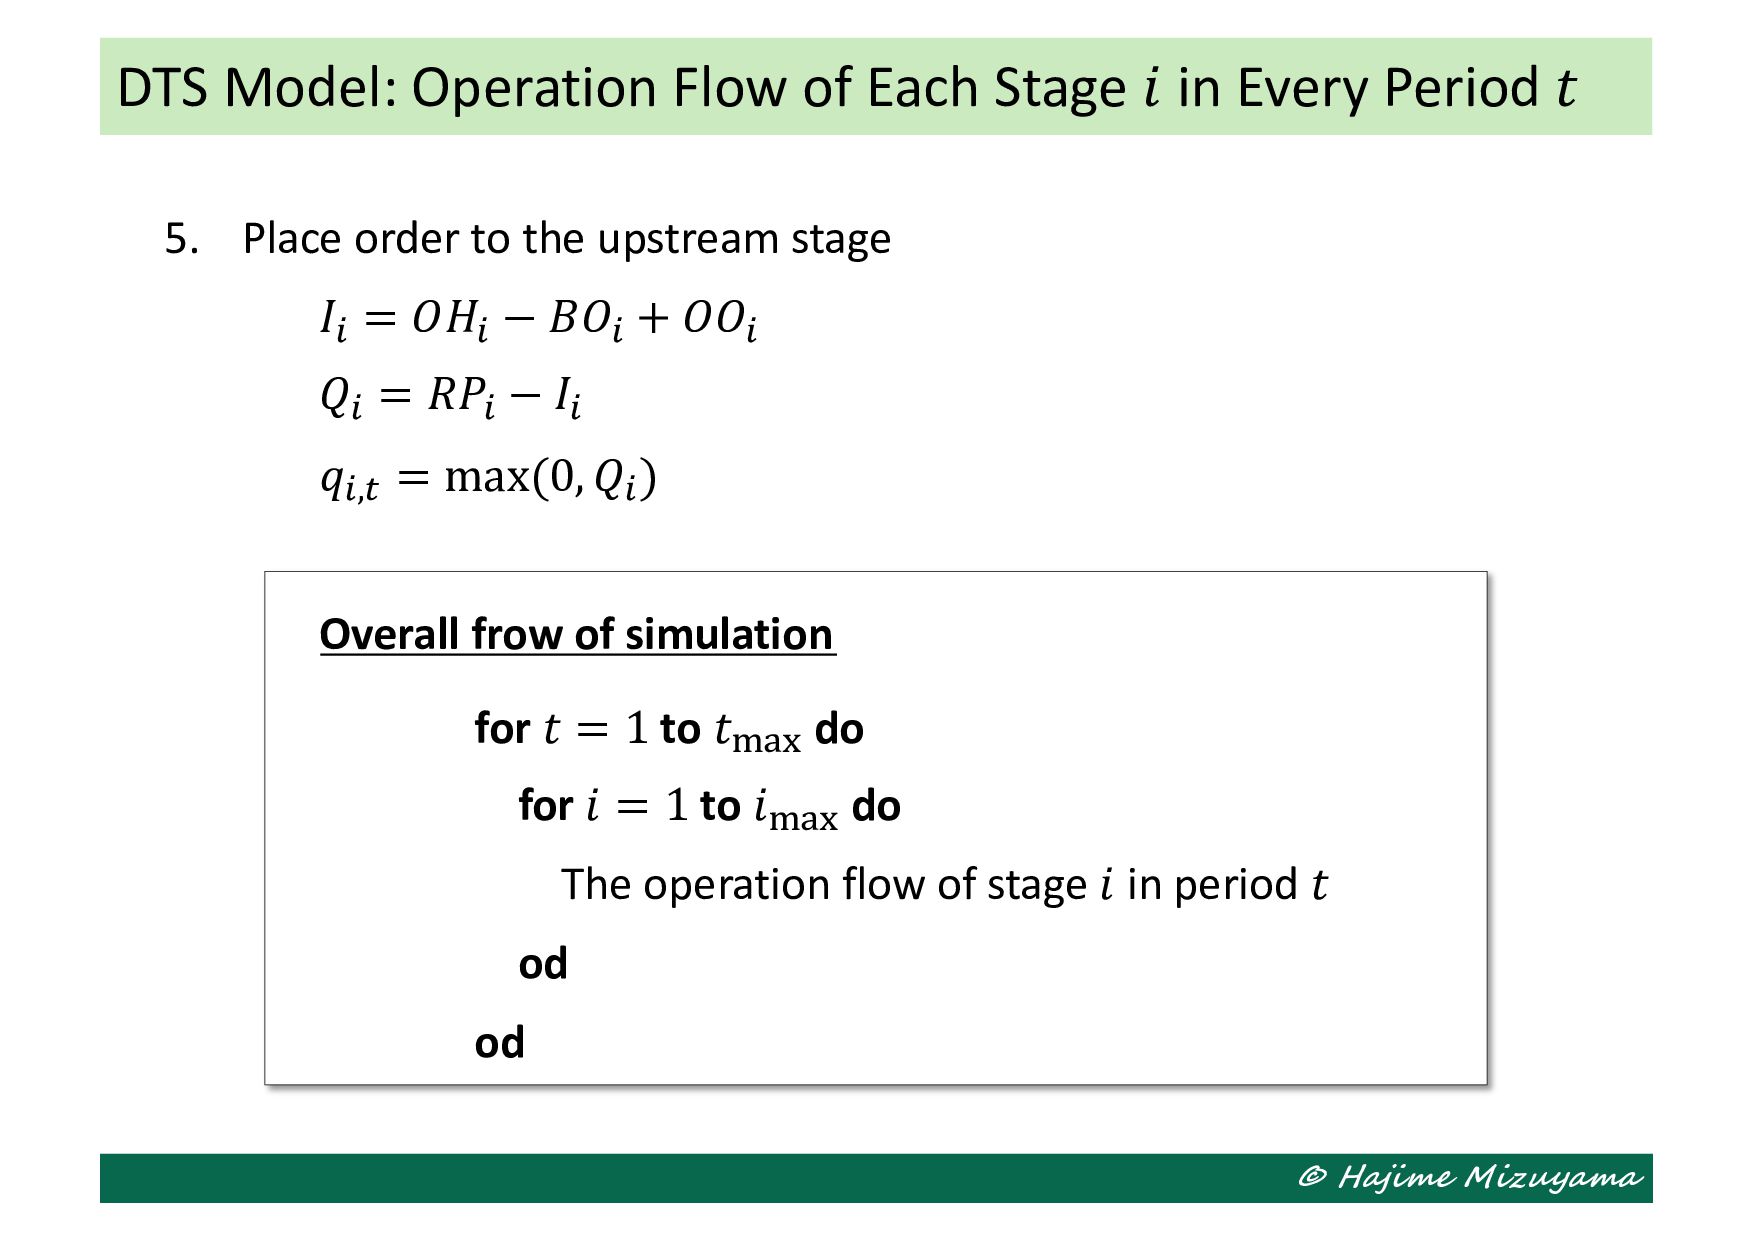
𝐼% = 𝑂𝐻% − 𝐵𝑂% + 𝑂𝑂% 𝑄% = 𝑅𝑃% − 𝐼% 𝑞%,' = max(0, 𝑄% ) Overall frow of simulation for 𝑡 = 1 to 𝑡"#$ do for 𝑖 = 1 to 𝑖"#$ do The operation flow of stage 𝑖 in period 𝑡 od od DTS Model: Operation Flow of Each Stage 𝑖 in Every Period 𝑡
Education and training • Business structural measures – Retailer-supplier partnerships (RSP) • Continuous replenishment program (CRP) • Vender managed inventory (VMI) – Third party logistics (3PL) – Vertical integration How to Mitigate Bullwhip Effect
behavioral aspects on the bullwhip effect is difficult to analyze and understand with computer simulation alone. • Serious gaming and participatory simulations are often utilized for studying such effects as well as training and educating people how to address the bullwhip effect. Beer Game (or Beer Distribution Game) John D. Sterman: Modeling Managerial Behavior: Misperceptions of Feedback in a Dynamic Decision Making Experiment, Management Science, Vol.35, No.3, pp.321-339 (1989). Supply Chain Serious Game
for the simulation model used in this lecture is available from the following link. Push “Open in Colab” button, then you can test it in Google Colaboratory environment. https://github.com/j54854/myColab/blob/main/pom2_13.ipynb Sample Code for Supply Chain Simulation Model