Upgrade to Pro — share decks privately, control downloads, hide ads and more …

Using Metrics to Accelerate Value Stream Flow

Using Metrics to Accelerate Value Stream Flow

From my talk at DevOps Institute's Value Stream Management SKILup Day looking at how to use value stream mapping and management techniques to accelerate the flow of work.

Helen Beal

April 30, 2020
Tweet

More Decks by Helen Beal

Other Decks in Business

Transcript

  1. 1 Using Metrics to Accelerate Value Stream Flow Making more

    money, faster Helen Beal Chief Ambassador DevOps Institute @BealHelen [email protected]
  2. 2 2 o Why metrics matter o What metrics matter

    o How to get your metrics o When metrics matter o Metrics evolution Agenda Chief Ambassador @BealHelen Helen Beal DevOps and Ways of Working coach, consultant, learning facilitator. Writer, speaker, analyst and strategic advisor. 2
  3. 4 Why Metrics Matter 4 • We manage what we

    measure • They provide insights into improvement opportunities • They show progress • A DevOps journey is a big investment – we need to know the return • The goal is to become, or retain a position, as a high performing organization • Core to DevOps culture is trust: data is evidence and builds trust “Without a knowledge of what your work is really costing you, you are in no position to say to what extent your real costs vary from what your work should cost you. You have no gauge on performance. Further, because you don’t employ time-study methods and have no definite tasks, you have no means of knowing what performance should be.” 1918
  4. 5 Who Metrics Matter To 5 “High-velocity managers are not

    in place to command, control, berate, intimidate, or evaluate through a contrived set of metrics, but to ensure that their organizations become ever more self- diagnosing and self-improving, skilled at detecting problems, solving them, and multiplying the effect by making the solutions available throughout the organization.” Dr. Stephen Spear
  5. 7 7 Aspect of So ware Delivery Performance* Elite High

    Medium Low Deployment frequency For the primary application or service you work on, how o en does your organization deploy code to production or release it to end users? On-demand (multiple deploys per day) Between once per day and once per week Between once per week and once per month Between once per month and once every six months Lead time for changes For the primary application or service you work on, what is your lead time for changes (i.e., how long does it take to go from code committed to code successfully running in production)? Less than one day Between one day and one week Between one week and one month Between one month and six months Time to restore service For the primary application or service you work on, how long does it generally take to restore service when a service incident or a defect that impacts users occurs (e.g., unplanned outage or service impairment)? Less than one hour Less than one daya Less than one daya Between one week and one month Change failure rate For the primary application or service you work on, what percentage of changes to production or released to users result in degraded service (e.g., lead to service impairment or service outage) and subsequently require remediation (e.g., require a hotfix, rollback, fix forward, patch)? 0-15%b,c 0-15%b,d 0-15%c,d 46-60% 2019 A C C E L E R A T E State of DevOps Sponsored by 7
  6. 8 8 8 Velocity Flow Velocity is the number of

    flow Items of each type completed over a particular period of time - also referred to as throughput Distribution Flow Distribution measures the ratio of the four Flow Items completed over a particular window of time Time Flow Time measures the time it takes for Flow Items to go from ‘work start’ to ‘work complete’, including both active and wait times Efficiency Flow Efficiency is the ratio of active time vs. wait time out of the total Flow Time Load Flow Load measures the number of Flow Items currently in progress (active or waiting) within a particular value stream
  7. 9 Definition of Value 9 value noun /ˈvæl.juː/ 1. The

    amount of money that can be received for something 2. The importance or worth of something for someone
  8. 11 Start with Value Stream Thinking 11 5Selecting Which Value

    Stream to Start With “Once we have identified a value stream to which we want to apply DevOps principles and patterns, our next step is to gain a sufficient understanding of how value is delivered to the customer: what work is performed and by whom, and what steps can we take to improve flow.” 6Understanding the Work in Our Value Stream, Making it Visible, and Expanding it Across the Organization
  9. 14 Move to Value Stream Management 14 FOR APPLICATION DEVELOPMENT

    & DELIVERY PROFESSIONALS The Forrester New Wave™: Value Stream Management Tools, Q3 2018 August 6, 2018 © 2018 Forrester Research, Inc. Unauthorized copying or distributing is a violation of copyright law. 
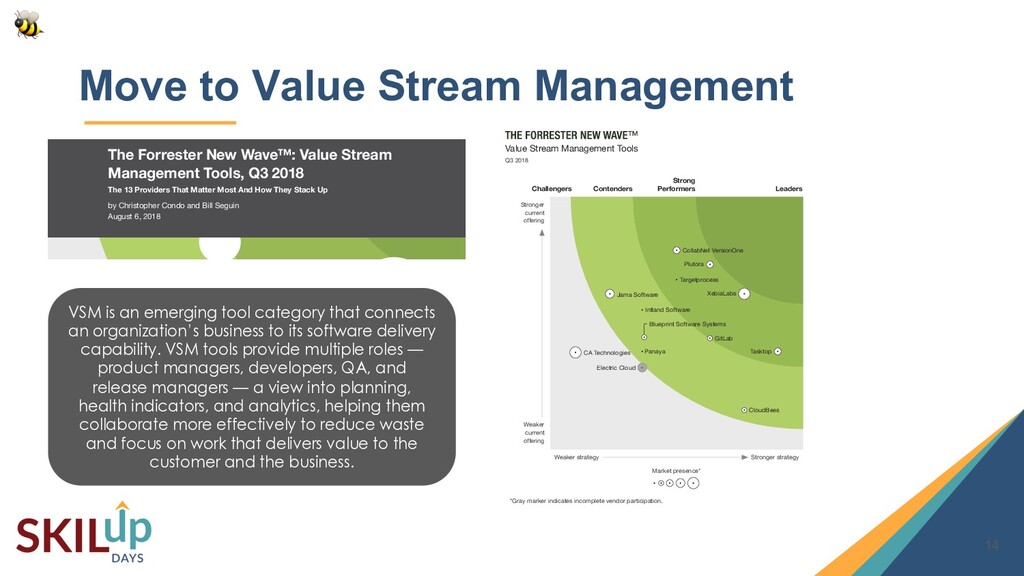
[email protected] or +1 866-367-7378 4 The 13 Providers That Matter Most And How They Stack Up FIGURE 2 Forrester New Wave™: Value Stream Management Tools, Q3 2018 Challengers Contenders Leaders Strong Performers Stronger current offering Weaker current offering Weaker strategy Stronger strategy Market presence* *Gray marker indicates incomplete vendor participation. CollabNet VersionOne Plutora Targetprocess XebiaLabs Jama Software Intland Software Blueprint Software Systems GitLab Tasktop Panaya CA Technologies Electric Cloud CloudBees Value Stream Management Tools Q3 2018 The Forrester New Wave™: Value Stream Management Tools, Q3 2018 The 13 Providers That Matter Most And How They Stack Up by Christopher Condo and Bill Seguin August 6, 2018 NOT LICENSED FOR DISTRIBUTION Key Takeaways No Vendor Leads The Pack Forrester’s research uncovered a market in which there are no Leaders; XebiaLabs, Plutora, CollabNet VersionOne, Tasktop, Targetprocess, and GitLab are Strong Performers; CloudBees, Intland Software, Jama Software, Blueprint Software Systems, and Panaya are Contenders; and Electric Cloud and CA Technologies are Challengers. Mapping, Visualization, And Product Vision Are The Biggest Differentiators In The Market VSM helps software development organizations visualize the development pipeline end to end. These tools capture, visualize, and analyze critical indicators of the speed and quality of software product creation. VSM is an emerging market: Vendors with a vision of empowering teams with analytics informed by real-world data and exible planning schemes beat out those that focus on incremental enhancements within their traditional domains. Why Read This Report In Forrester’s evaluation of the emerging market for value stream management (VSM) tools, we identi ed the 13 most signi cant providers in the category — Blueprint Software Systems, CA Technologies, CollabNet VersionOne, CloudBees, Electric Cloud, GitLab, Intland Software, Jama Software, Panaya, Plutora, Targetprocess, Tasktop, and XebiaLabs — and evaluated them. This report details how each vendor scored against 10 criteria and where they stand in relation to each other. Application development and delivery (AD&D) leaders should use it to select the right solution for improving software development. VSM is an emerging tool category that connects an organization’s business to its software delivery capability. VSM tools provide multiple roles — product managers, developers, QA, and release managers — a view into planning, health indicators, and analytics, helping them collaborate more effectively to reduce waste and focus on work that delivers value to the customer and the business.
  10. 15 A Value Cycle 15 PORTFOLIO AND BACKLOG Vision and

    goals are set and aligned to epics, features, PBIs and user stories. INSIGHTS AND ANALYSIS Monitoring and observability provide insights into customer reaction to changes and report on value realization. CONTINUOUS INTEGRATION Code is created, artifacts incorporated, versions controlled, code is built in a trunk based manner. CONTINUOUS DELIVERY The changes are approved, released and operated in the live environment. CONTINUOUS TESTING Functional and non-functional testing takes place at every commit at every step or gate through route to live.
  11. 16 Where Metrics Live 16 Value Stream Management: FLOW &

    CYCLE TIME Portfolio & Backlog Continuous Integration Continuous Testing Continuous Delivery Insights and Analysis Tool Jira Jenkins Jenkins ServiceNow New Relic Metric Lead Time Deployment Frequency Defect rate Change fail rate, MTTR Value
  12. 18 When Metrics Matter 18 DevOps Journey Baseline Sprint Sprint

    Sprint Sprint Sprint 18 Sprint Ad infinitum (or until product is euthanized)
  13. 19 When Metrics Matter 19 DevOps Journey Baseline Sprint Sprint

    Sprint Sprint 19 Sprint Ad infinitum (or until product is euthanized) Sprint
  14. 20 Sprint When Metrics Matter 20 20 Sprint Planning Align

    sprint goal to value stream metrics – inspect Value Stream Management Tool Sprint Review Inspect success of sprint goal using value stream metrics – inspect Value Stream Management Tool Sprint Retro Look for improvement opportunities – inspect insights from Value Stream Management Tool
  15. 21 Metrics & The Improvement Kata 21 1 2 3

    4 Set the long term vision Inspect current condition PDCA Set next target state
  16. 22 Metrics Evolution 22 DevOps Journey Baseline Sprint Sprint Sprint

    Sprint Sprint 22 Sprint Ad infinitum (or until product is euthanized) Deployment frequency: Once every three months Deployment frequency: On demand