and visualization; – Built on of HTML, CSS, and D3.js • Dashboards provide a way to summarize complex data in an easy-to-read format – Often built using HTML, CSS and other web-friendly platforms. • Web-based platforms can be used locally or online Web-centric tools
plotly framework • Interface is different from ggplot, but is based on similar ideas – Start with a dataset – Define mappings from variables to plot features – Specify plot type • This is the “grammar of graphics” in ggplot Plotly
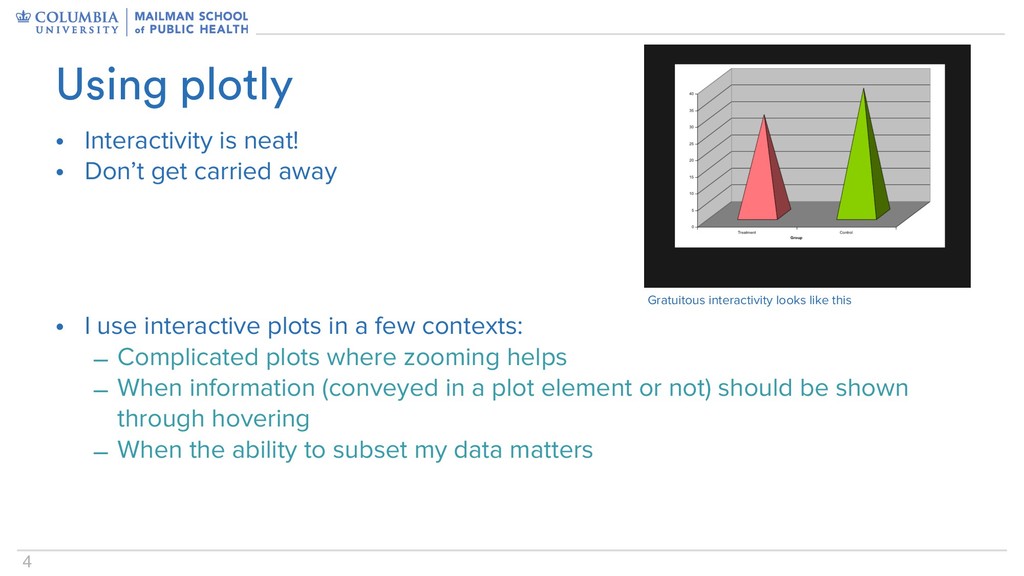
• I use interactive plots in a few contexts: – Complicated plots where zooming helps – When information (conveyed in a plot element or not) should be shown through hovering – When the ability to subset my data matters Using plotly Gratuitous interactivity looks like this
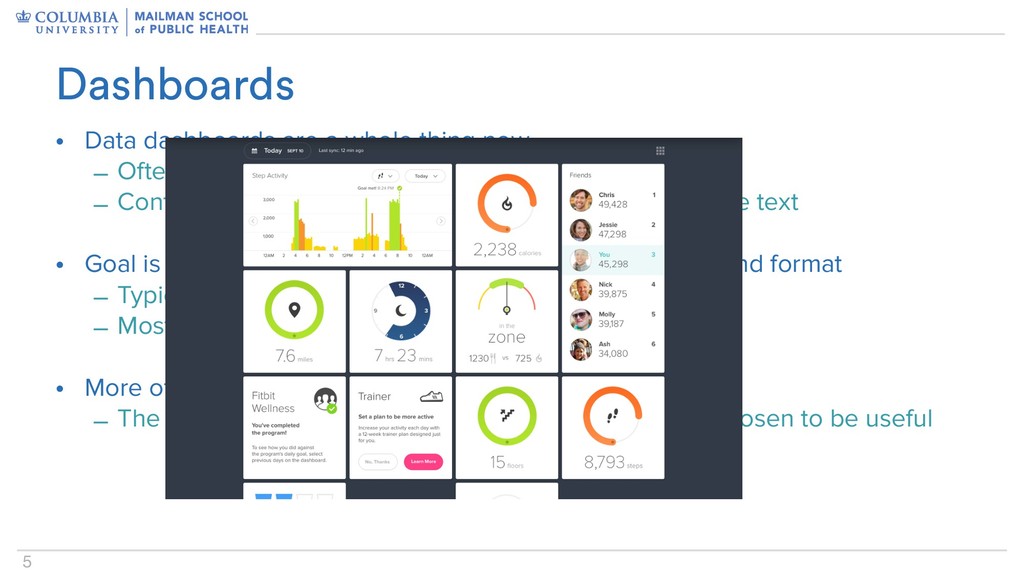
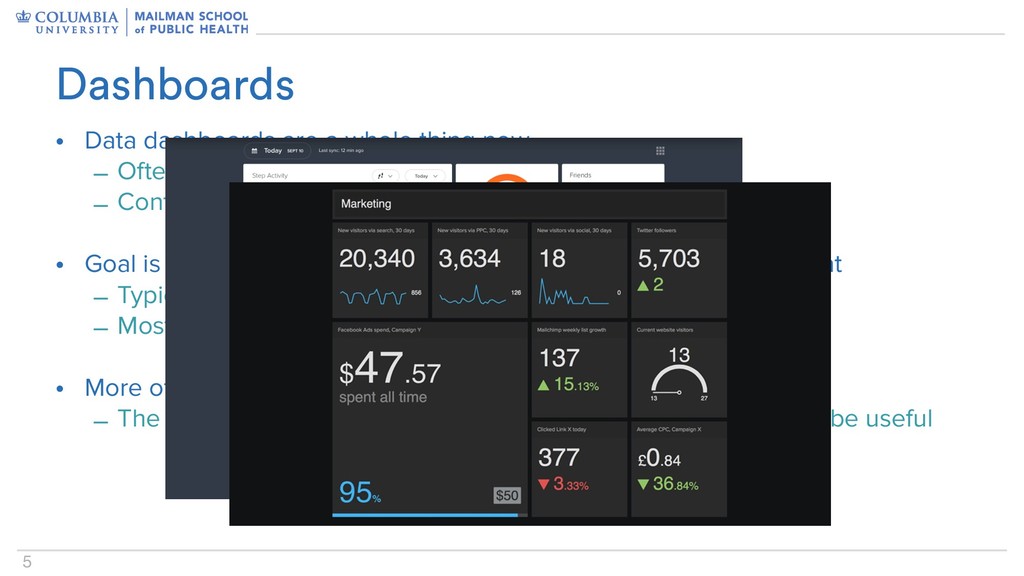
Often web-based (or at least web-inspired) – Contain well-organized plots, tables, etc. with only a little text • Goal is to convey a lot of information in a easy-to-understand format – Typically enable exploration by the user – Most useful for large, complex datasets • More of a “deliverable” than an “exploratory product” – The plots embedded in a dashboard are deliberately chosen to be useful Dashboards
Often web-based (or at least web-inspired) – Contain well-organized plots, tables, etc. with only a little text • Goal is to convey a lot of information in a easy-to-understand format – Typically enable exploration by the user – Most useful for large, complex datasets • More of a “deliverable” than an “exploratory product” – The plots embedded in a dashboard are deliberately chosen to be useful Dashboards
Often web-based (or at least web-inspired) – Contain well-organized plots, tables, etc. with only a little text • Goal is to convey a lot of information in a easy-to-understand format – Typically enable exploration by the user – Most useful for large, complex datasets • More of a “deliverable” than an “exploratory product” – The plots embedded in a dashboard are deliberately chosen to be useful Dashboards
Often web-based (or at least web-inspired) – Contain well-organized plots, tables, etc. with only a little text • Goal is to convey a lot of information in a easy-to-understand format – Typically enable exploration by the user – Most useful for large, complex datasets • More of a “deliverable” than an “exploratory product” – The plots embedded in a dashboard are deliberately chosen to be useful Dashboards
… • flexdashboard allows R Markdown to output a structured HTML file – You have to learn (or copy) elements for layout, but otherwise you’re writing an RMD file • Can host online as part of a webpage, just like any other HTML file produced by R Markdown – Create a GitHub repo + R Project – Put website stuff in it – Tell GitHub this is a website – … – Profit? flexdashboard