Upgrade to Pro — share decks privately, control downloads, hide ads and more …

Idea Management Communities in the Wild

Idea Management Communities in the Wild

Jorge Saldivar

November 01, 2016
Tweet

More Decks by Jorge Saldivar

Other Decks in Research

Transcript

  1. IDEA MANAGEMENT COMMUNITIES IN THE WILD An exploratory study of

    166 online communities Collaboration Technologies and Systems (CTS) 2016 Jorge Saldivar - Marcos Báez - Carlos Rodríguez - Gregorio Convertino - Grzegorz Kowalik
  2. IDEA MANAGEMENT Idea Management (IM) is the process of requesting,

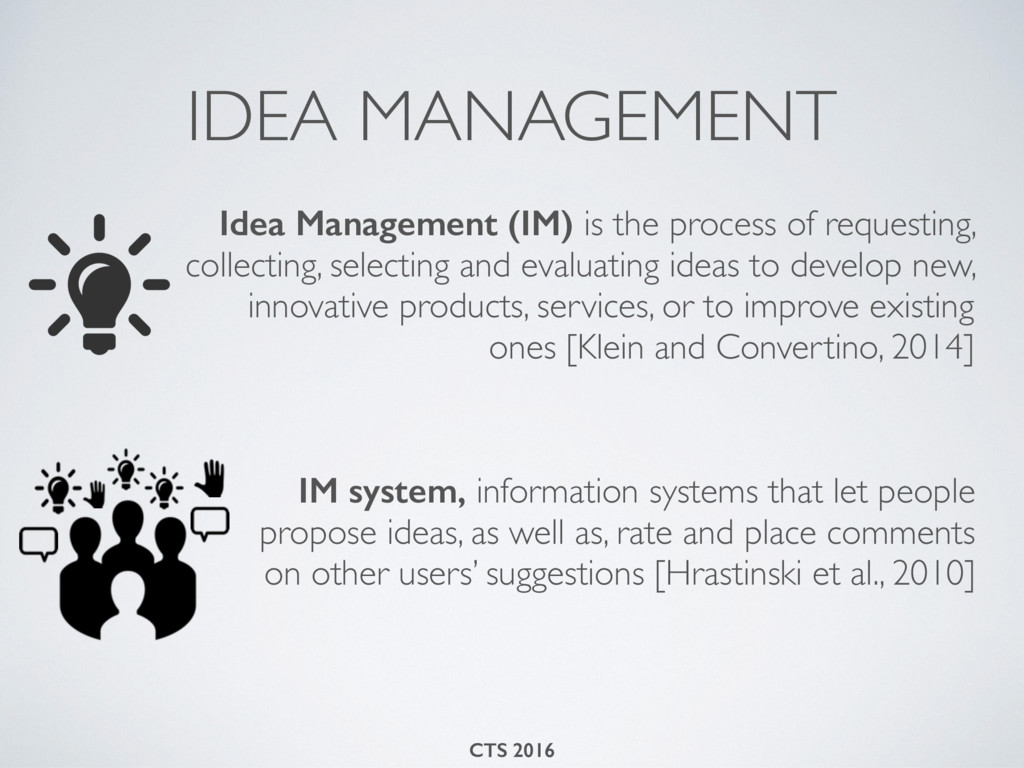
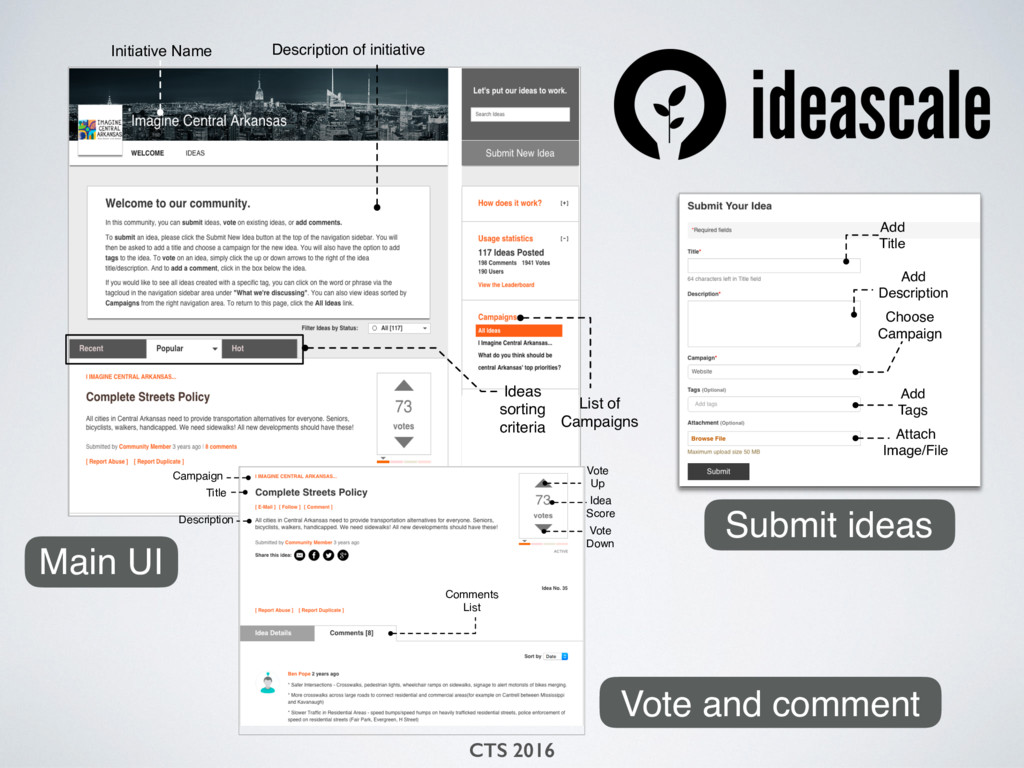
    collecting, selecting and evaluating ideas to develop new, innovative products, services, or to improve existing ones [Klein and Convertino, 2014] IM system, information systems that let people propose ideas, as well as, rate and place comments on other users’ suggestions [Hrastinski et al., 2010] 
 CTS 2016
  3. RESEARCH QUESTIONS What type of communities emerge in IM Systems?

    WHO HOW What individual and collective behaviors emerge in IM Systems? CTS 2016
  4. CTS 2016 Submit ideas Description of initiative Initiative Name Ideas

    sorting criteria List of Campaigns Campaign Title Vote Up Vote Down Description Idea Score Comments List Add Title Add Description Choose Campaign Add Tags Attach Image/File Vote and comment Main UI
  5. QUALITATIVE ANALYSIS OF IM COMMUNITIES 1 analyzed 20 communities agreed

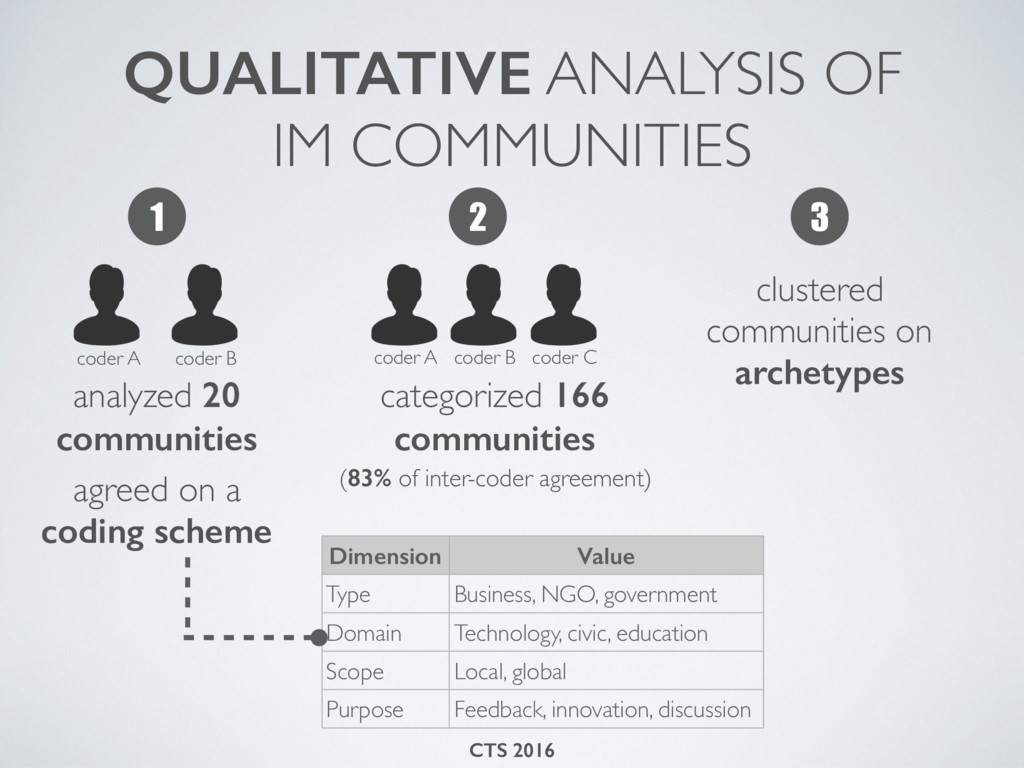
    on a coding scheme coder A coder B CTS 2016 2 coder A coder B coder C categorized 166 communities 3 clustered communities on archetypes (83% of inter-coder agreement) Dimension Value Type Business, NGO, government Domain Technology, civic, education Scope Local, global Purpose Feedback, innovation, discussion
  6. ARCHETYPES ARCH 1 41% Communities run by companies in the

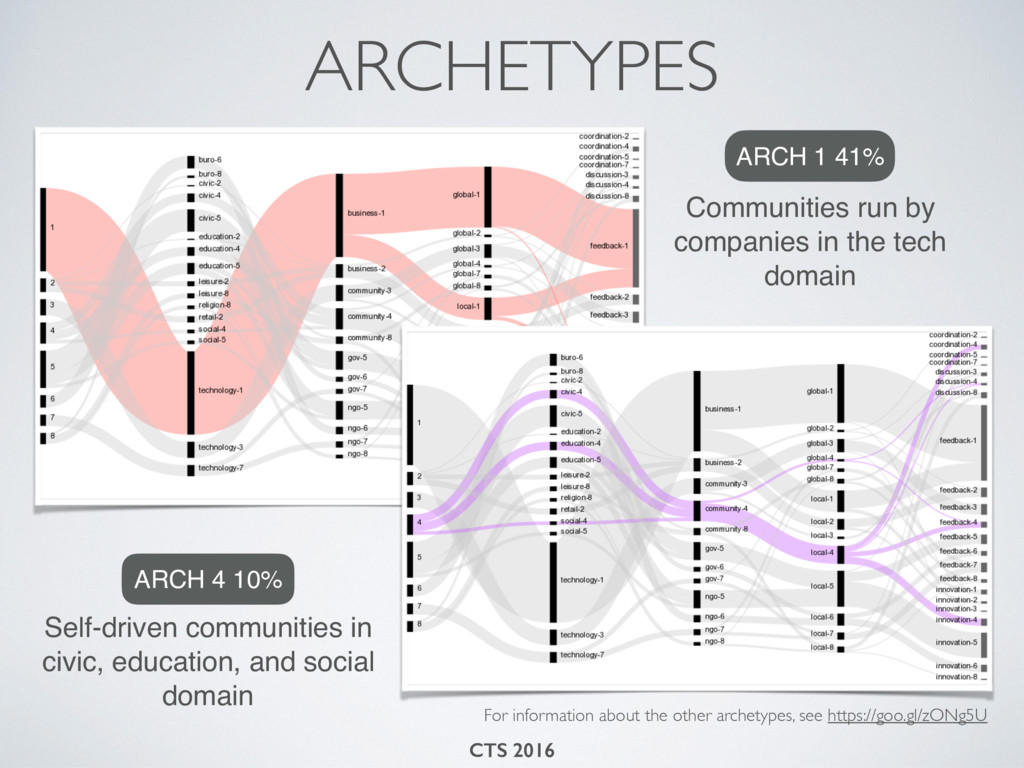
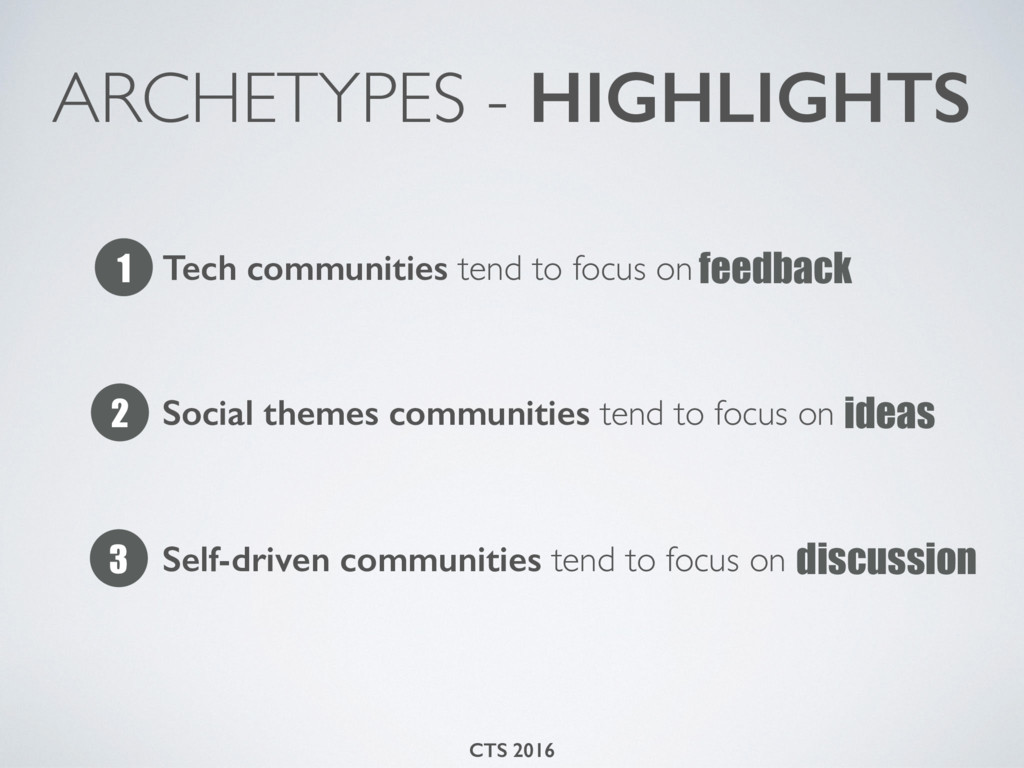
    tech domain ARCH 4 10% Self-driven communities in civic, education, and social domain For information about the other archetypes, see https://goo.gl/zONg5U CTS 2016
  7. ARCHETYPES - HIGHLIGHTS CTS 2016 1 Tech communities tend to

    focus on feedback 2 Social themes communities tend to focus on ideas 3 Self-driven communities tend to focus on discussion
  8. PATTERNS IN FOUR TYPES OF ACTIONS idea submission member registration

    comment posting vote casting CTS 2016 1 2 3 4
  9. QUANTITATIVE ANALYSIS 1 Partition of actions in the first year

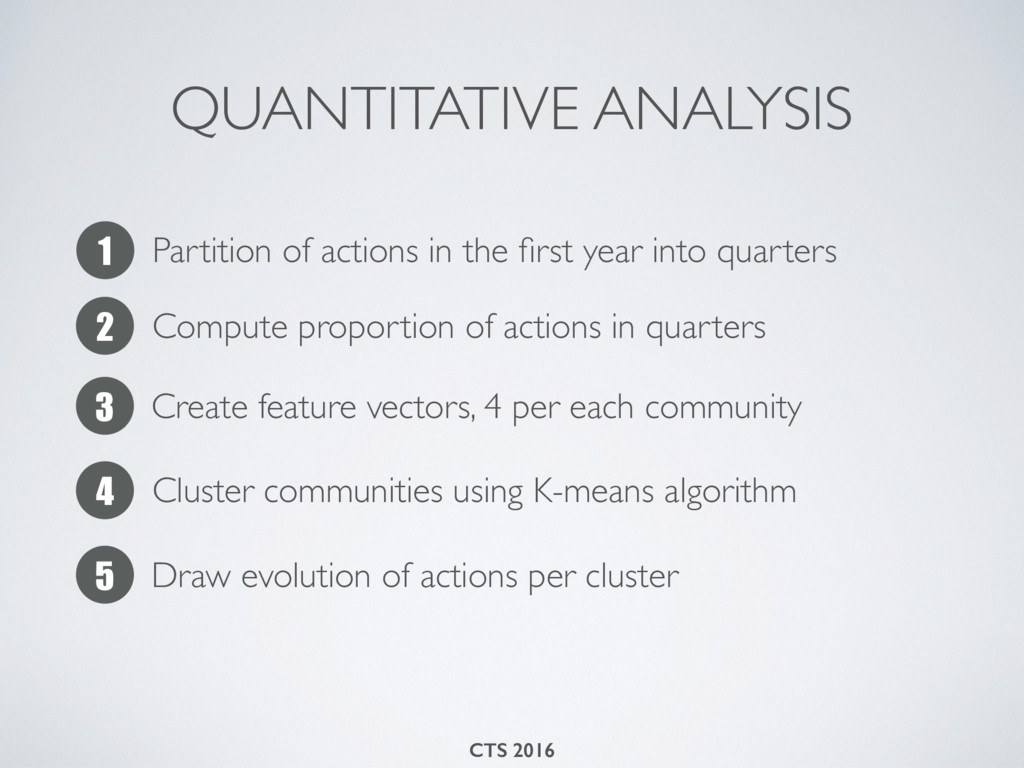
    into quarters 2 Compute proportion of actions in quarters 3 Create feature vectors, 4 per each community CTS 2016 4 Cluster communities using K-means algorithm 5 Draw evolution of actions per cluster
  10. BEHAVIORAL PATTERNS .00 .25 .50 .75 .00 .00 .25 .50

    .75 .00 .00 .25 .50 .75 .00 .00 .25 .50 .75 .00 .00 .25 .50 .75 .00 Cluster 1 (N=55) Cluster 2 (N=20) Cluster 3 (N=53) Cluster 4 (N=4) Cluster 5 (N=34) 0 3 6 9 12 Month 0.00 0.25 0.50 0.75 1.00 0.00 0.25 0.50 0.75 1.00 0.00 0.25 0.50 0.75 1.00 0.00 0.25 0.50 0.75 1.00 0.00 0.25 0.50 0.75 1.00 Cluster 1 (N=55) Cluster 2 (N=20) Cluster 3 (N=53) Cluster 4 (N=4) Cluster 5 (N=34) 0 3 6 9 12 Month Proportion of users registered Member registration 33% 13% 32% 2% 20% Q1 peak and gradual decent Q1 peak and rapid decent Q1 peak and super rapid decent Q2 peak and super rapid decent Q4 latter peak 0.00 0.25 0.50 0.75 1.00 0.00 0.25 0.50 0.75 1.00 0.00 0.25 0.50 0.75 1.00 0.00 0.25 0.50 0.75 1.00 0.00 0.25 0.50 0.75 1.00 Cluster 1 (N=48) Cluster 2 (N=11) Cluster 3 (N=61) Cluster 4 (N=6) Cluster 5 (N=40) 0 3 6 9 12 Month Proportion of ideas produced 0.00 0.25 0.50 0.75 1.00 0.00 0.25 0.50 0.75 1.00 0.00 0.25 0.50 0.75 1.00 0.00 0.25 0.50 0.75 1.00 0.00 0.25 0.50 0.75 1.00 Cluster 1 (N=32) Cluster 2 (N=18) Cluster 3 (N=48) Cluster 4 (N=13) Cluster 5 (N=55) 0 3 6 9 12 Month Proportion of comments produced 0.00 0.25 0.50 0.75 1.00 0.00 0.25 0.50 0.75 1.00 0.00 0.25 0.50 0.75 1.00 0.00 0.25 0.50 0.75 1.00 0.00 0.25 0.50 0.75 1.00 Cluster 1 (N=34) Cluster 2 (N=24) Cluster 3 (N=56) Cluster 4 (N=5) Cluster 5 (N=47) 0 3 6 9 12 Month Proportion of votes produced idea submission comment posting vote casting
  11. COLLECTIVE BEHAVIOR - HIGHLIGHTS CTS 2016 1 A main peak

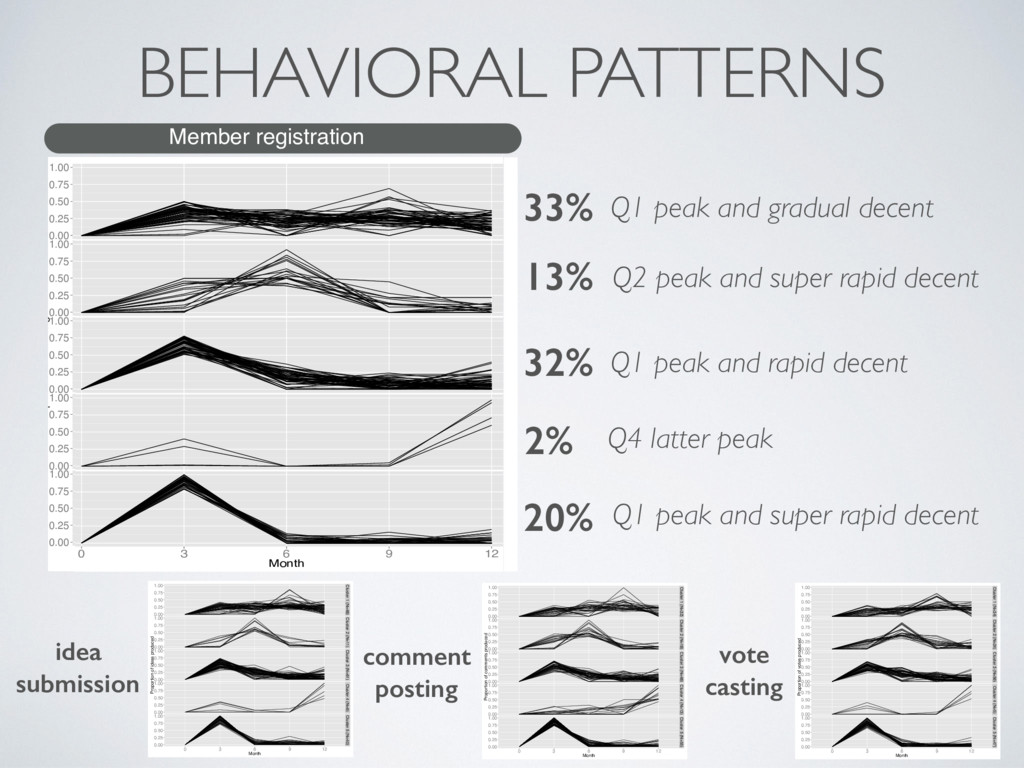
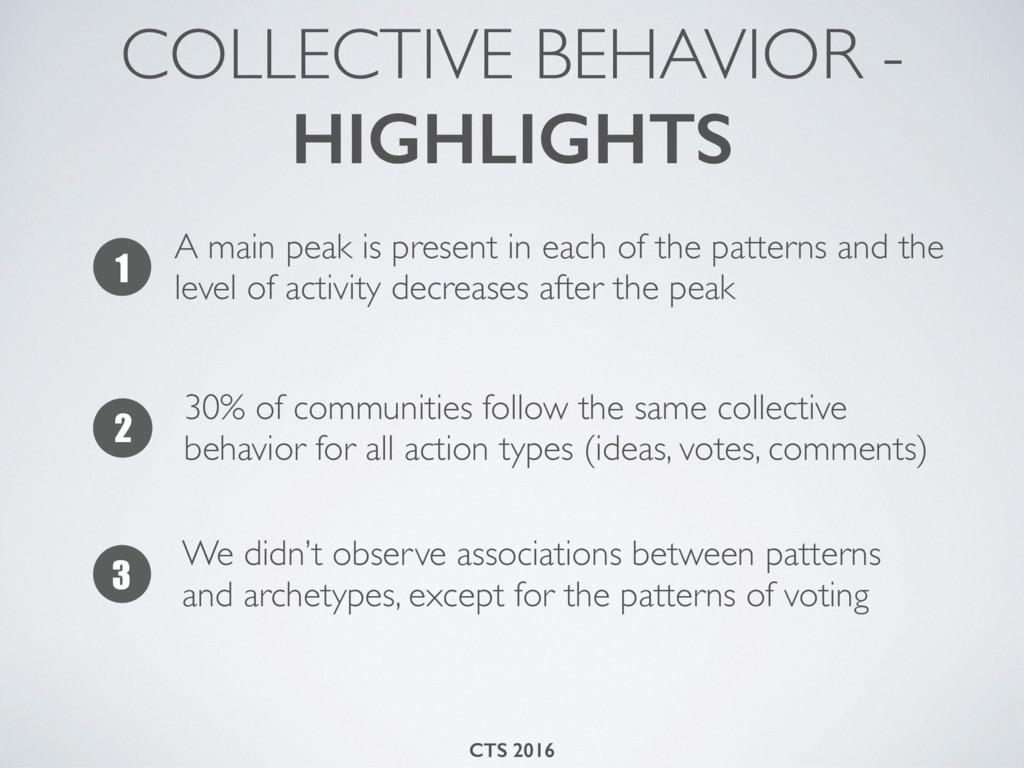
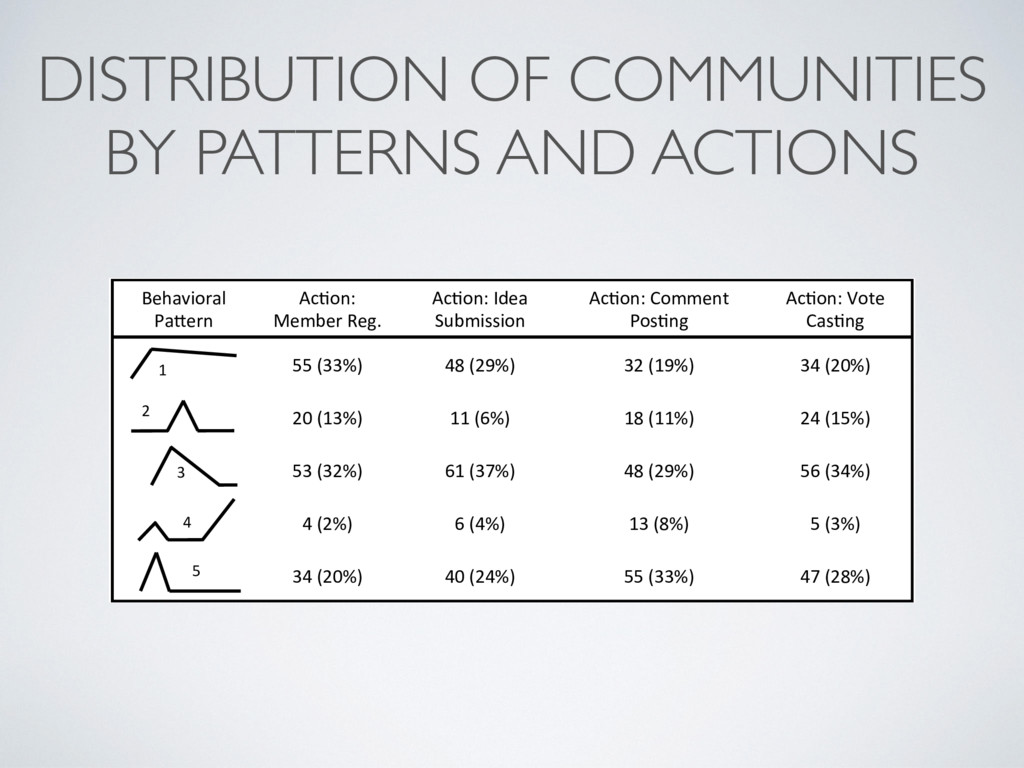
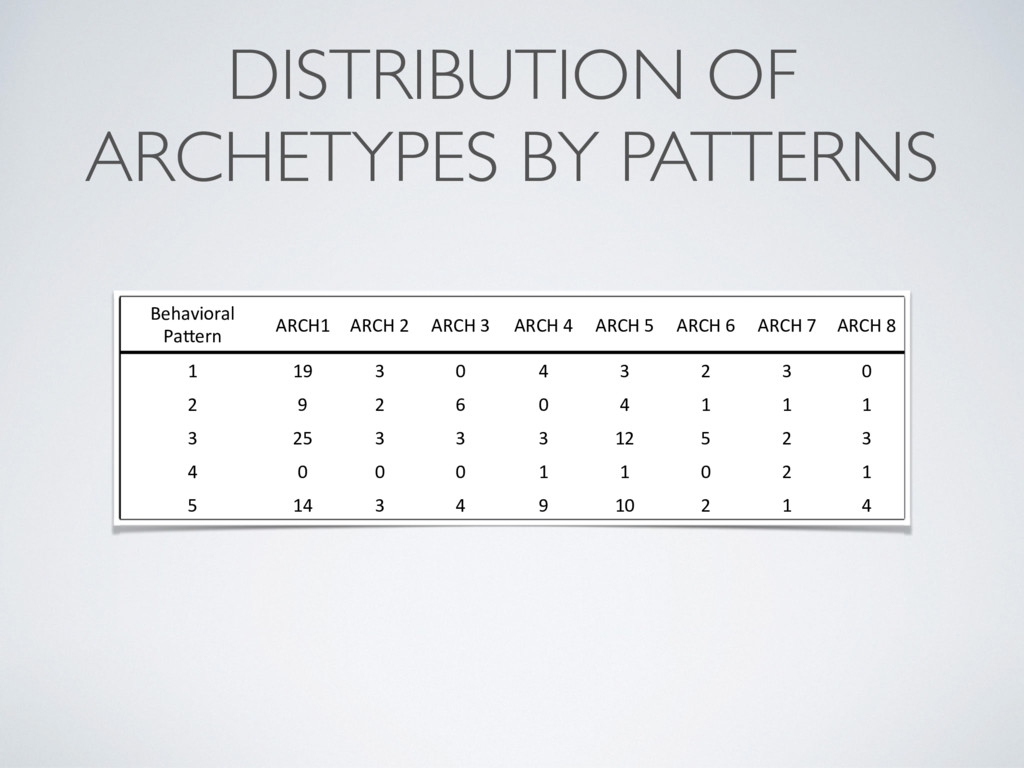
    is present in each of the patterns and the level of activity decreases after the peak 3 We didn’t observe associations between patterns and archetypes, except for the patterns of voting 2 30% of communities follow the same collective behavior for all action types (ideas, votes, comments)
  12. one action member registration day after first action in communities

    run by organizations remain active longer QUANTITATIVE ANALYSIS OF INDIVIDUAL BEHAVIOR ideation members only CTS 2016
  13. 1 Most people perform only one action and that action

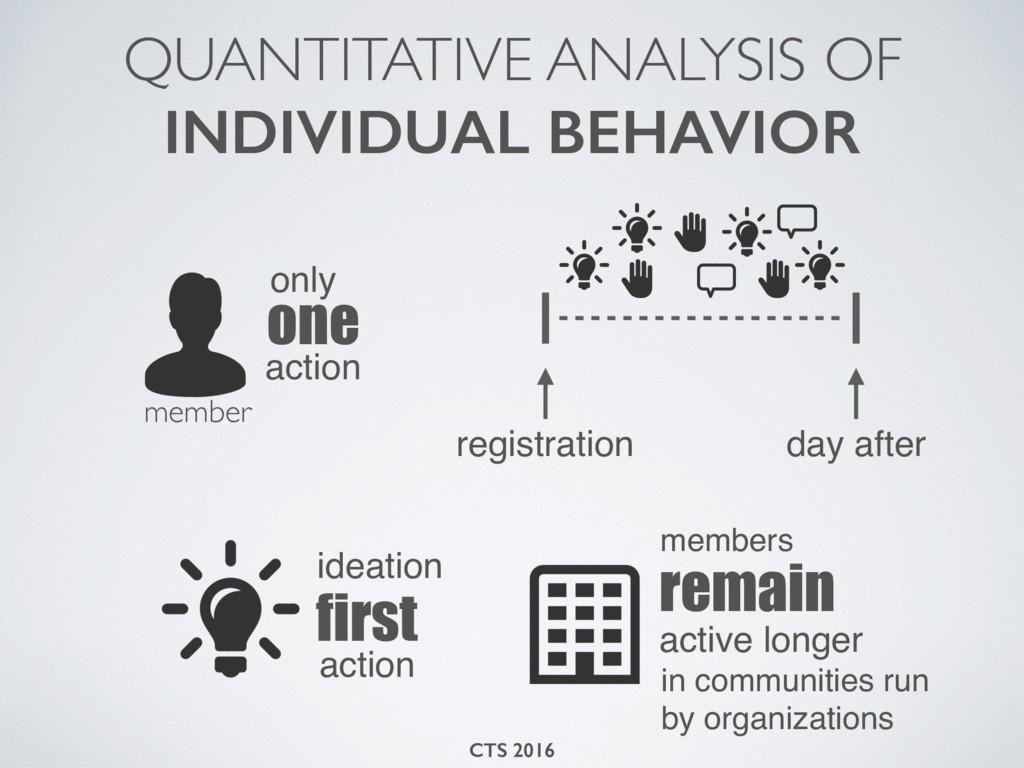
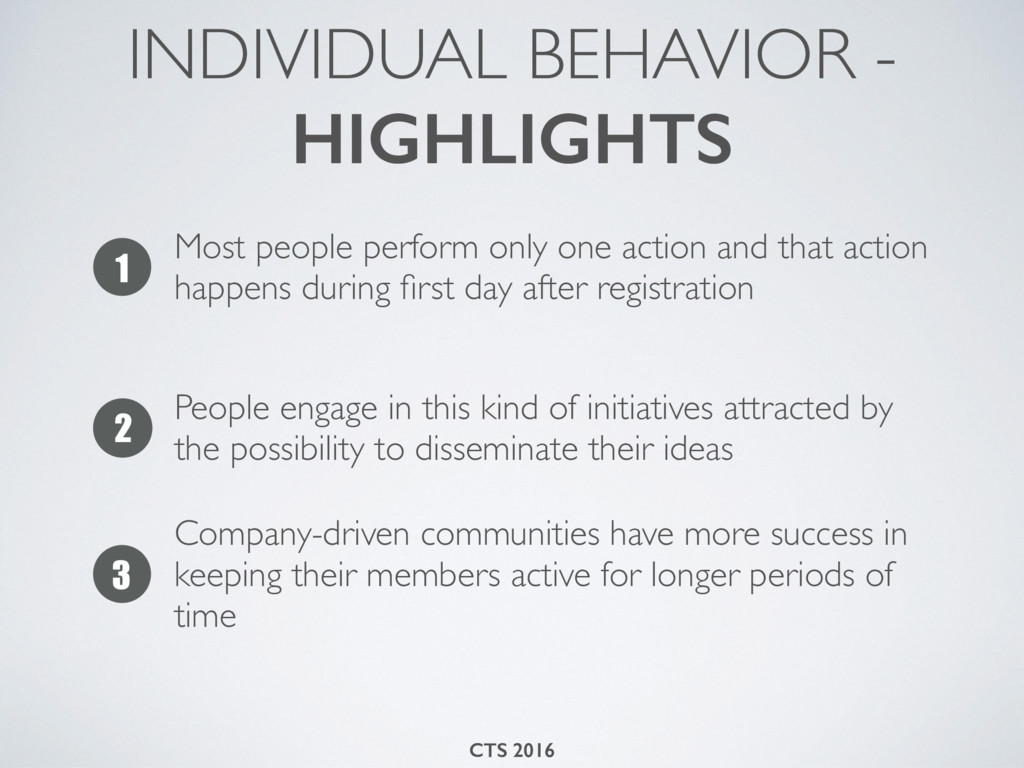
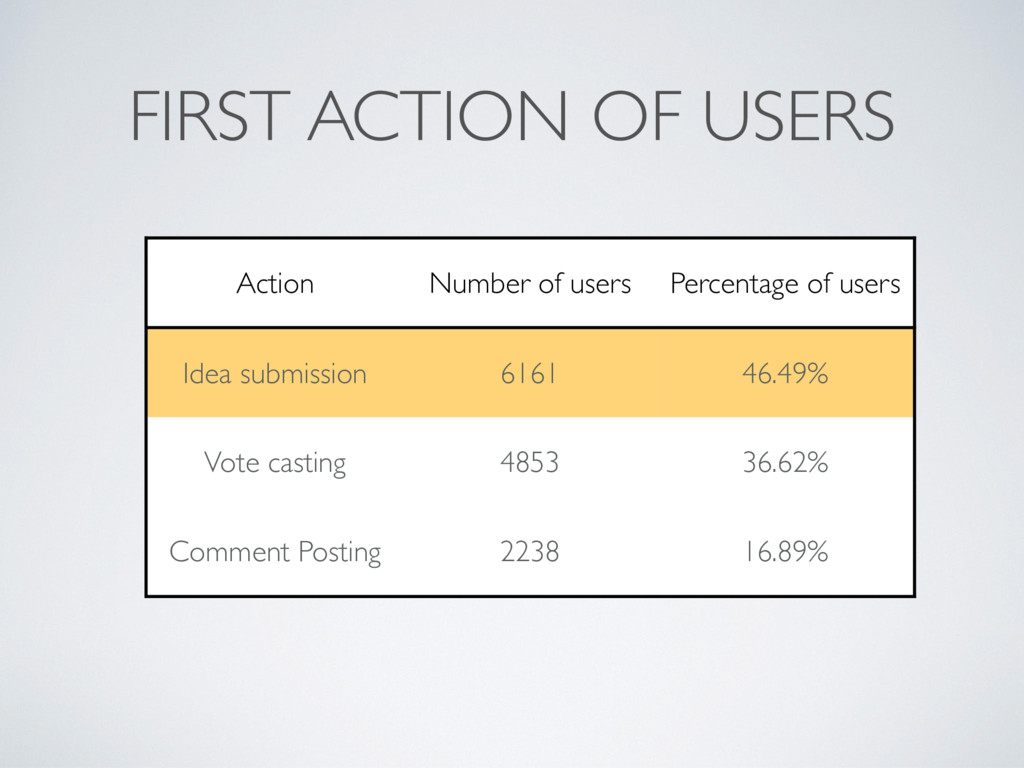
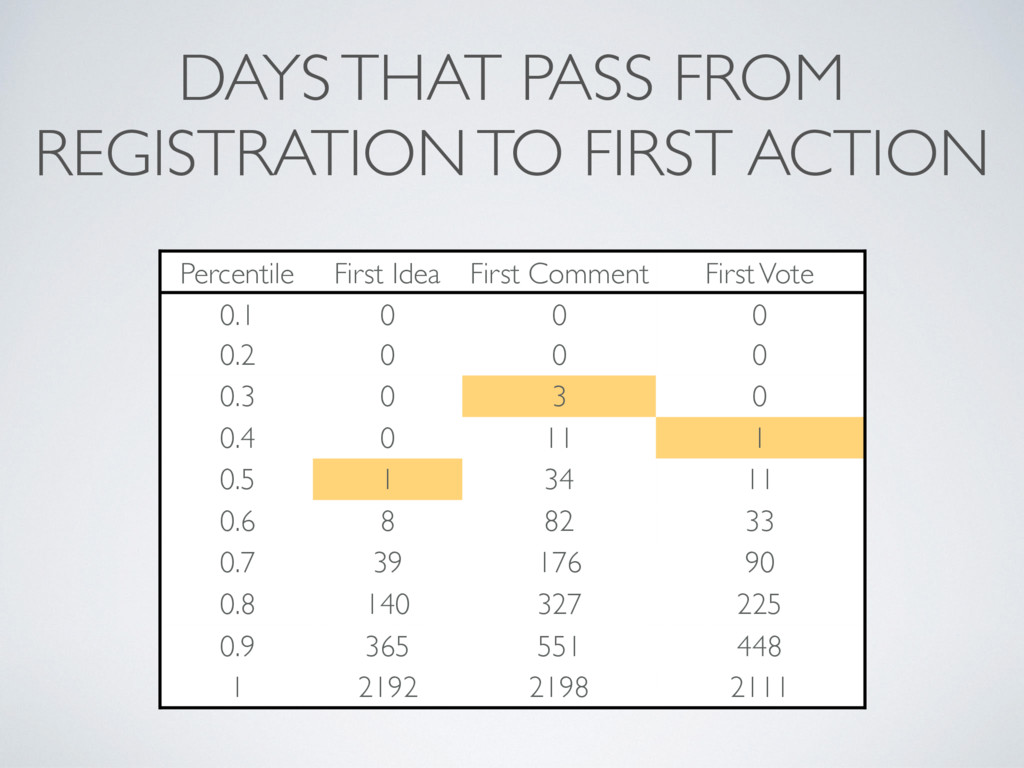
    happens during first day after registration 3 Company-driven communities have more success in keeping their members active for longer periods of time 2 People engage in this kind of initiatives attracted by the possibility to disseminate their ideas INDIVIDUAL BEHAVIOR - HIGHLIGHTS CTS 2016
  14. LIMITATIONS 1 Findings are tightly connected to the platform we

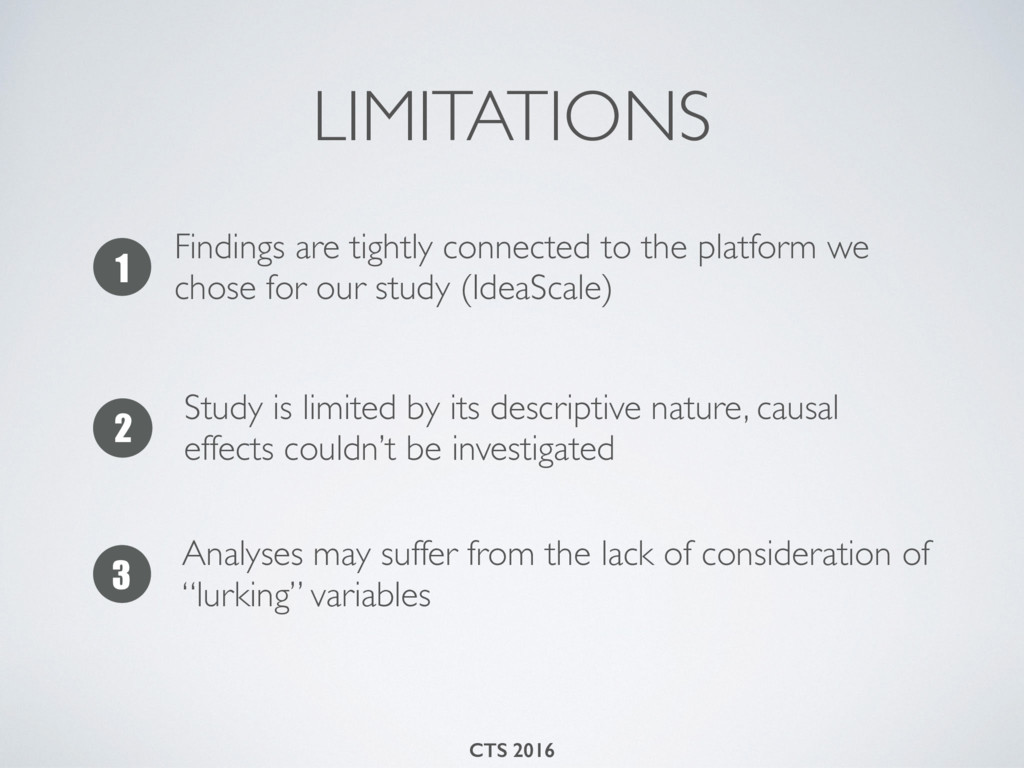
    chose for our study (IdeaScale) 2 Study is limited by its descriptive nature, causal effects couldn’t be investigated 3 Analyses may suffer from the lack of consideration of “lurking” variables CTS 2016
  15. FUTURE WORKS 1 Early identification of the point when the

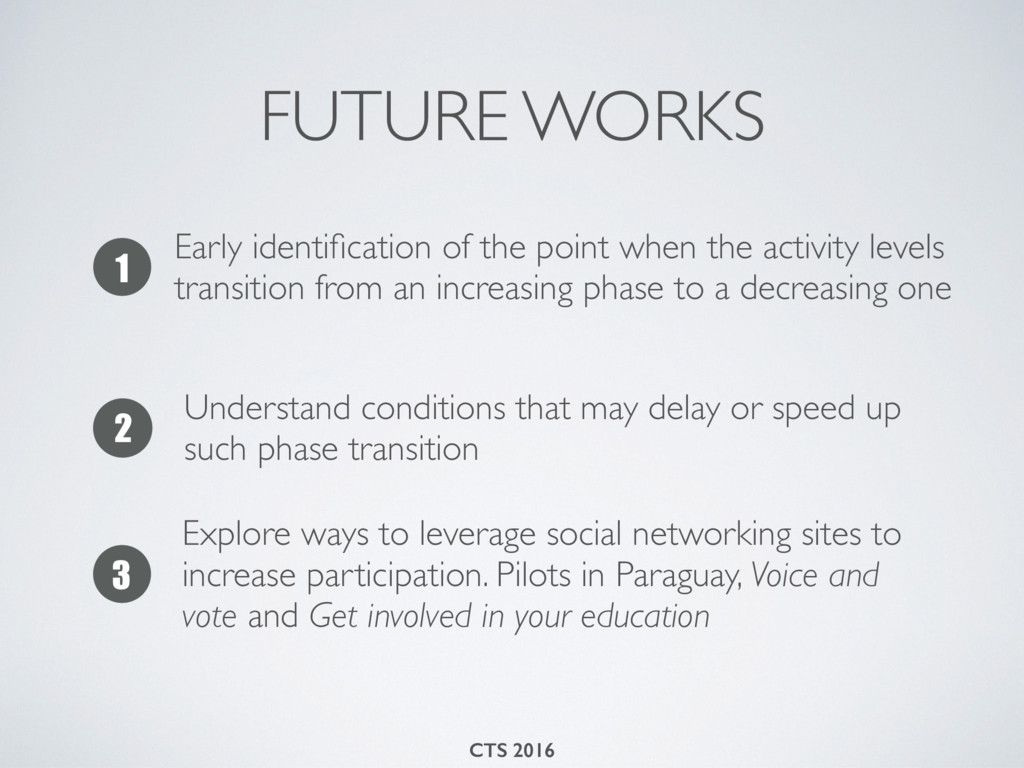
    activity levels transition from an increasing phase to a decreasing one 2 Understand conditions that may delay or speed up such phase transition 3 Explore ways to leverage social networking sites to increase participation. Pilots in Paraguay, Voice and vote and Get involved in your education CTS 2016
  16. QUESTIONS? Thanks For information about the code scheme and results,

    see https://goo.gl/zONg5U [email protected] @jorgesaldivar This work has been supported by CONACYT, Paraguay through the program PROCIENCIA with resources of the fund for the Excellence in Education and Research (FEEI in its spanish acronym) of FONACIDE
  17. Behavioral* Pa,ern* Ac0on:* Member*Reg.* Ac0on:*Idea* Submission* Ac0on:*Comment* Pos0ng* Ac0on:*Vote* Cas0ng*

    55*(33%)* 48*(29%)* 32*(19%)* 34*(20%)* 20*(13%)* 11*(6%)* 18*(11%)* 24*(15%)* 53*(32%)* 61*(37%)* 48*(29%)* 56*(34%)* 4*(2%)* 6*(4%)* 13*(8%)* 5*(3%)* 34*(20%)* 40*(24%)* 55*(33%)* 47*(28%)* 3* 1* 2* 4* 5* DISTRIBUTION OF COMMUNITIES BY PATTERNS AND ACTIONS
  18. 1 0 1 2 3 0 1 0 52 4

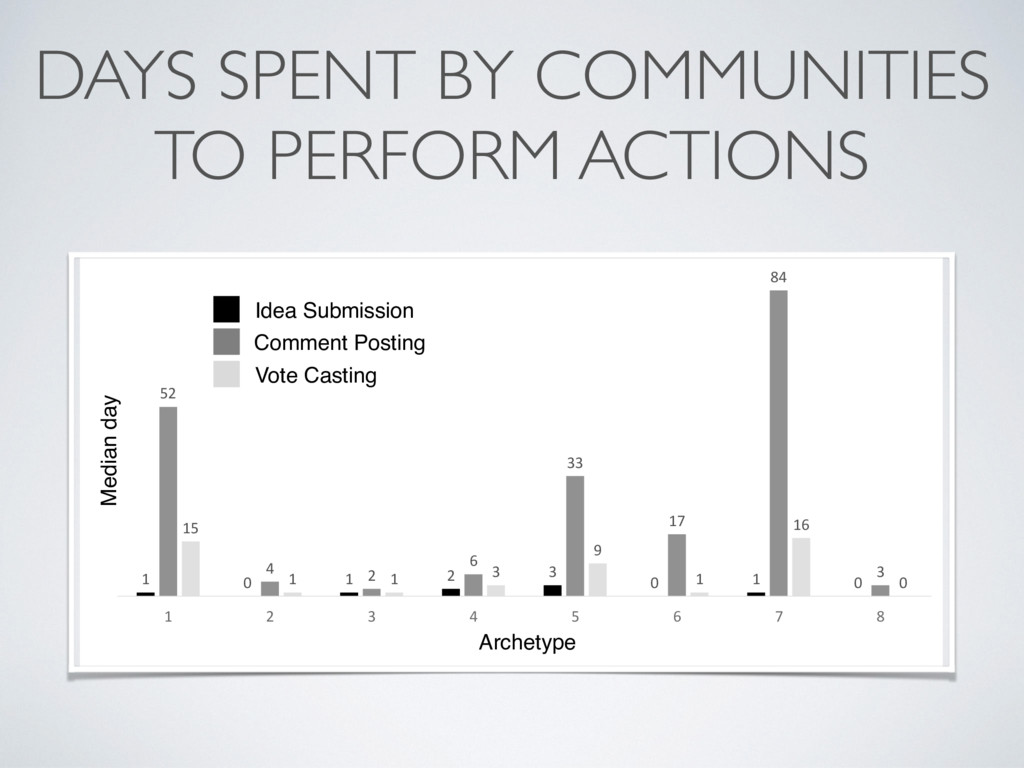
    2 6 33 17 84 3 15 1 1 3 9 1 16 0 1 2 3 4 5 6 7 8 Median day of action Archetype group Median day of action in each Archetype group idea comment vote Median day Archetype Idea Submission Comment Posting Vote Casting DAYS SPENT BY COMMUNITIES TO PERFORM ACTIONS
  19. Behavioral* Pa,ern* ARCH1* ARCH*2* ARCH*3* ARCH*4* ARCH*5* ARCH*6* ARCH*7* ARCH*8*

    1* 19* 3* 0* 4* 3* 2* 3* 0* 2* 9* 2* 6* 0* 4* 1* 1* 1* 3* 25* 3* 3* 3* 12* 5* 2* 3* 4* 0* 0* 0* 1* 1* 0* 2* 1* 5* 14* 3* 4* 9* 10* 2* 1* 4* DISTRIBUTION OF ARCHETYPES BY PATTERNS
  20. FIRST ACTION OF USERS Action Number of users Percentage of

    users Idea submission 6161 46.49% Vote casting 4853 36.62% Comment Posting 2238 16.89%
  21. DAYS THAT PASS FROM REGISTRATION TO FIRST ACTION Percentile First

    Idea First Comment First Vote 0.1 0 0 0 0.2 0 0 0 0.3 0 3 0 0.4 0 11 1 0.5 1 34 11 0.6 8 82 33 0.7 39 176 90 0.8 140 327 225 0.9 365 551 448 1 2192 2198 2111