$30 off During Our Annual Pro Sale. View Details »

Finding Metrics that Matter and Using them Safely

Finding Metrics that Matter and Using them Safely

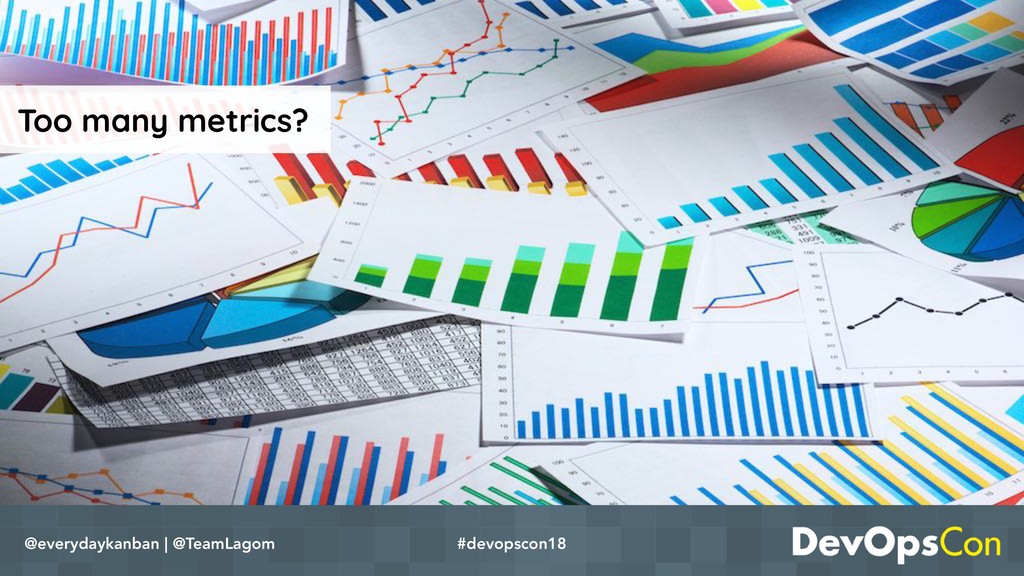
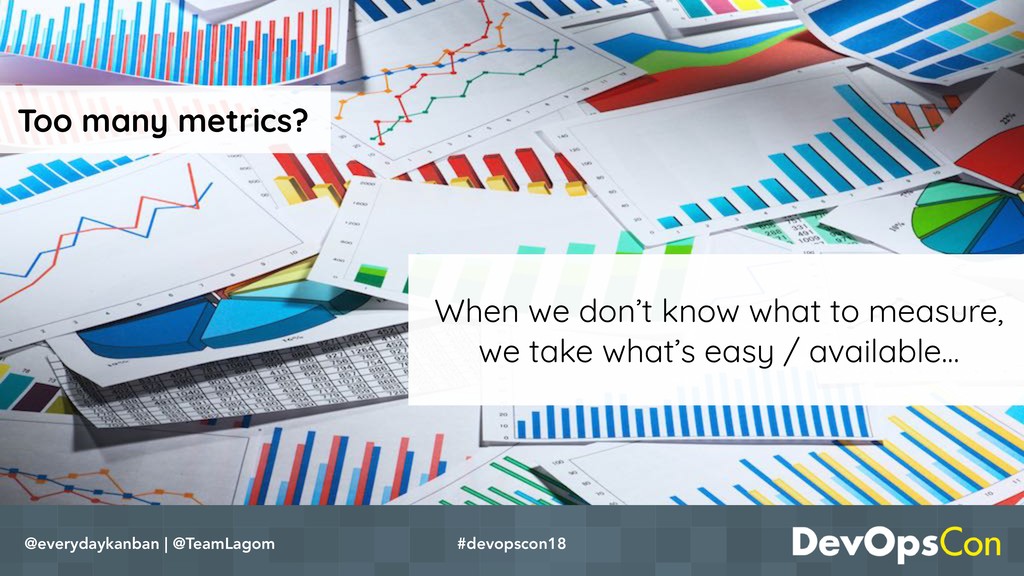
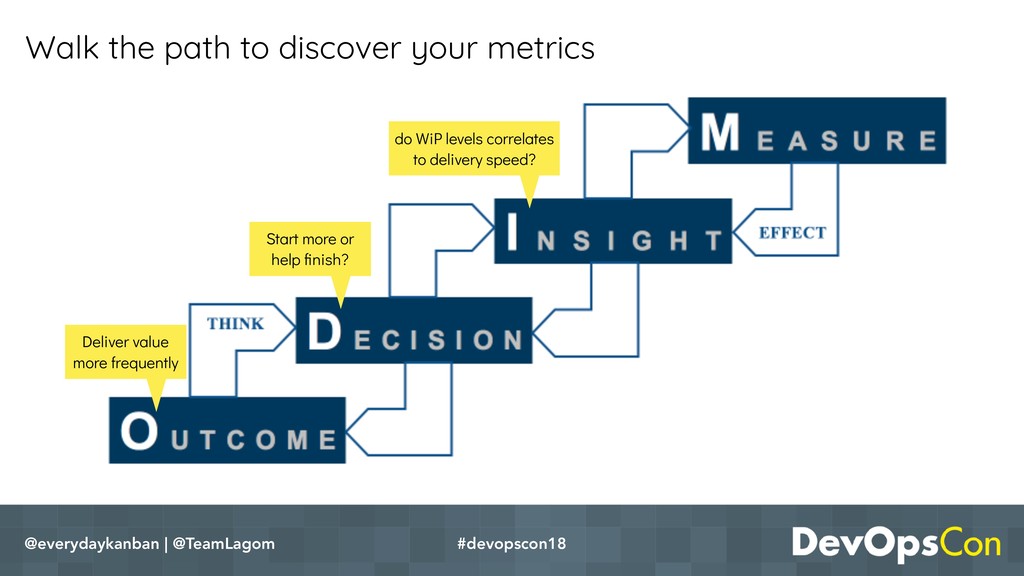
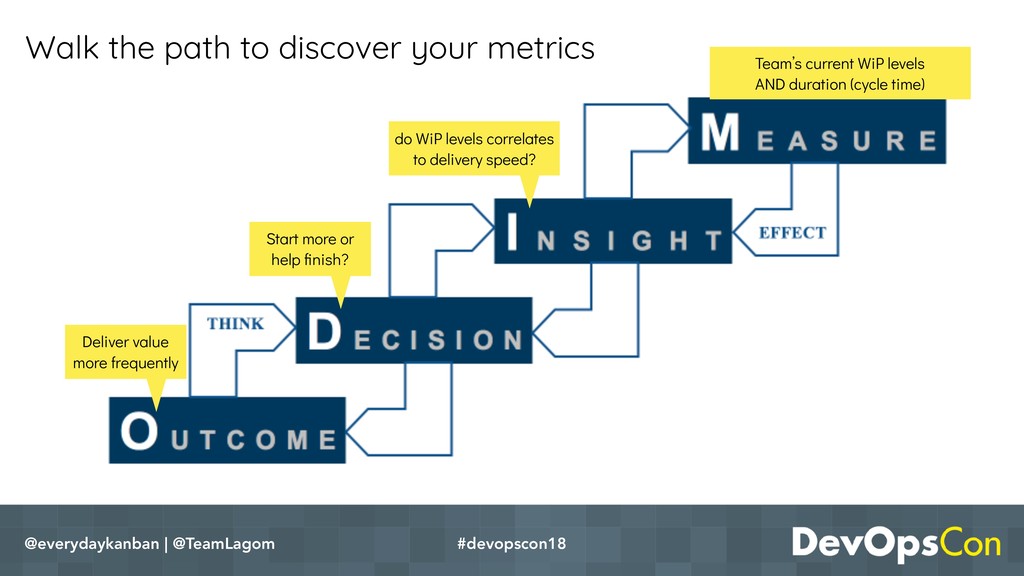
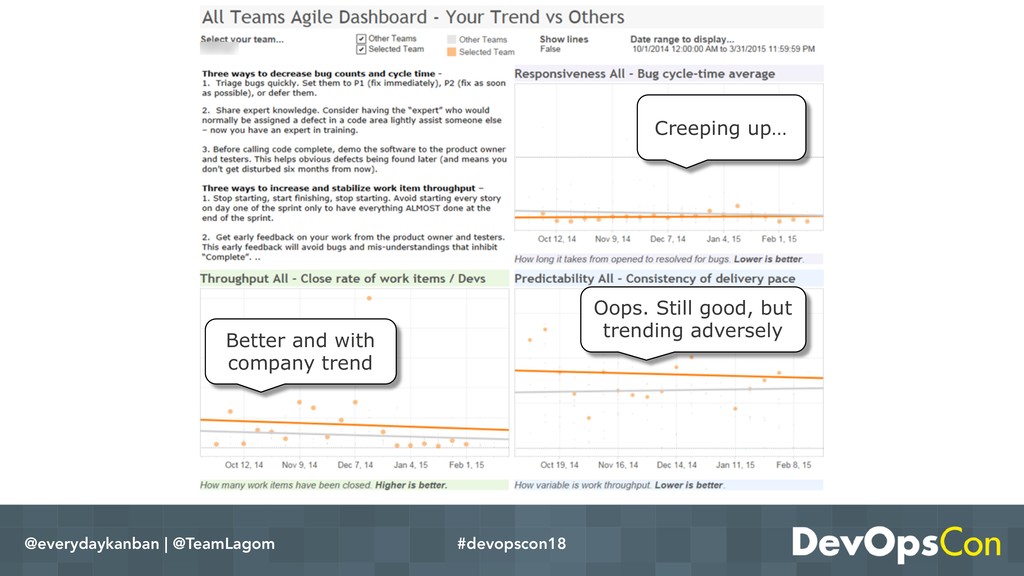
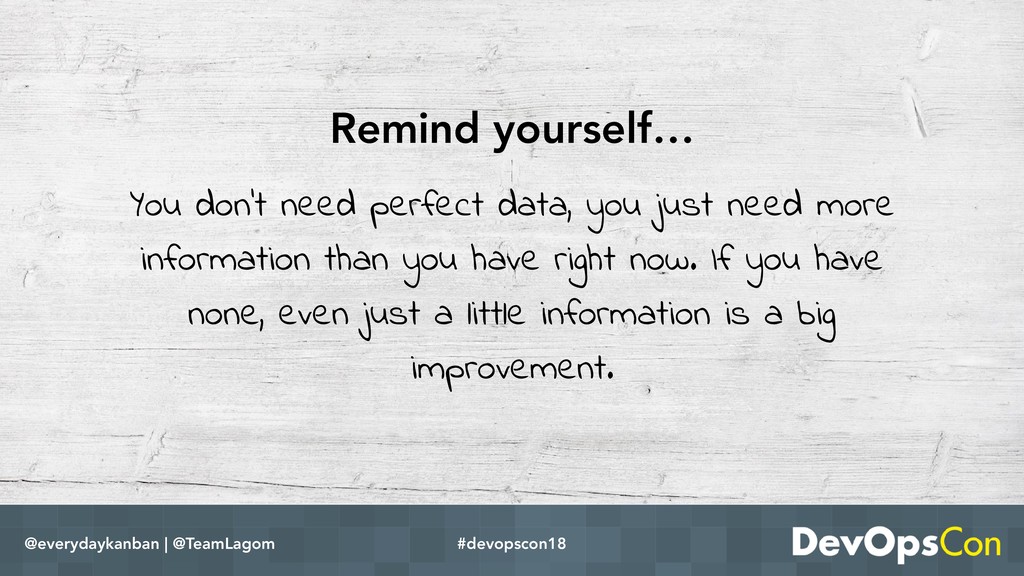
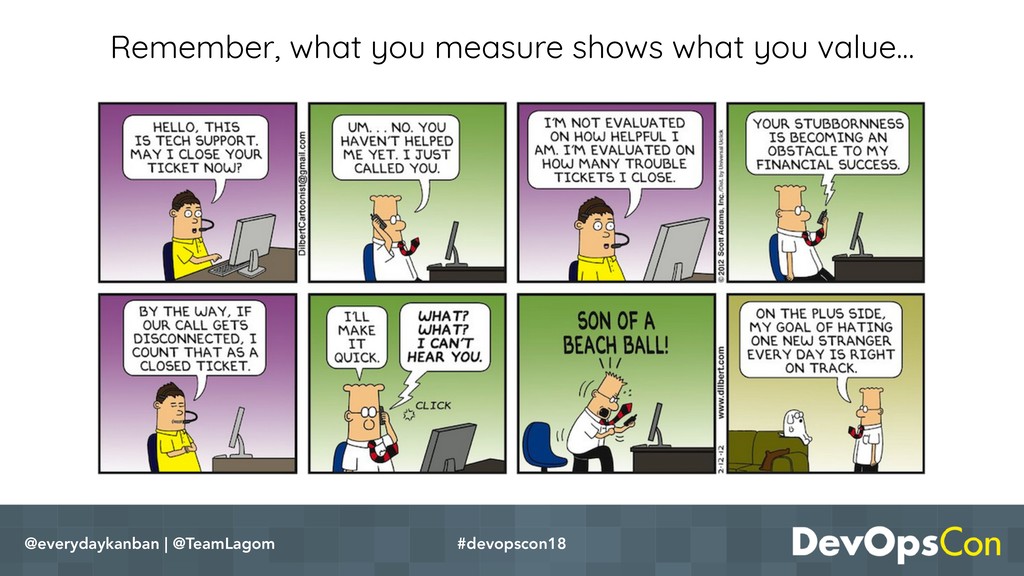
Data-driven decision-making is a goal of most leaders today. Unfortunately, between the overwhelming amounts of data available to us and the ease of falling prey to misleading vanity metrics, how to begin this journey can feel extremely elusive.

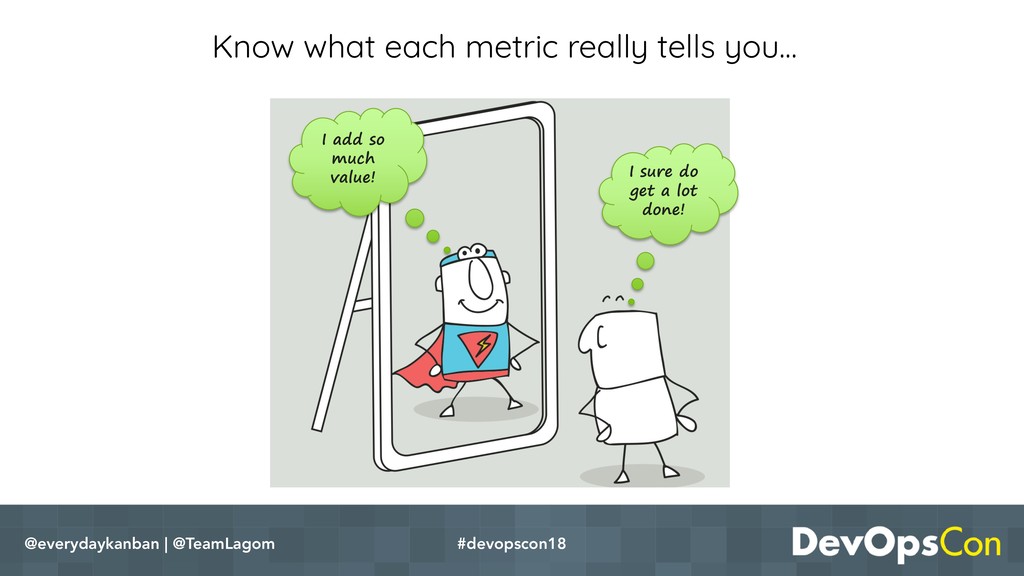
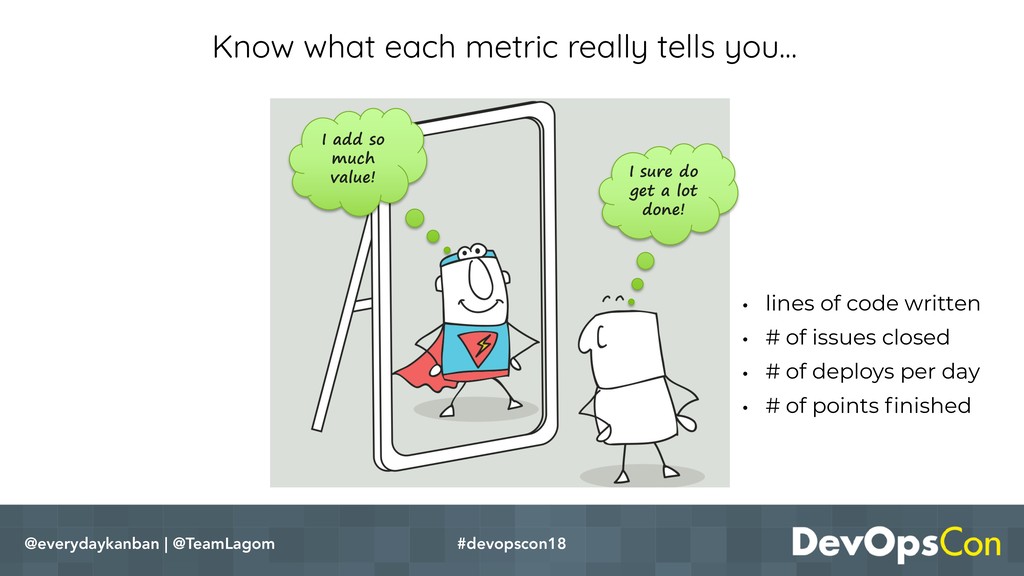
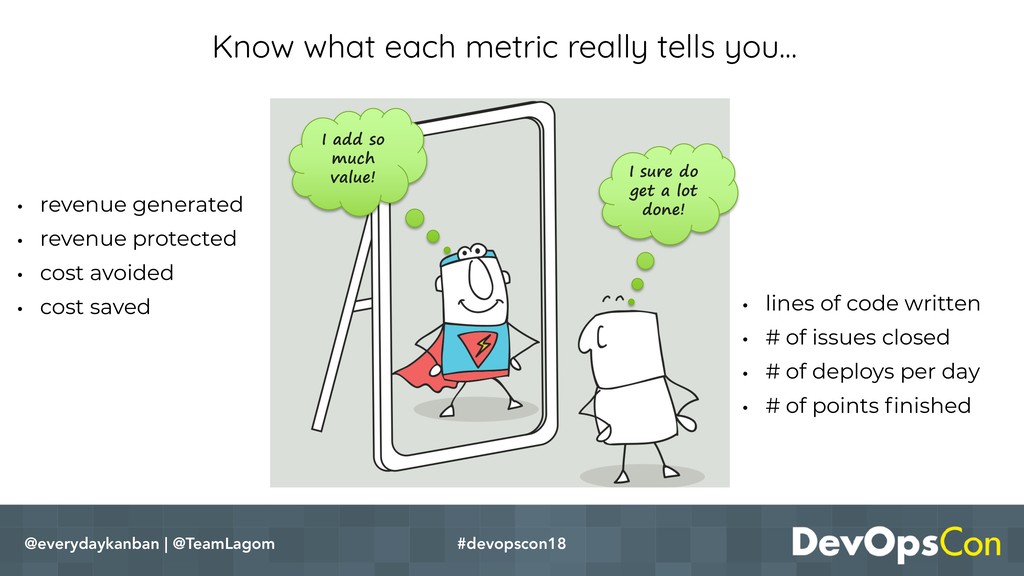
How do we know what’s important enough to measure? How do we get a holistic picture of organizational health? How do we ensure our metrics help us more than they hurt us? There are many important questions to consider before doubling down on your inventory of metrics.

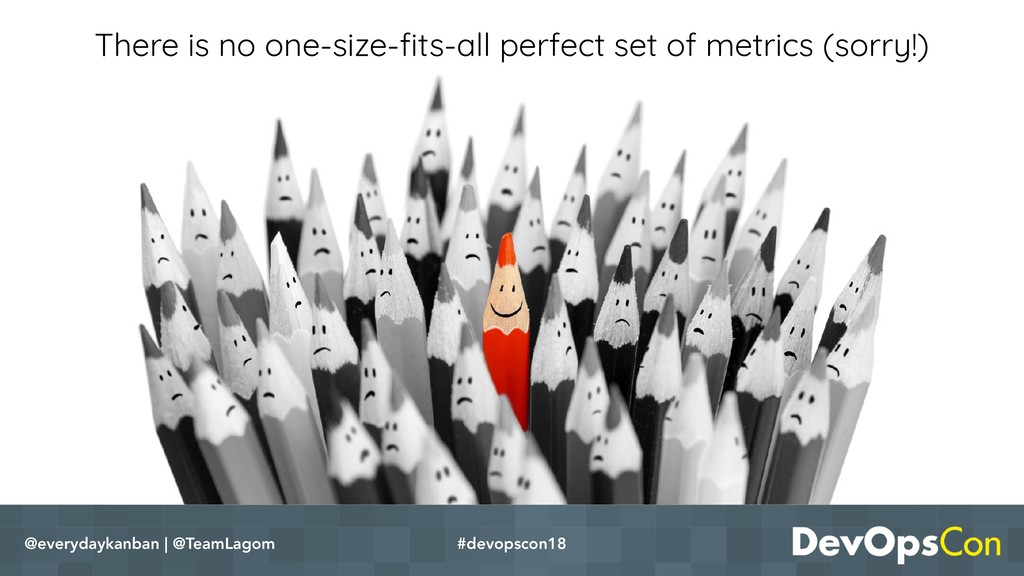
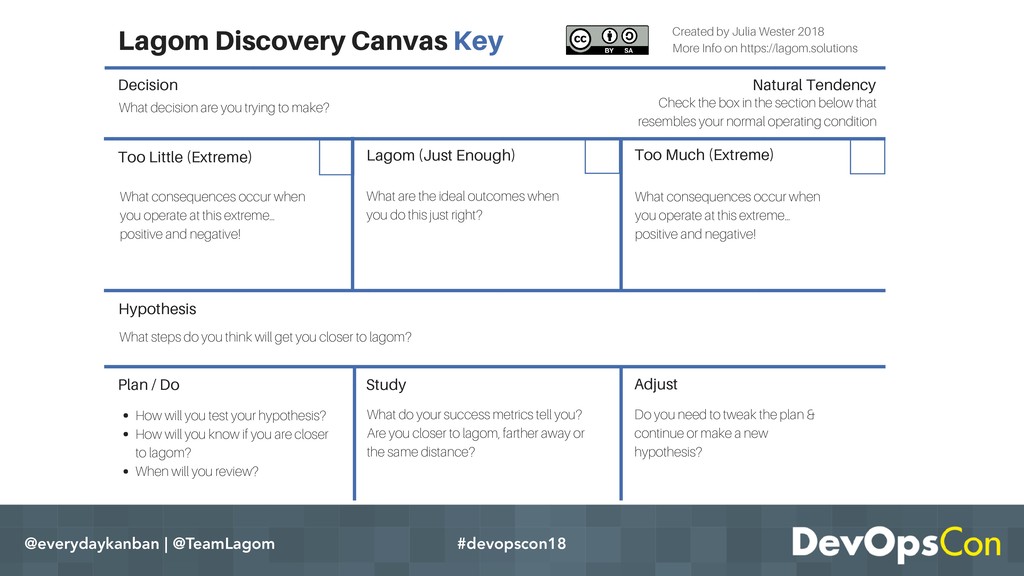
This interactive presentation will help you ensure you:

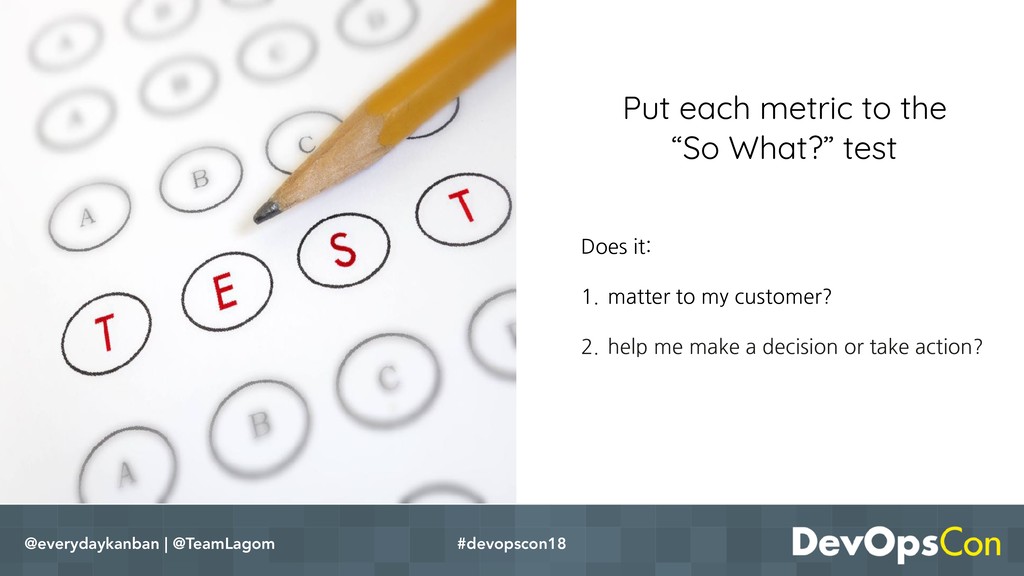
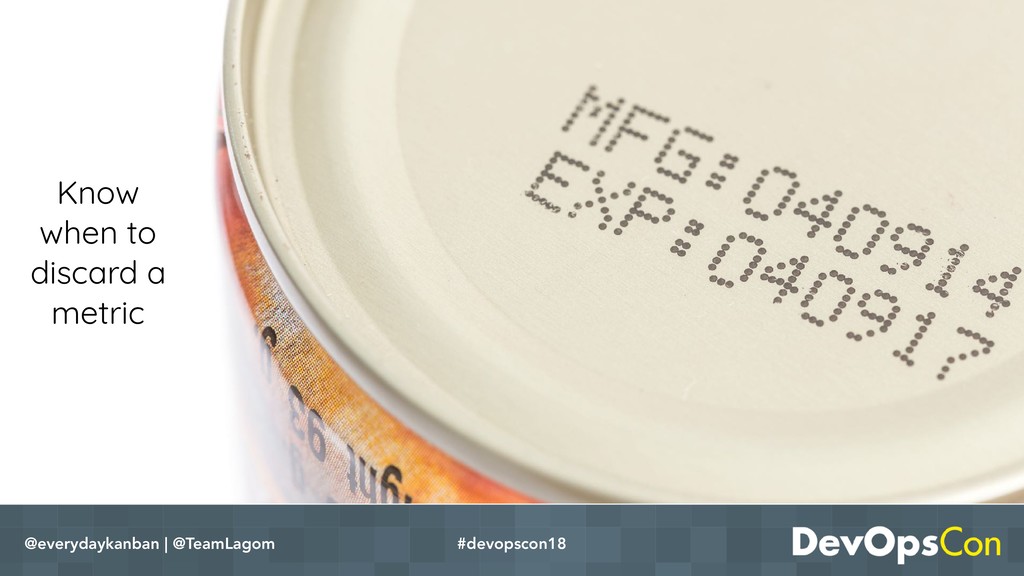
* can map your metrics back to your desired goals.
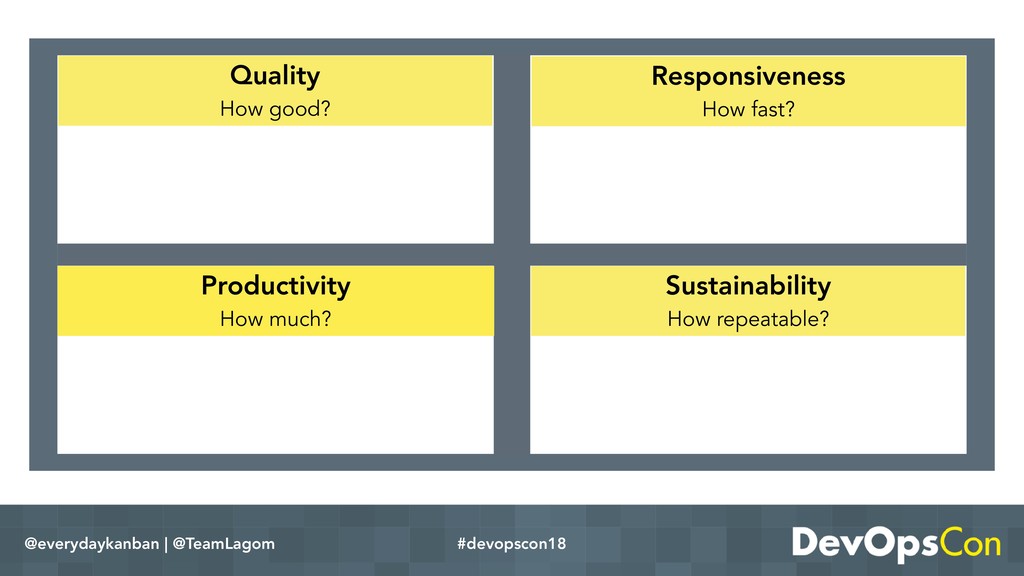
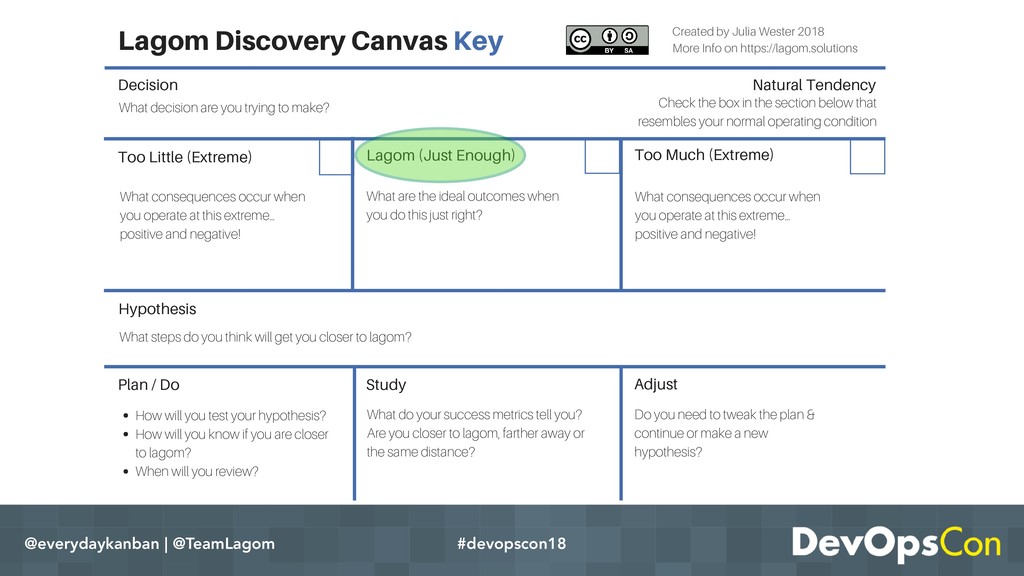
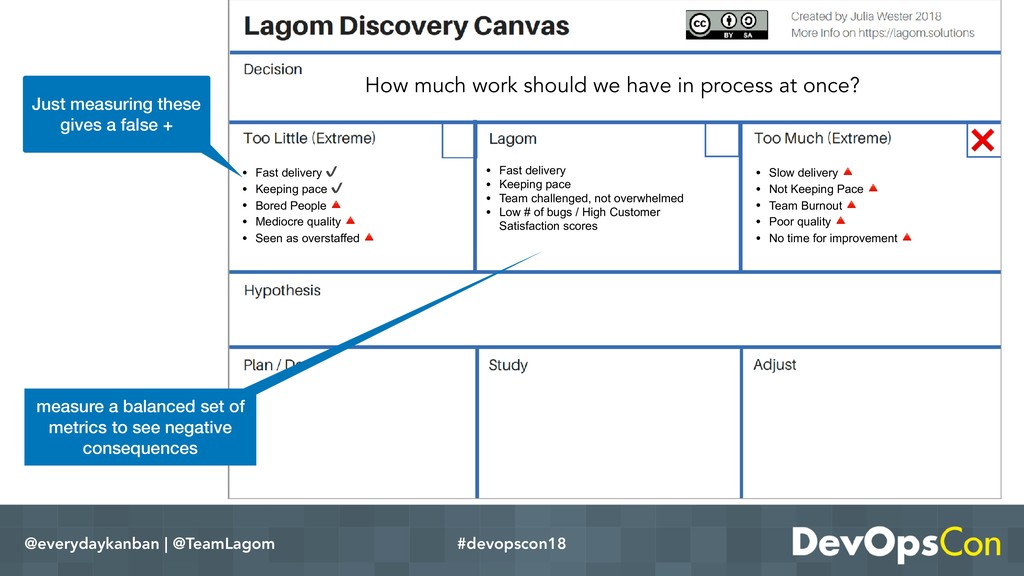
* have a balanced set of metrics to provide a holistic picture of health.
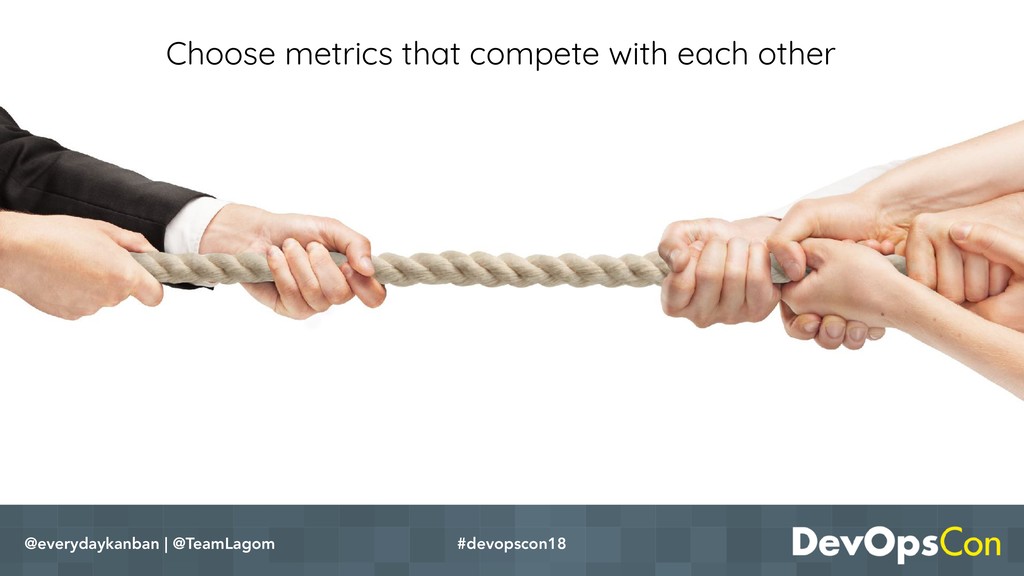
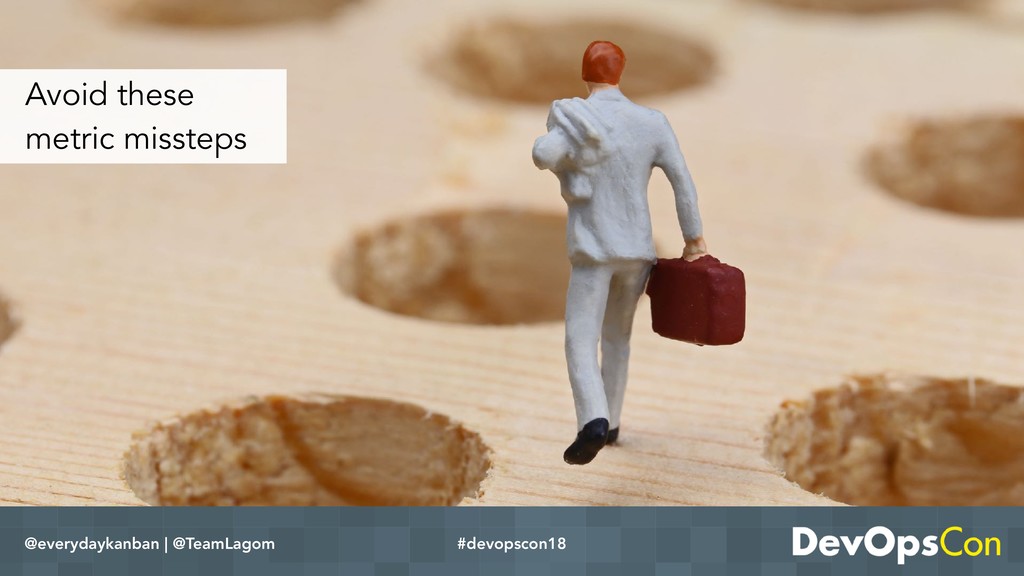
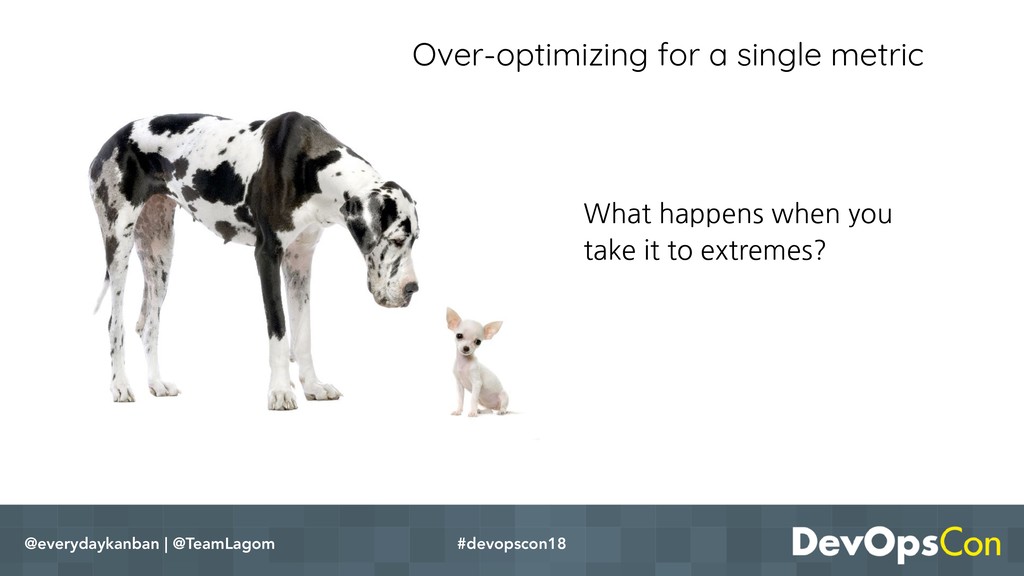
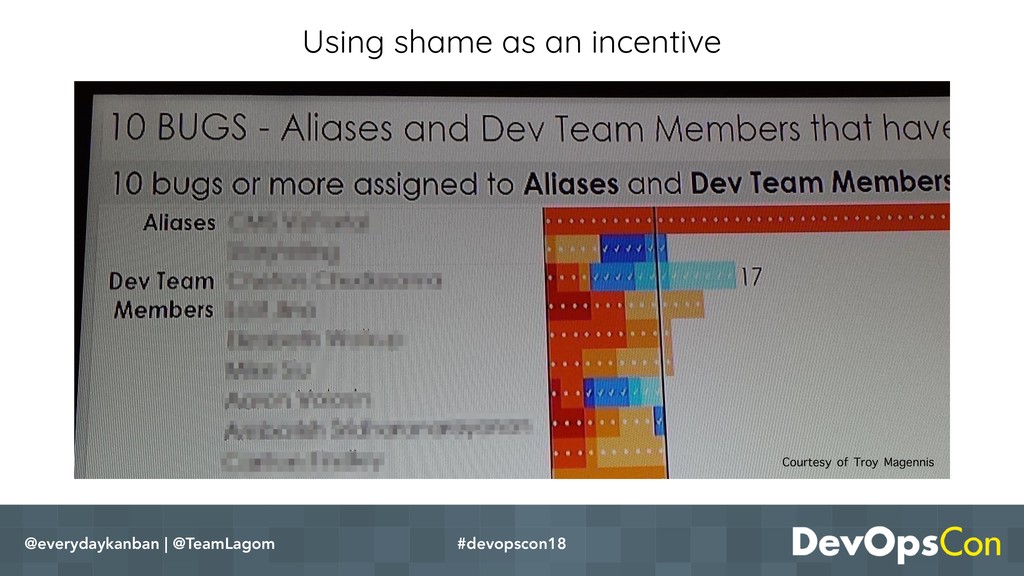
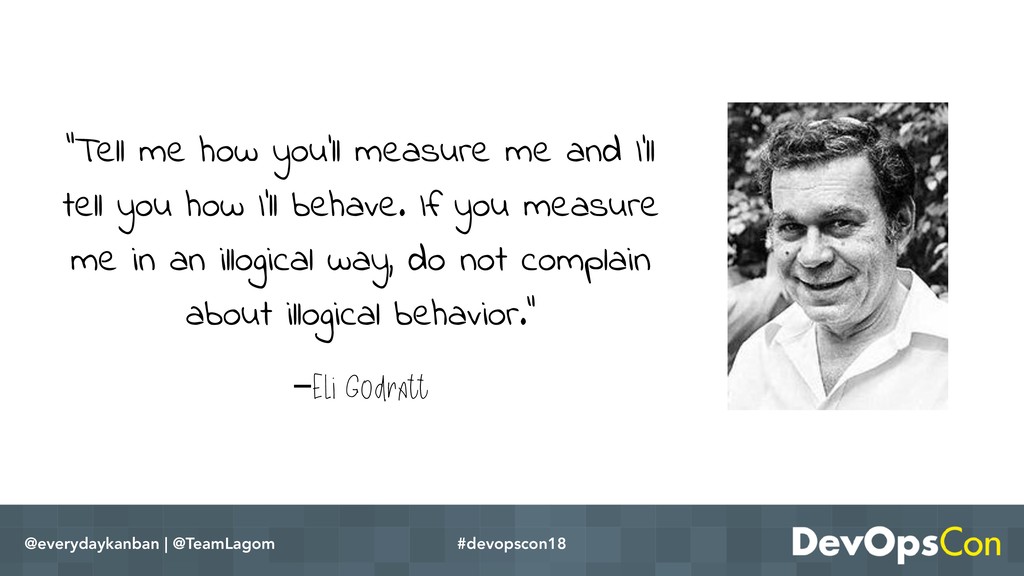
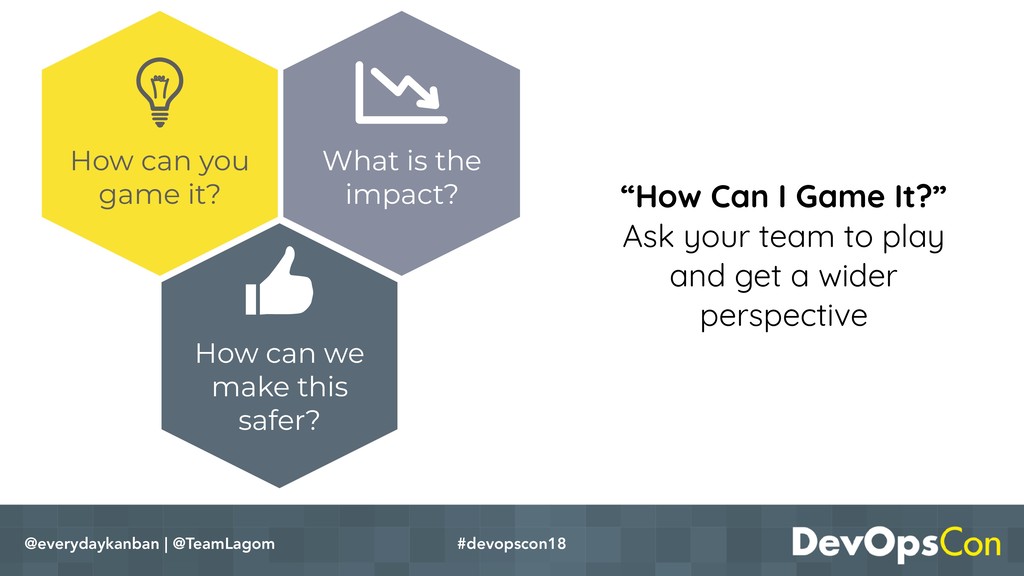
* have calculated the gaming potential of your metrics to ensure the value outweighs the risk.

With these new tools in your arsenal and a better understanding of metrics safety, you can set the stage for smart, data-driven decision-making in your organization.

Julia Wester
PRO

May 29, 2018
Tweet

More Decks by Julia Wester

Other Decks in Business

Transcript

  1. Finding Metrics that Matter
    and Using them Safely
    @everydaykanban | @TeamLagom #devopscon18

    View Slide

  2. @everydaykanban | @TeamLagom #devopscon18
    Too many metrics?

    View Slide

  3. @everydaykanban | @TeamLagom #devopscon18
    Too many metrics?
    When we don’t know what to measure,
    we take what’s easy / available…

    View Slide

  4. There is no one-size-fits-all perfect set of metrics (sorry!)
    @everydaykanban | @TeamLagom #devopscon18

    View Slide

  5. @everydaykanban | @TeamLagom #devopscon18
    …though there
    may be some
    common, good
    baseline metrics

    View Slide

  6. What you measure shows people what you value,
    so take care when choosing your metrics
    @everydaykanban | @TeamLagom #devopscon18

    View Slide

  7. Doing Metrics the “right way”
    @everydaykanban | @TeamLagom #devopscon18
    #winning
    safe
    ^

    View Slide

  8. @everydaykanban | @TeamLagom #devopscon18
    Start with a clear
    outcome in mind

    View Slide

  9. Walk the path to discover your metrics
    @everydaykanban | @TeamLagom #devopscon18

    View Slide

  10. Walk the path to discover your metrics
    @everydaykanban | @TeamLagom
    Deliver value
    more frequently
    #devopscon18

    View Slide

  11. Walk the path to discover your metrics
    @everydaykanban | @TeamLagom
    Deliver value
    more frequently
    Start more or
    help finish?
    #devopscon18

    View Slide

  12. Walk the path to discover your metrics
    @everydaykanban | @TeamLagom
    Deliver value
    more frequently
    Start more or
    help finish?
    do WiP levels correlates
    to delivery speed?
    #devopscon18

    View Slide

  13. Walk the path to discover your metrics
    @everydaykanban | @TeamLagom
    Deliver value
    more frequently
    Start more or
    help finish?
    do WiP levels correlates
    to delivery speed?
    Team’s current WiP levels
    AND duration (cycle time)
    #devopscon18

    View Slide

  14. Know what each metric really tells you…
    @everydaykanban | @TeamLagom #devopscon18
    Fooling
    yourself with
    vanity
    metrics
    everydaykanban
    I sure do
    get a lot
    done!
    I add so
    much
    value!

    View Slide

  15. Know what each metric really tells you…
    @everydaykanban | @TeamLagom #devopscon18
    Fooling
    yourself with
    vanity
    metrics
    everydaykanban
    I sure do
    get a lot
    done!
    I add so
    much
    value!
    • lines of code written
    • # of issues closed
    • # of deploys per day
    • # of points finished

    View Slide

  16. Know what each metric really tells you…
    @everydaykanban | @TeamLagom #devopscon18
    Fooling
    yourself with
    vanity
    metrics
    everydaykanban
    I sure do
    get a lot
    done!
    I add so
    much
    value!
    • lines of code written
    • # of issues closed
    • # of deploys per day
    • # of points finished
    • revenue generated
    • revenue protected
    • cost avoided
    • cost saved

    View Slide

  17. Put each metric to the
    “So What?” test
    #devopscon18
    @everydaykanban | @TeamLagom

    View Slide

  18. Put each metric to the
    “So What?” test
    #devopscon18
    @everydaykanban | @TeamLagom
    Does it:
    1. matter to my customer?
    2. help me make a decision or take action?

    View Slide

  19. Choose metrics that compete with each other
    @everydaykanban | @TeamLagom #devopscon18

    View Slide

  20. @everydaykanban | @TeamLagom #devopscon18
    Quality
    How good?
    Responsiveness
    How fast?
    Sustainability
    How repeatable?
    Productivity
    How much?

    View Slide

  21. Quality: Issues by Application / Service over time
    @everydaykanban | @TeamLagom #devopscon18
    0
    25
    50
    75
    100
    Sys A Sys B Sys C Sys D
    Q4 2017 Q1 2018 Q2 2018
    Find your problem apps and focus
    improvement efforts there…

    View Slide

  22. Quality: Customer Satisfaction
    @everydaykanban | @TeamLagom #devopscon18
    0
    25
    50
    75
    100
    Jan Feb Mar Apr May
    Phone Website
    Measure it however you can,
    even if its qualitative…

    View Slide

  23. Responsiveness: Duration (Cycle Time)
    @everydaykanban | @TeamLagom #devopscon18
    Can you see different patterns for
    different types of work?

    View Slide

  24. Responsiveness: Mean Time to Recovery (MTTR)
    @everydaykanban | @TeamLagom #devopscon18
    Not all outages are created equal

    View Slide

  25. Productivity: Throughput
    @everydaykanban | @TeamLagom #devopscon18
    Gold star if you show how much
    value the items generate!

    View Slide

  26. Productivity: Deployment Frequency
    @everydaykanban | @TeamLagom #devopscon18
    Gold star if you show how much
    value the deploys generate!

    View Slide

  27. Sustainability: Open vs Closed
    @everydaykanban | @TeamLagom #devopscon18
    Are we keeping pace with
    demand?

    View Slide

  28. Sustainability: Team Satisfaction
    @everydaykanban | @TeamLagom #devopscon18
    Would you recommend people
    to work here?

    View Slide

  29. @everydaykanban | @TeamLagom #devopscon18
    0
    25
    50
    75
    100
    Sys A Sys B Sys C Sys D
    Q4 2017 Q1 2018 Q2 2018
    Incidents by System MTTR
    Throughput Open vs Closed

    View Slide

  30. Improvement: Flow Efficiency
    @everydaykanban | @TeamLagom #devopscon18
    The best metric you’re not using!
    Lead Time
    Wait Wait Wait
    Work Work
    Work
    http://www.everydaykanban.com/2016/09/25/flow-efficiency/

    View Slide

  31. @everydaykanban | @TeamLagom #devopscon18
    It’s all 3 ways of DevOps
    rolled up into one metric!
    Improvement: Flow Efficiency

    View Slide

  32. @everydaykanban | @TeamLagom #devopscon18

    View Slide

  33. @everydaykanban | @TeamLagom #devopscon18
    Better and with
    company trend
    Oops. Still good, but
    trending adversely
    Creeping up…

    View Slide

  34. You don’t need perfect data, you just need more
    information than you have right now. If you have
    none, even just a little information is a big
    improvement.
    @everydaykanban | @TeamLagom #devopscon18
    Remind yourself…

    View Slide

  35. @everydaykanban | @TeamLagom #devopscon18
    Avoid these
    metric missteps

    View Slide

  36. #devopscon18
    Over-optimizing for a single metric
    @everydaykanban | @TeamLagom
    What happens when you
    take it to extremes?

    View Slide

  37. @everydaykanban | @TeamLagom #devopscon18

    View Slide

  38. @everydaykanban | @TeamLagom #devopscon18

    View Slide

  39. @everydaykanban | @TeamLagom #devopscon18

    View Slide

  40. @everydaykanban | @TeamLagom #devopscon18
    Created by Julia Wester 2018
    More Info on https://lagom.solutions
    Lagom Discovery Canvas Key
    Decision
    Hypothesis
    Plan / Do Study Adjust
    Lagom (Just Enough) Too Much (Extreme)
    Too Little (Extreme)
    What decision are you trying to make?
    What steps do you think will get you closer to lagom?
    What consequences occur when
    you operate at this extreme…
    positive and negative!
    How will you test your hypothesis?
    How will you know if you are closer
    to lagom?
    When will you review?
    What do your success metrics tell you?
    Are you closer to lagom, farther away or
    the same distance?
    Do you need to tweak the plan &
    continue or make a new
    hypothesis?
    What consequences occur when
    you operate at this extreme…
    positive and negative!
    What are the ideal outcomes when
    you do this just right?
    Natural Tendency
    Check the box in the section below that
    resembles your normal operating condition

    View Slide

  41. @everydaykanban | @TeamLagom #devopscon18
    Created by Julia Wester 2018
    More Info on https://lagom.solutions
    Lagom Discovery Canvas Key
    Decision
    Hypothesis
    Plan / Do Study Adjust
    Lagom (Just Enough) Too Much (Extreme)
    Too Little (Extreme)
    What decision are you trying to make?
    What steps do you think will get you closer to lagom?
    What consequences occur when
    you operate at this extreme…
    positive and negative!
    How will you test your hypothesis?
    How will you know if you are closer
    to lagom?
    When will you review?
    What do your success metrics tell you?
    Are you closer to lagom, farther away or
    the same distance?
    Do you need to tweak the plan &
    continue or make a new
    hypothesis?
    What consequences occur when
    you operate at this extreme…
    positive and negative!
    What are the ideal outcomes when
    you do this just right?
    Natural Tendency
    Check the box in the section below that
    resembles your normal operating condition

    View Slide

  42. @everydaykanban | @TeamLagom #devopscon18
    Created by Julia Wester 2018
    More Info on https://lagom.solutions
    Lagom Discovery Canvas Key
    Decision
    Hypothesis
    Plan / Do Study Adjust
    Lagom (Just Enough) Too Much (Extreme)
    Too Little (Extreme)
    What decision are you trying to make?
    What steps do you think will get you closer to lagom?
    What consequences occur when
    you operate at this extreme…
    positive and negative!
    How will you test your hypothesis?
    How will you know if you are closer
    to lagom?
    When will you review?
    What do your success metrics tell you?
    Are you closer to lagom, farther away or
    the same distance?
    Do you need to tweak the plan &
    continue or make a new
    hypothesis?
    What consequences occur when
    you operate at this extreme…
    positive and negative!
    What are the ideal outcomes when
    you do this just right?
    Natural Tendency
    Check the box in the section below that
    resembles your normal operating condition

    View Slide

  43. @everydaykanban | @TeamLagom #devopscon18
    • Fast delivery
    • Keeping pace
    • Team challenged, not overwhelmed
    • Low # of bugs / High Customer
    Satisfaction scores
    • Fast delivery ✔
    • Keeping pace ✔
    • Bored People
    • Mediocre quality
    • Seen as overstaffed
    • Slow delivery
    • Not Keeping Pace
    • Team Burnout
    • Poor quality
    • No time for improvement
    How much work should we have in process at once?

    Just measuring these
    gives a false +
    measure a balanced set of
    metrics to see negative
    consequences

    View Slide

  44. Measuring Individuals when you value Team outcomes
    @everydaykanban | @TeamLagom #devopscon18

    View Slide

  45. #devopscon18
    Superstars aren’t always
    the best team members
    @everydaykanban | @TeamLagom

    View Slide

  46. Using shame as an incentive
    @everydaykanban | @TeamLagom #devopscon18
    Courtesy of Troy Magennis

    View Slide

  47. “Fear invites wrong
    figures. Bearers of bad
    news fare badly. To
    keep his job, anyone
    may present to his boss
    only good news.”
    –W. Edwards Deming
    #devopscon18
    @everydaykanban | @TeamLagom

    View Slide

  48. Blindly pursuing targets
    @everydaykanban | @TeamLagom #devopscon18
    95%

    View Slide

  49. –W. Edwards Deming
    “If you give a manager a numerical target,
    he’ll make it, even if he has to destroy the
    organization in the process.”
    @everydaykanban | @TeamLagom #devopscon18

    View Slide

  50. To get ahead of these
    issues, intentionally
    explore the dark side of
    metrics
    @everydaykanban | @TeamLagom #devopscon18
    I’m just misunderstood!

    View Slide

  51. @everydaykanban | @TeamLagom #devopscon18
    Remember, what you measure shows what you value…

    View Slide

  52. –Eli Godratt
    “Tell me how you’ll measure me and I’ll
    tell you how I’ll behave. If you measure
    me in an illogical way, do not complain
    about illogical behavior.”
    @everydaykanban | @TeamLagom #devopscon18

    View Slide

  53. Know
    when to
    discard a
    metric
    @everydaykanban | @TeamLagom #devopscon18

    View Slide

  54. #devopscon18
    How can we
    make this
    safer?
    What is the
    impact?
    How can you
    game it? “How Can I Game It?”
    Ask your team to play
    and get a wider
    perspective
    @everydaykanban | @TeamLagom

    View Slide

  55. @everydaykanban | @TeamLagom #devopscon18

    View Slide

  56. @everydaykanban | @TeamLagom #devopscon18
    What will you do differently
    on Monday?

    View Slide

  57. Do you have any metric tips to share?
    Any questions?
    @everydaykanban | @TeamLagom #devopscon18

    View Slide

  58. @everydaykanban | @TeamLagom #devopscon18
    [email protected]
    @everydaykanban & @TeamLagom
    https://lagom.solutions
    http://everydaykanban.com
    https://www.linkedin.com/in/juliawester/
    Contact me to talk more

    View Slide