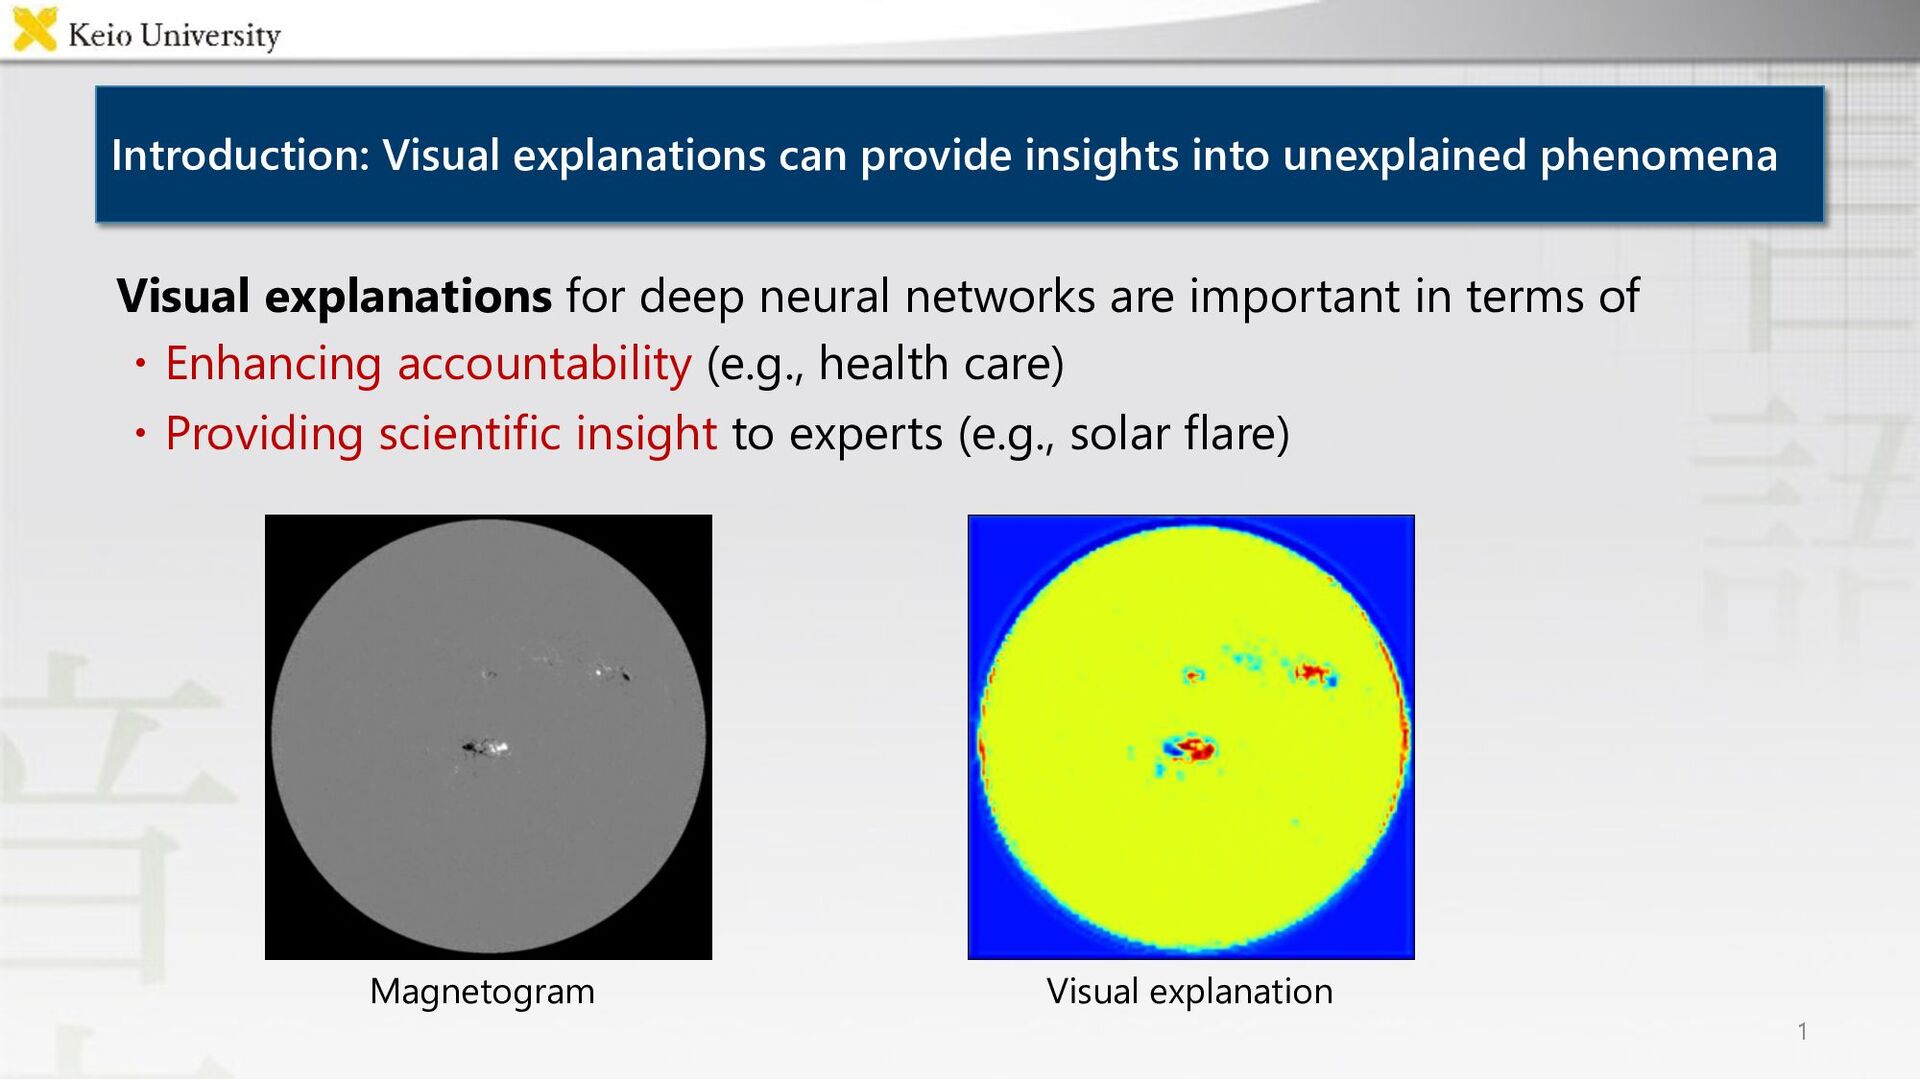
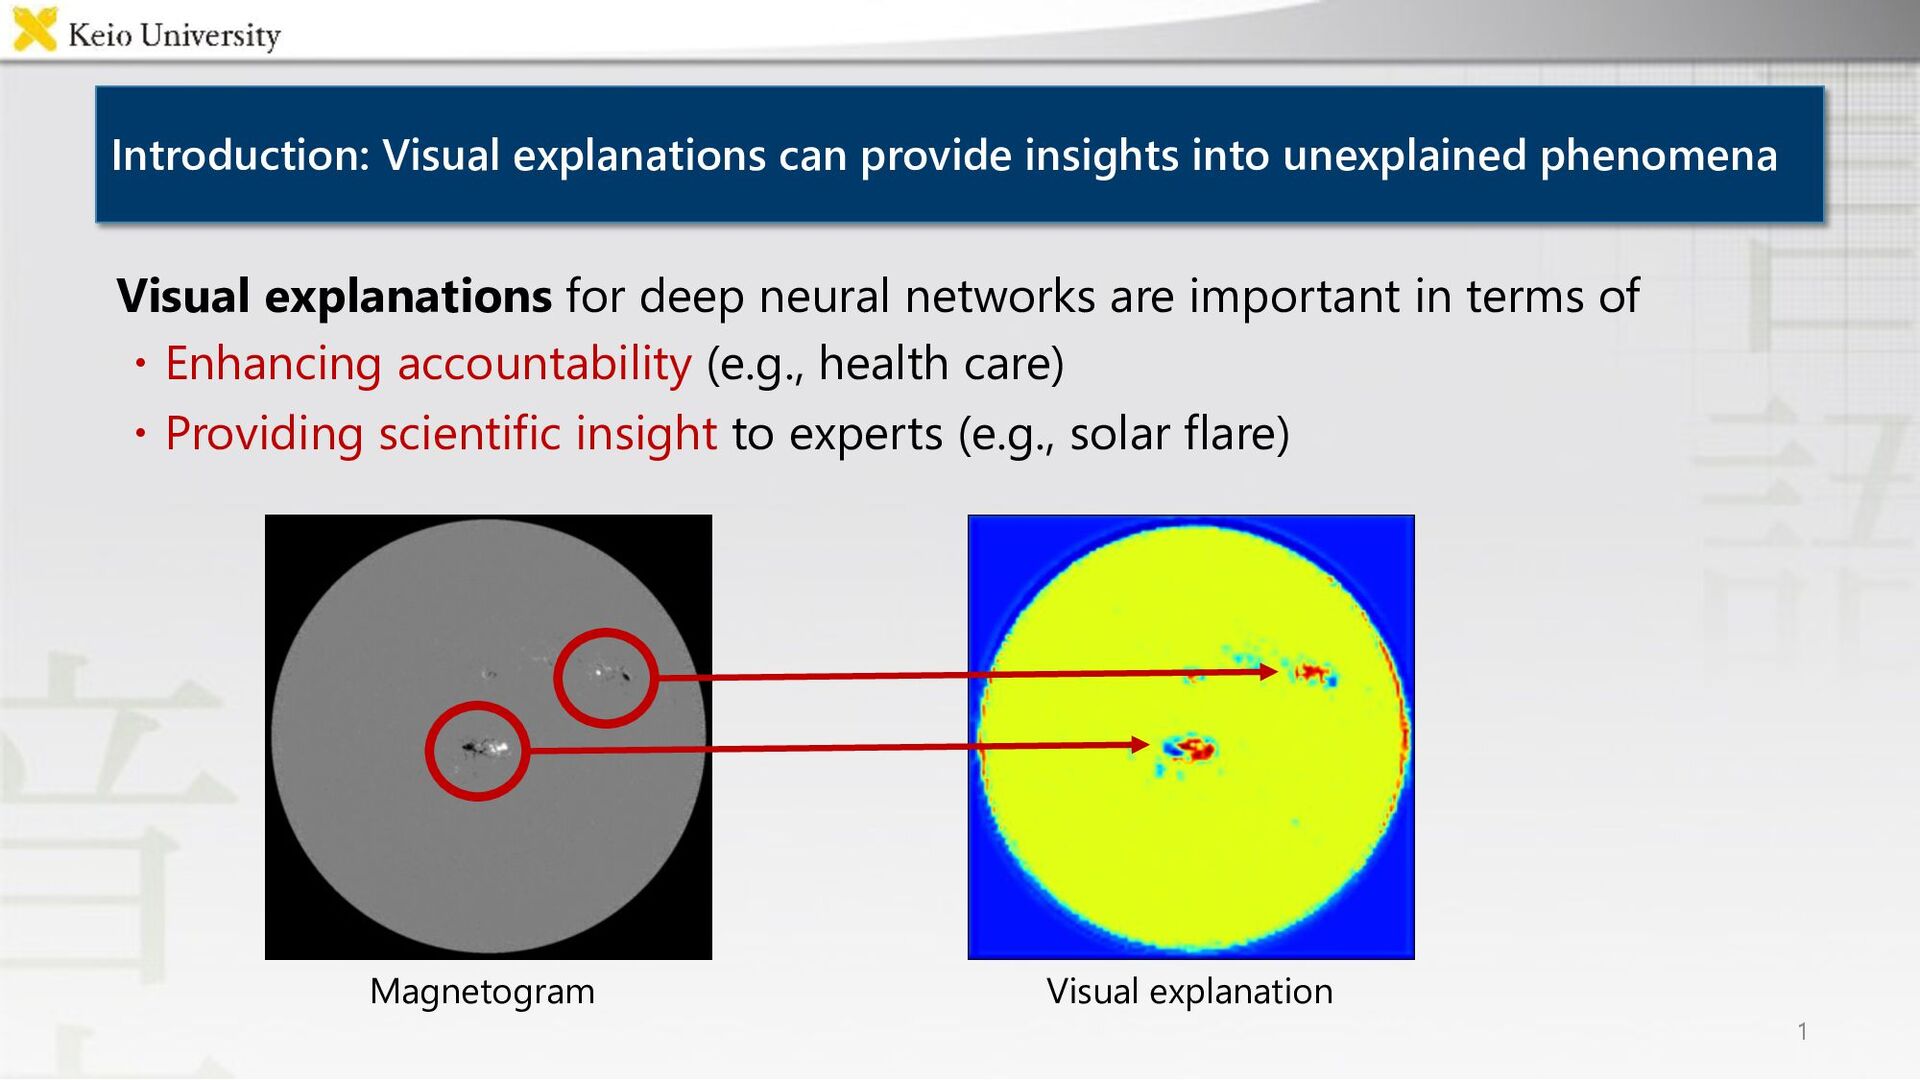
terms of ・Enhancing accountability (e.g., health care) ・Providing scientific insight to experts (e.g., solar flare) 1 Magnetogram Visual explanation Introduction: Visual explanations can provide insights into unexplained phenomena
terms of ・Enhancing accountability (e.g., health care) ・Providing scientific insight to experts (e.g., solar flare) 1 Magnetogram Visual explanation Introduction: Visual explanations can provide insights into unexplained phenomena
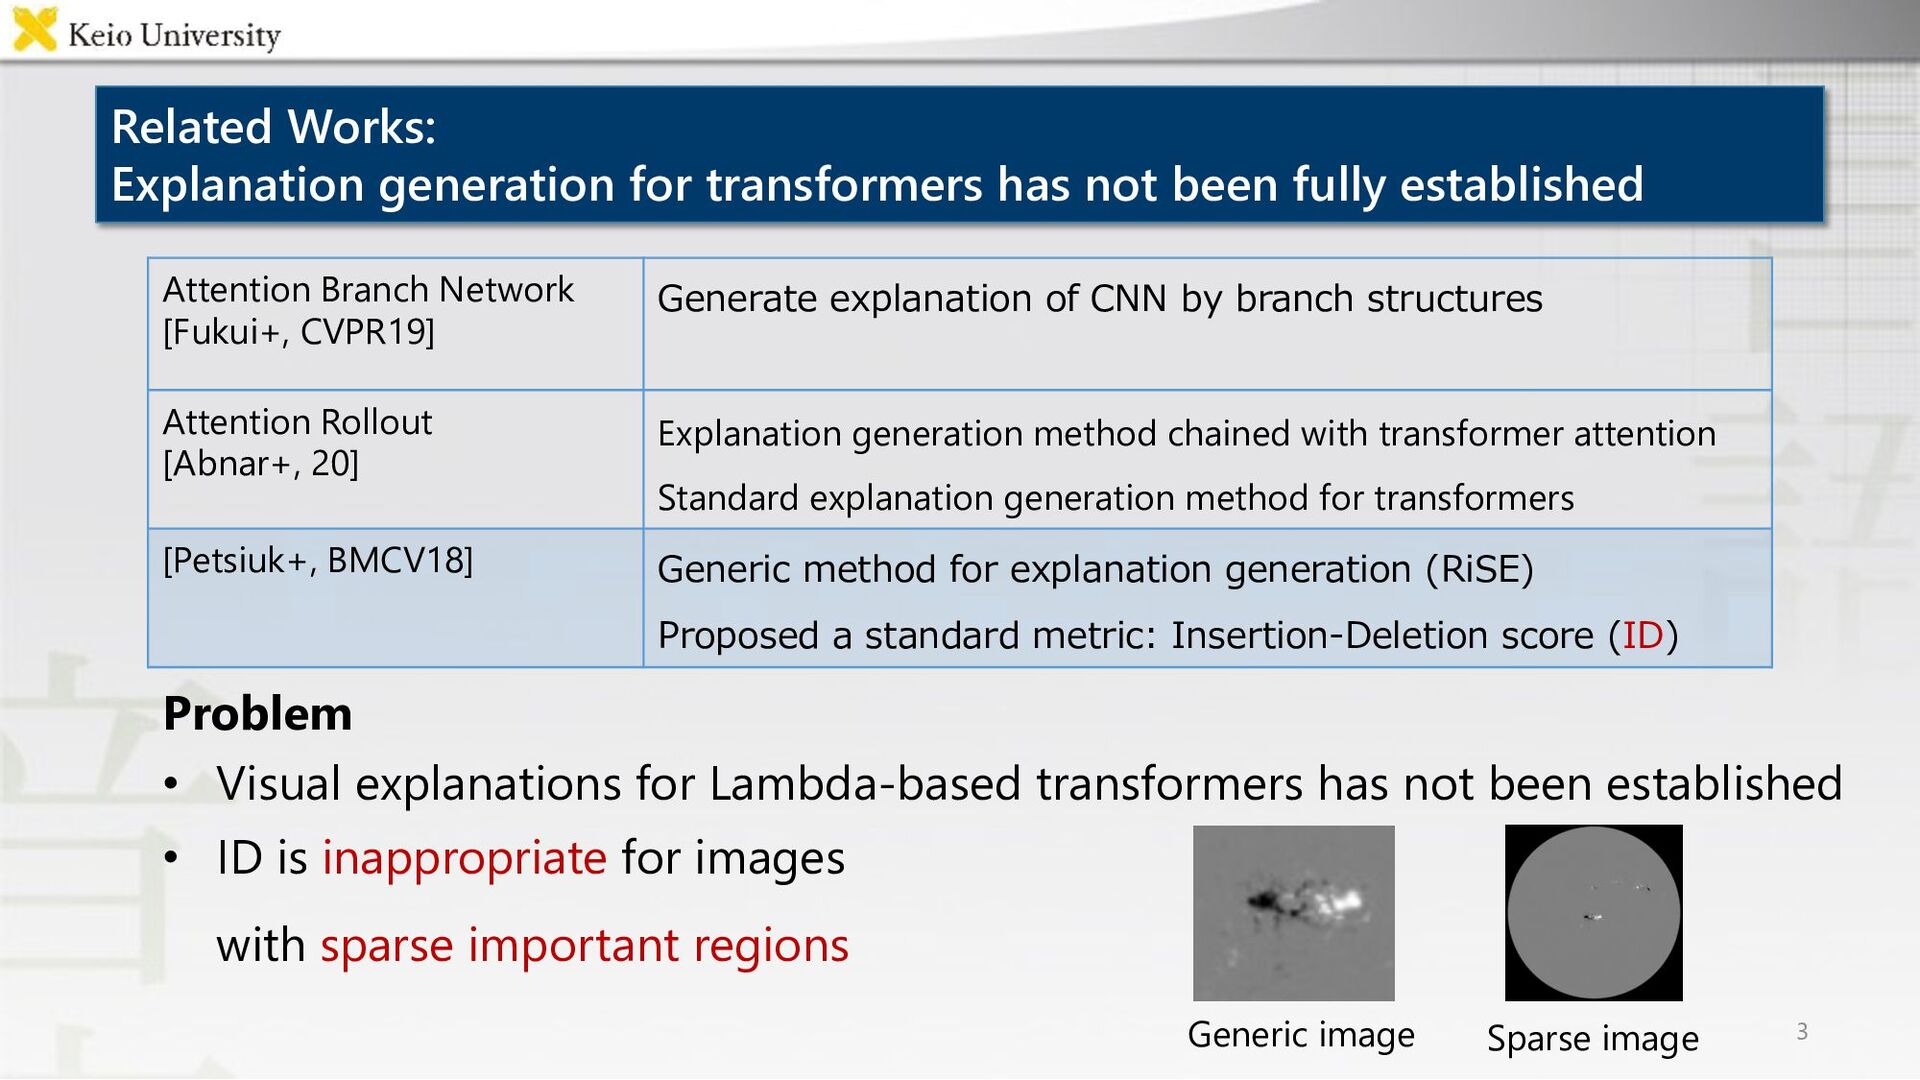
established 3 Attention Branch Network [Fukui+, CVPR19] Generate explanation of CNN by branch structures Attention Rollout [Abnar+, 20] Explanation generation method chained with transformer attention Standard explanation generation method for transformers [Petsiuk+, BMCV18] Generic method for explanation generation (RiSE) Proposed a standard metric: Insertion-Deletion score (ID) Problem • Visual explanations for Lambda-based transformers has not been established • ID is inappropriate for images with sparse important regions Generic image Sparse image
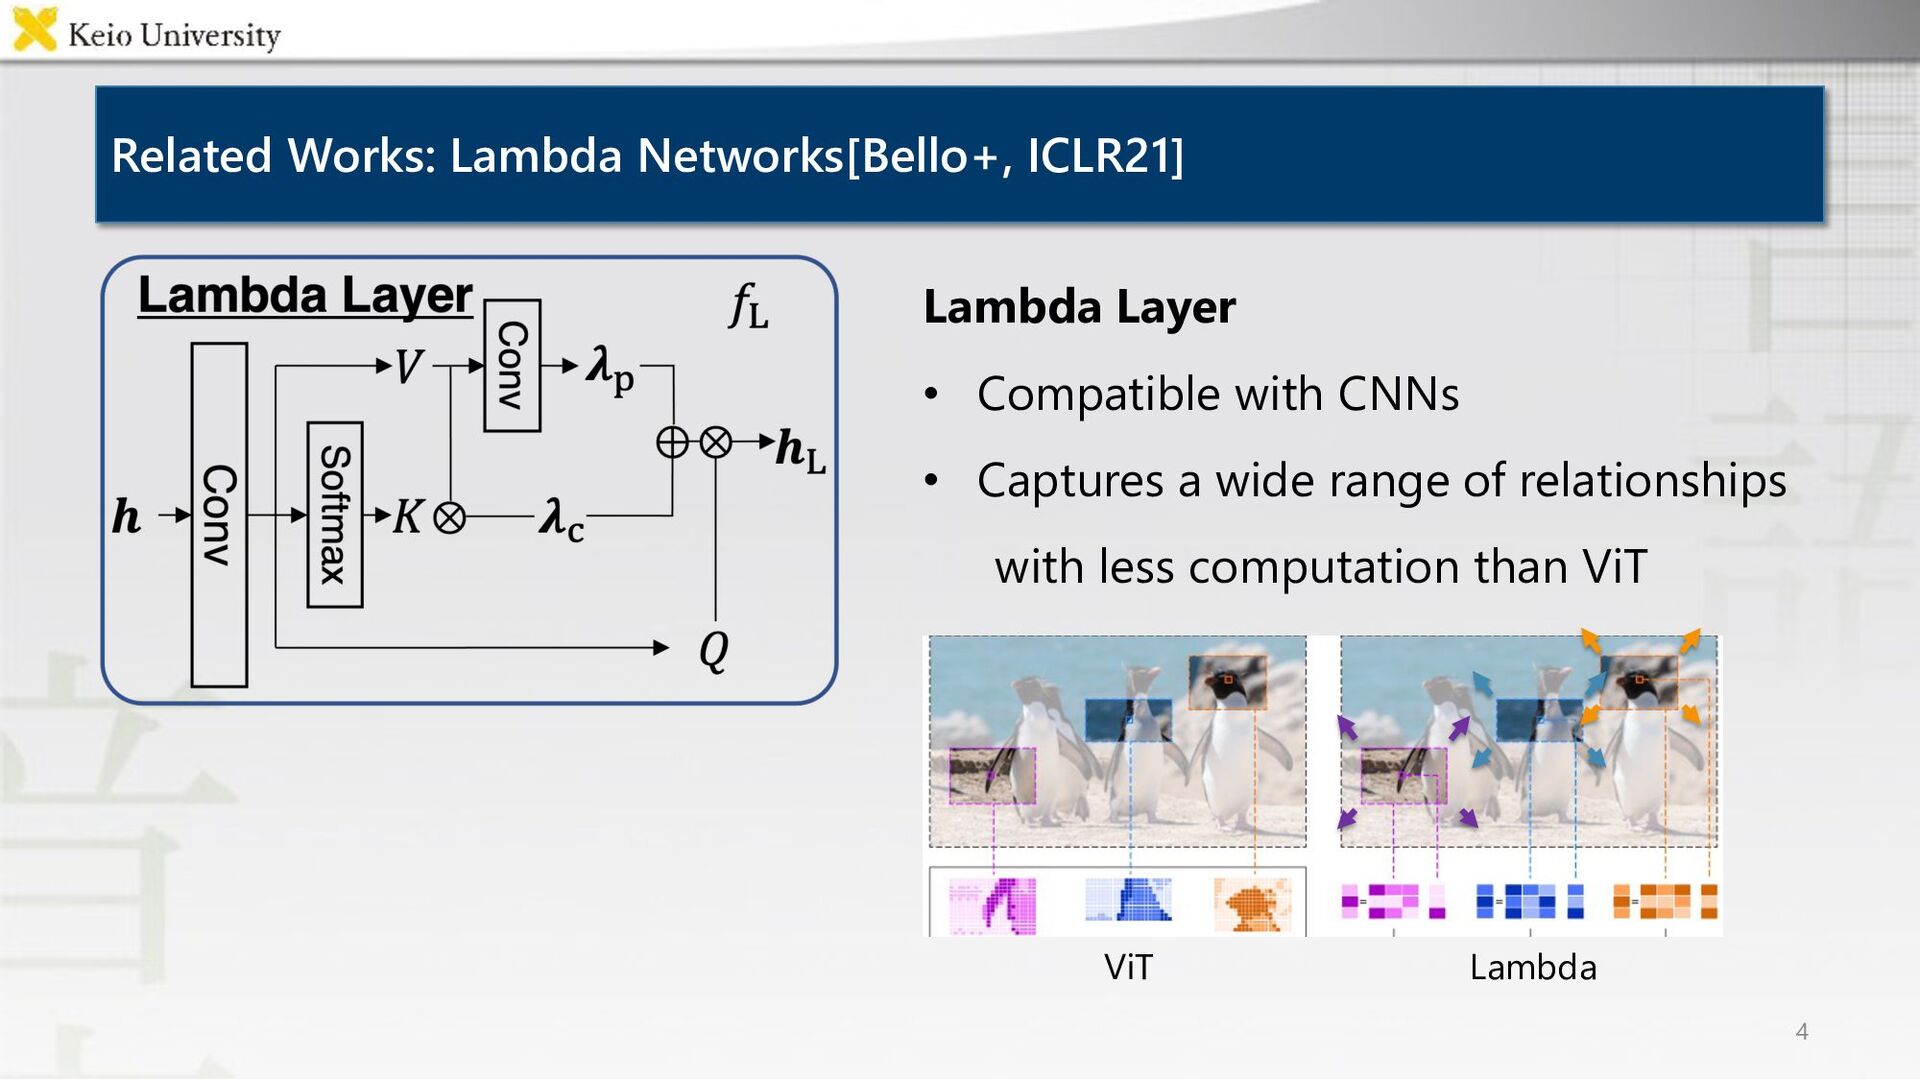
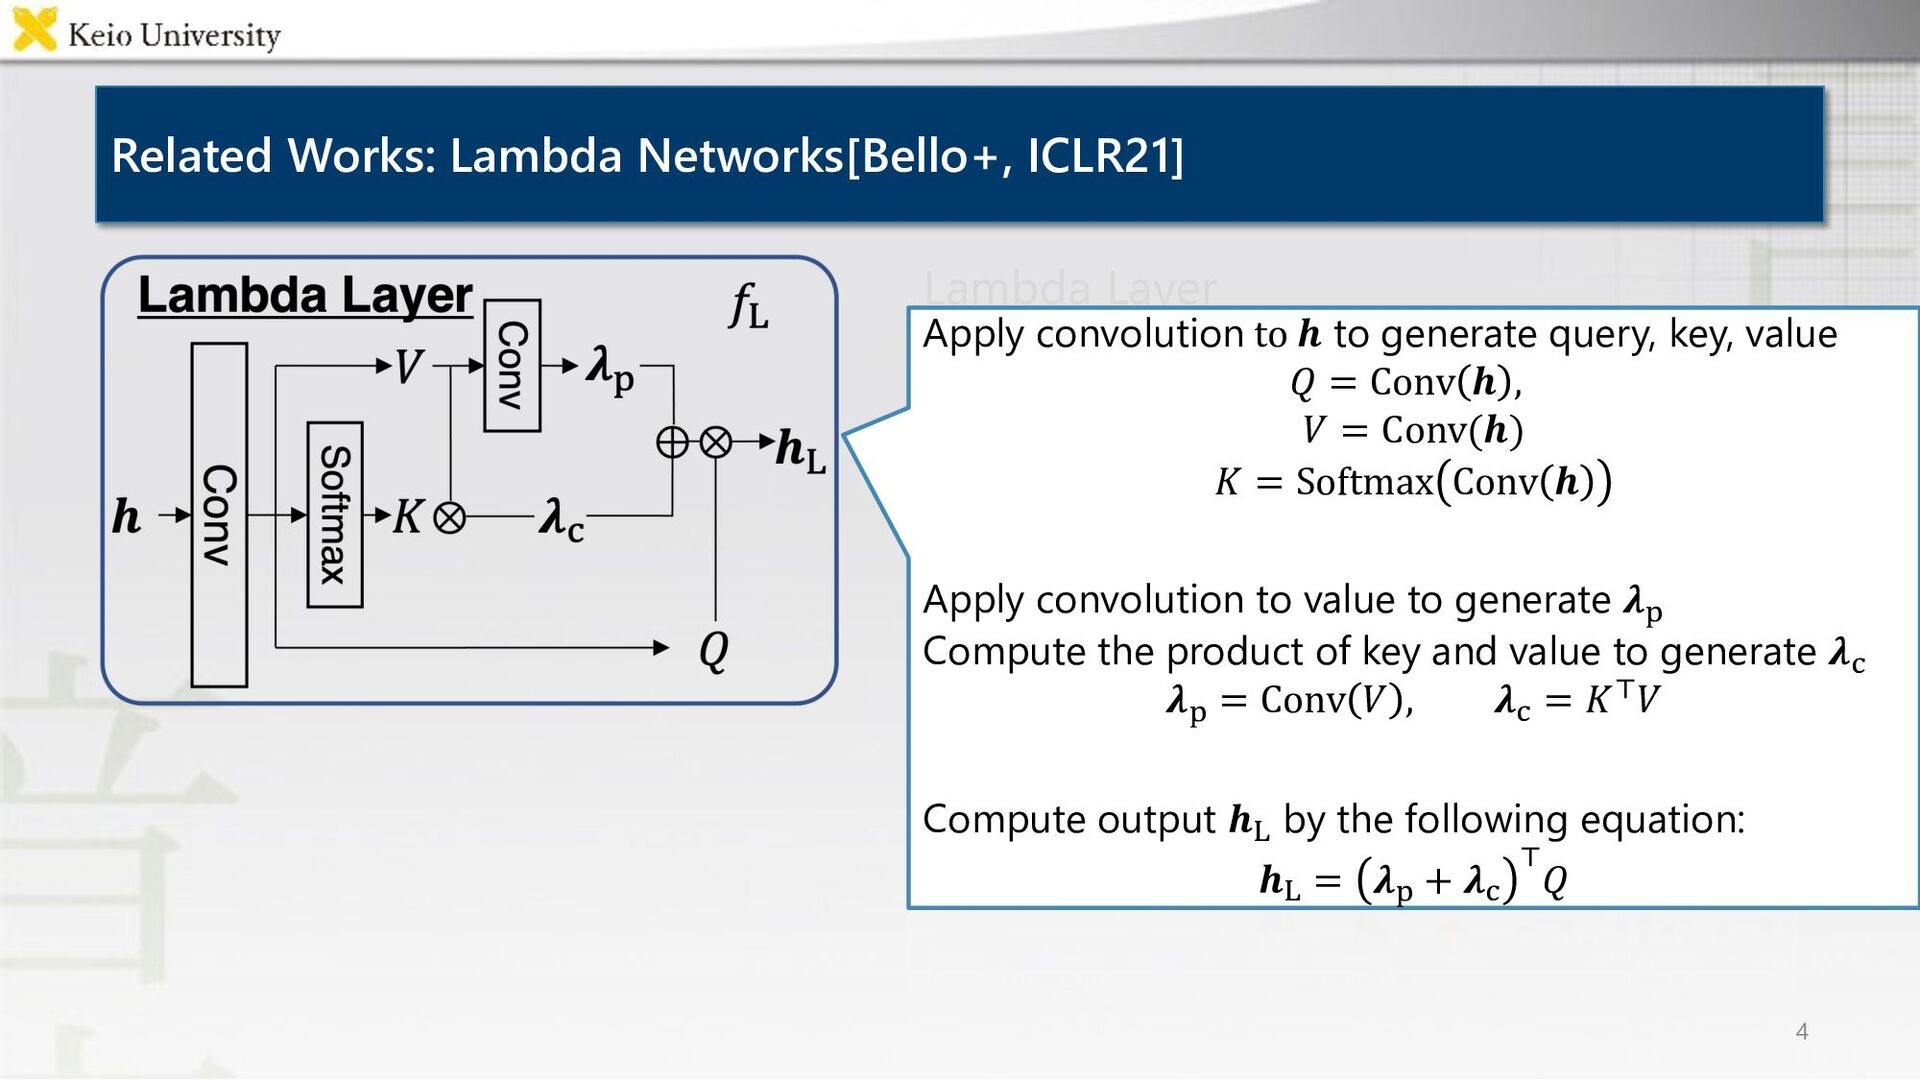
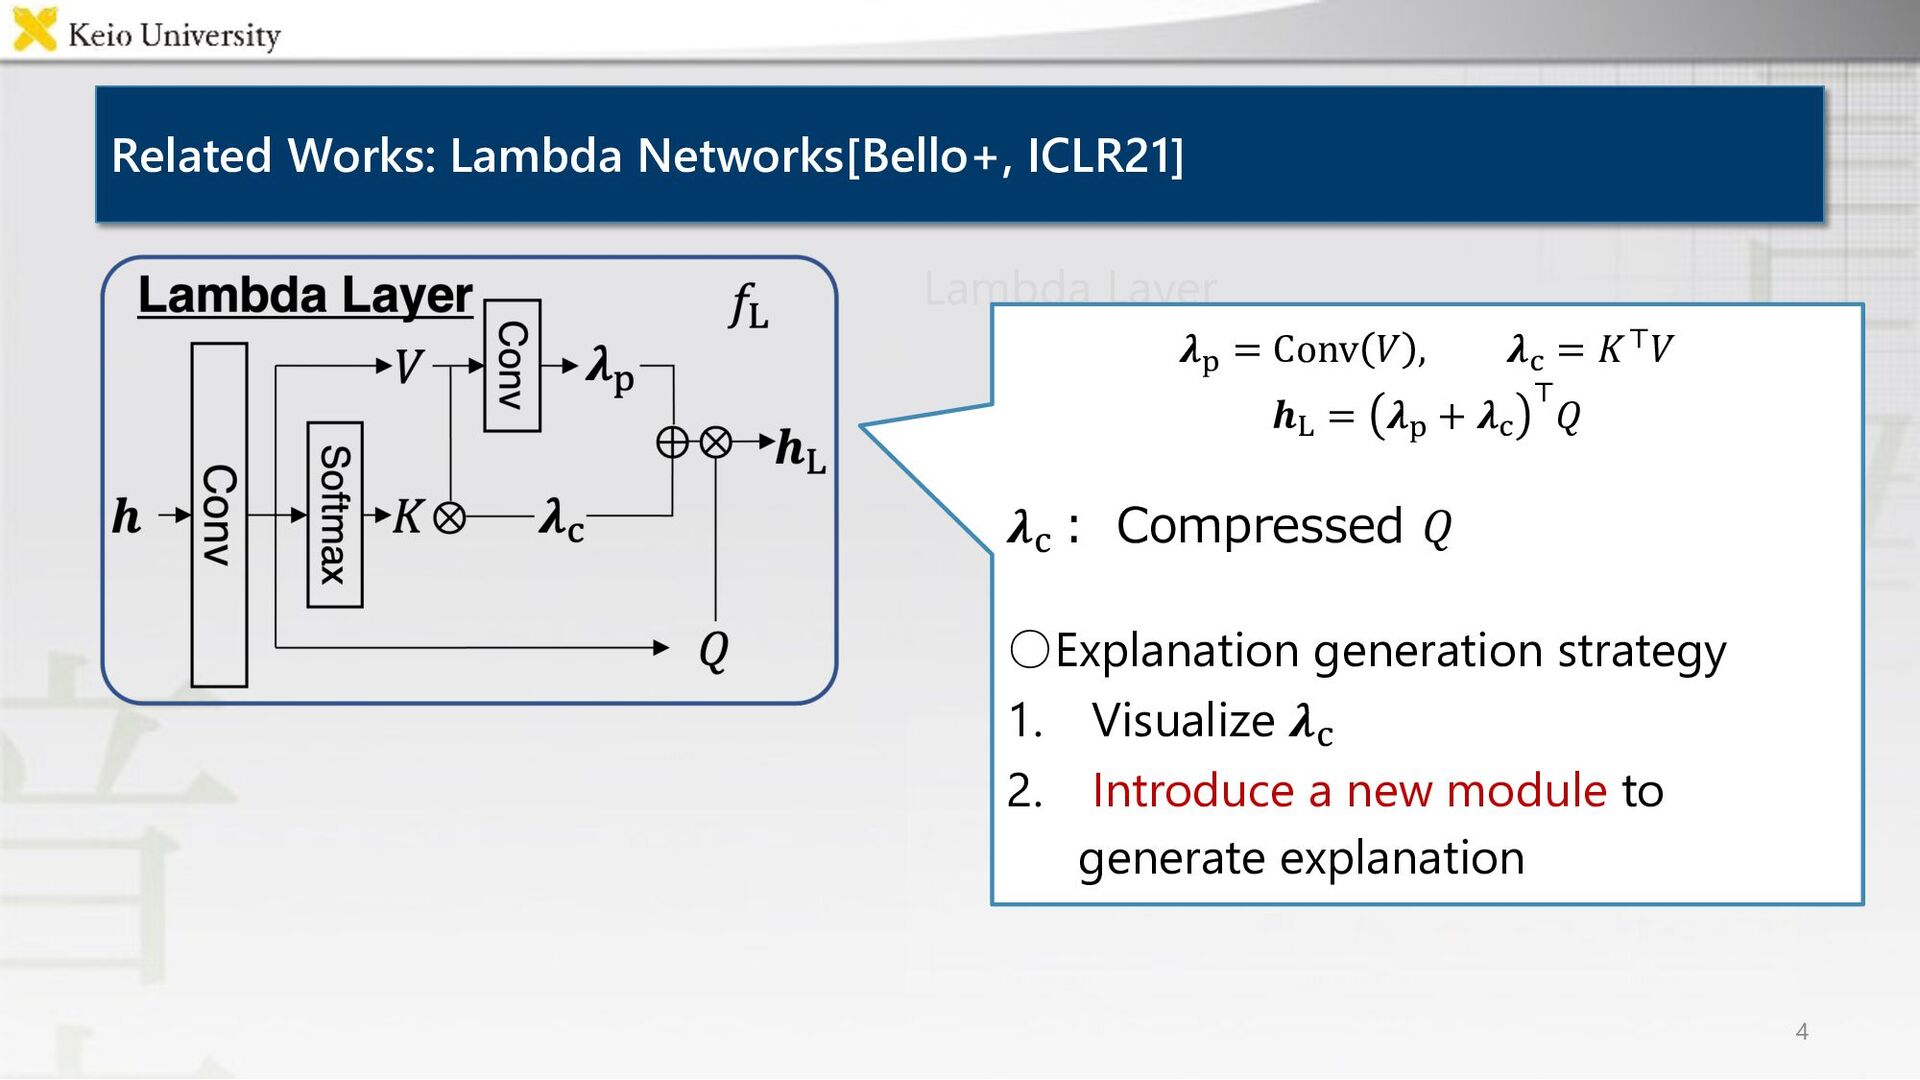
to generate query, key, value 𝑄 = Conv 𝒉 , 𝑉 = Conv(𝒉) 𝐾 = Softmax Conv 𝒉 Apply convolution to value to generate 𝝀! Compute the product of key and value to generate 𝝀" 𝝀! = Conv 𝑉 , 𝝀" = 𝐾#𝑉 Compute output 𝒉$ by the following equation: 𝒉$ = 𝝀! + 𝝀" # 𝑄 Related Works: Lambda Networks[Bello+, ICLR21]
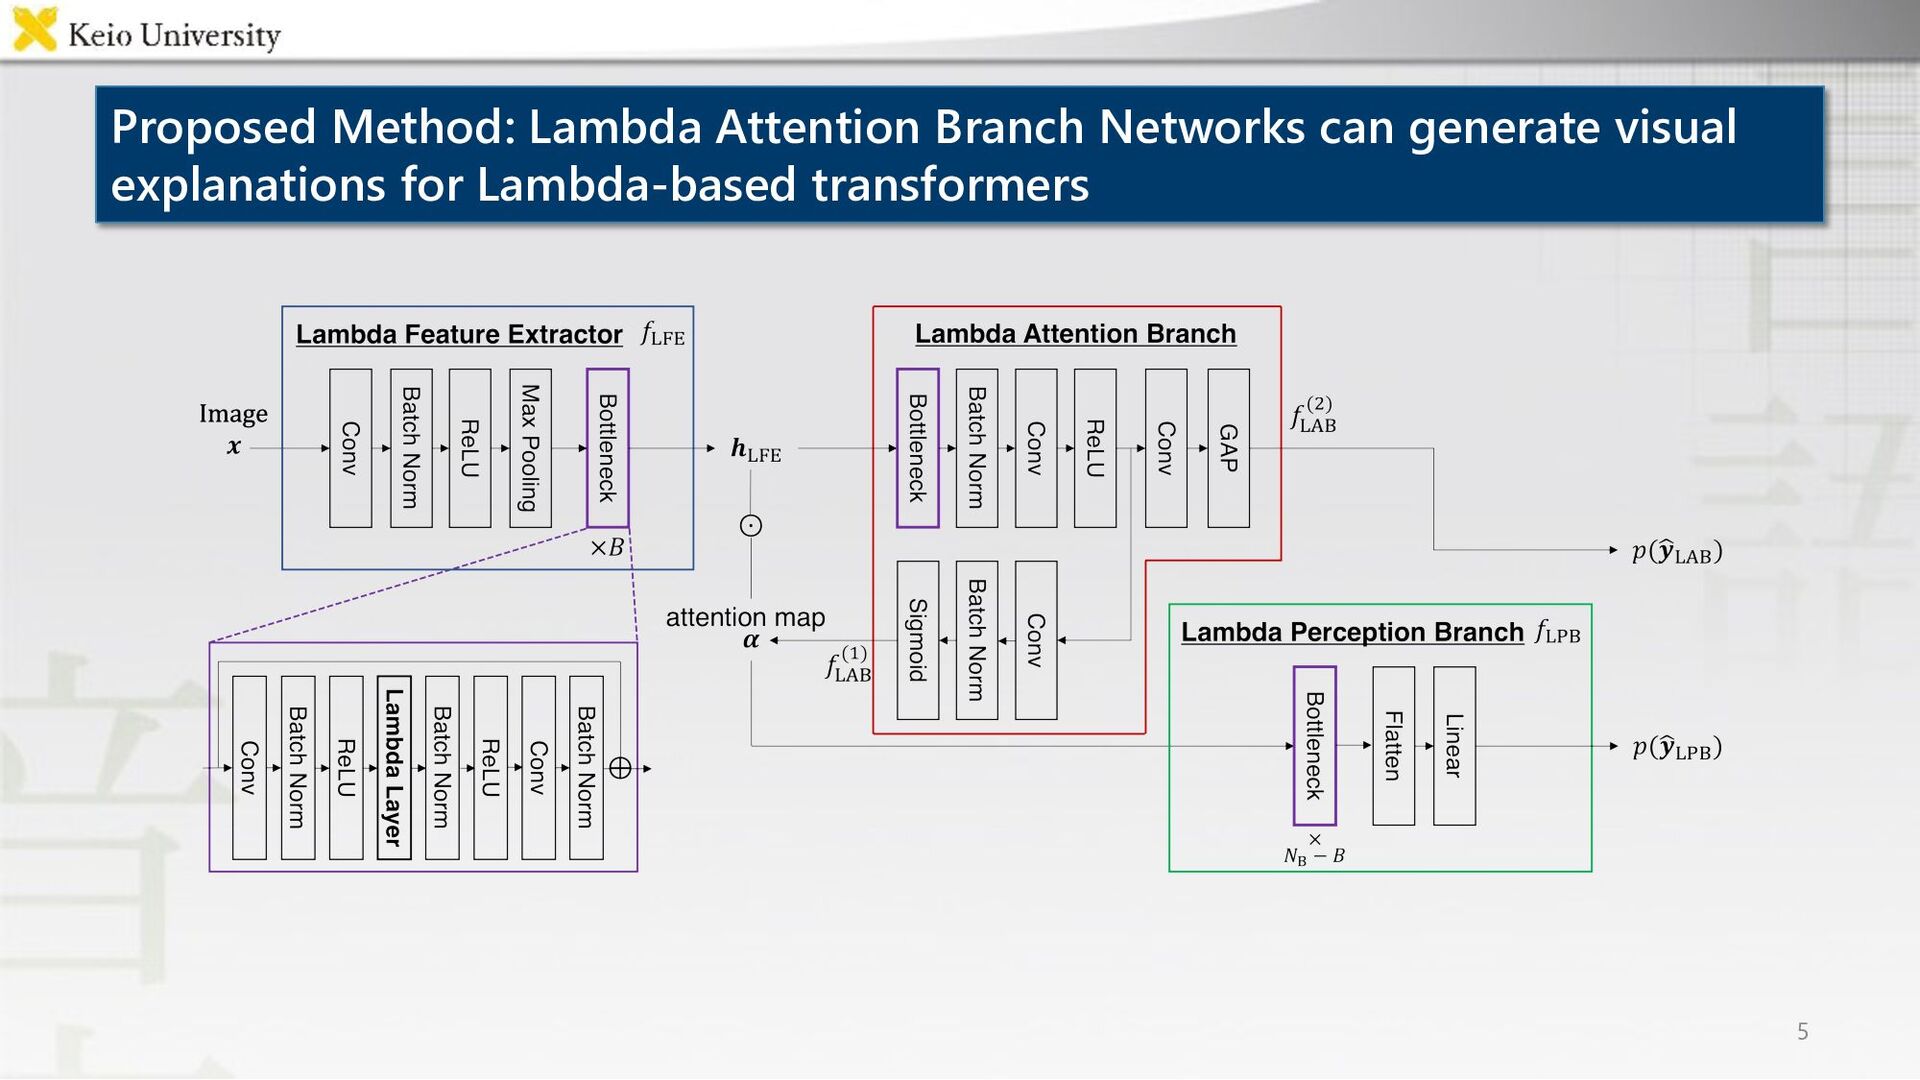
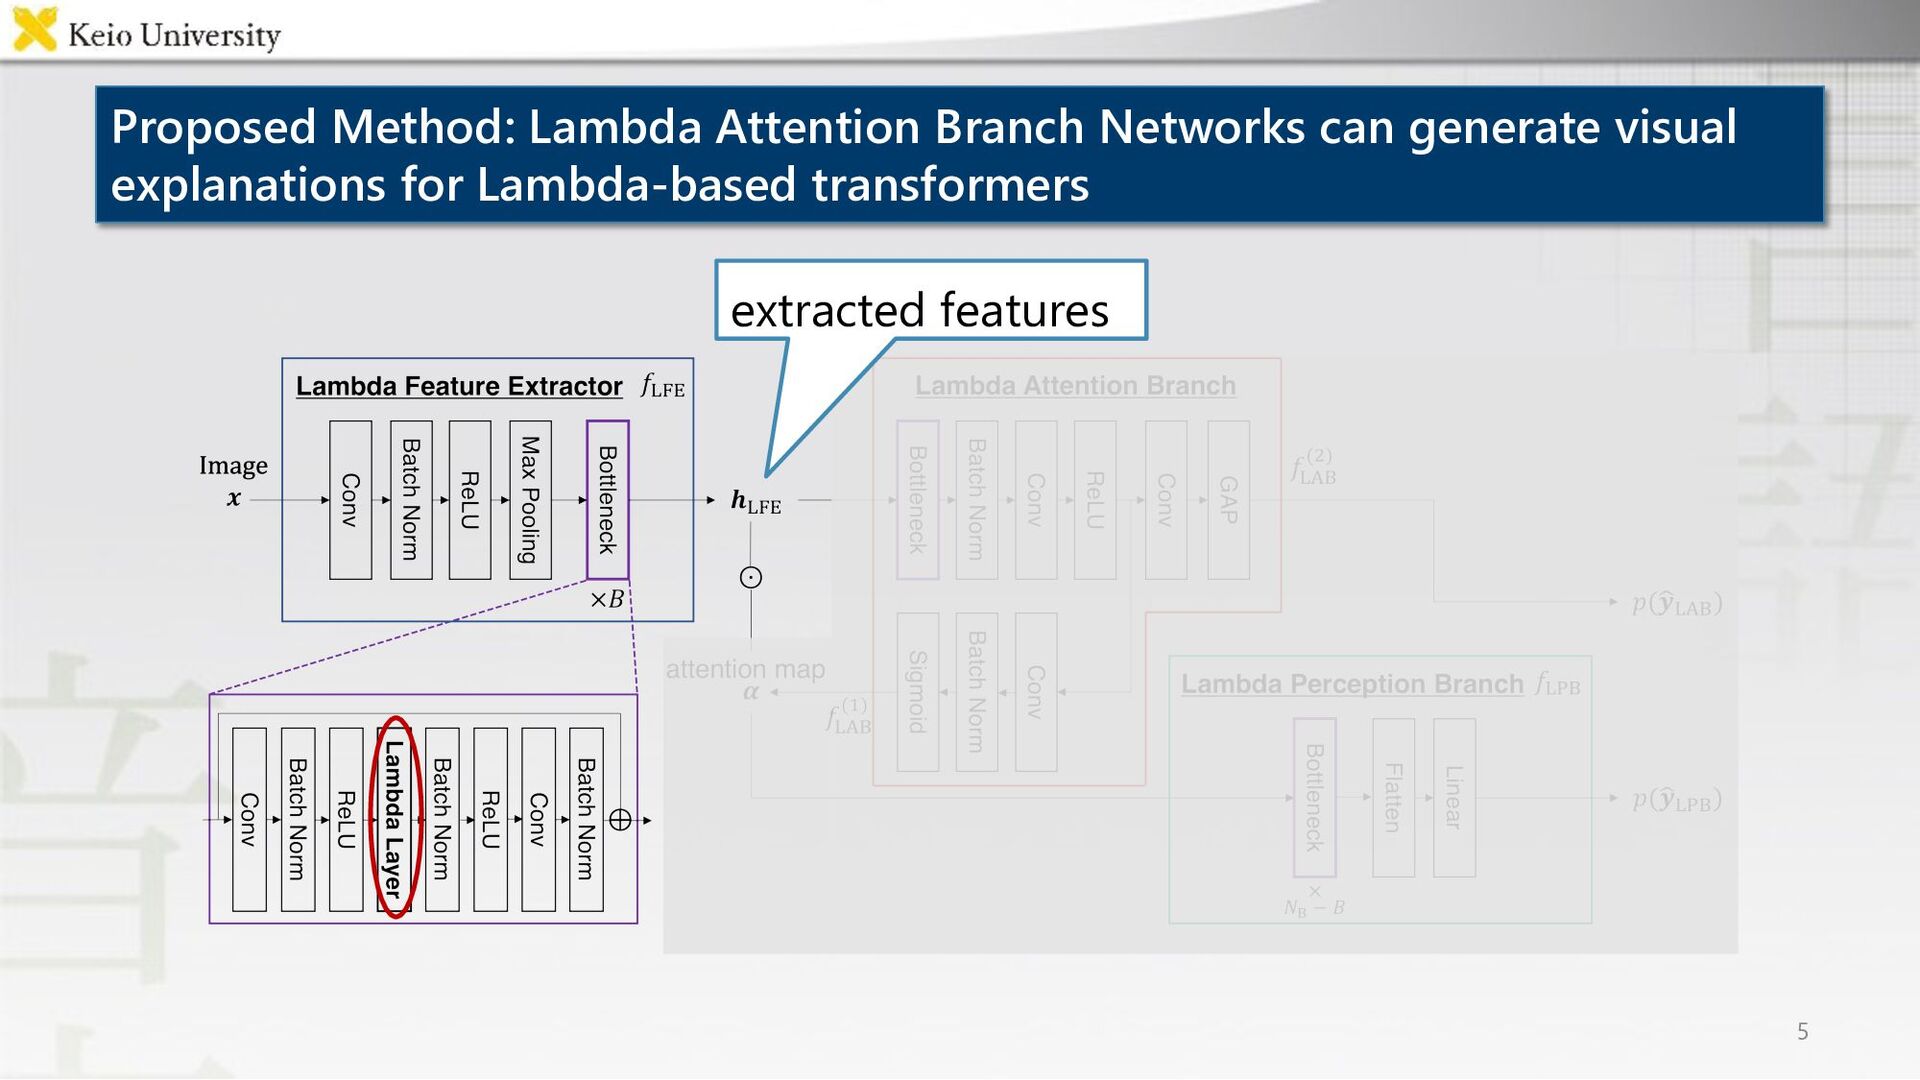
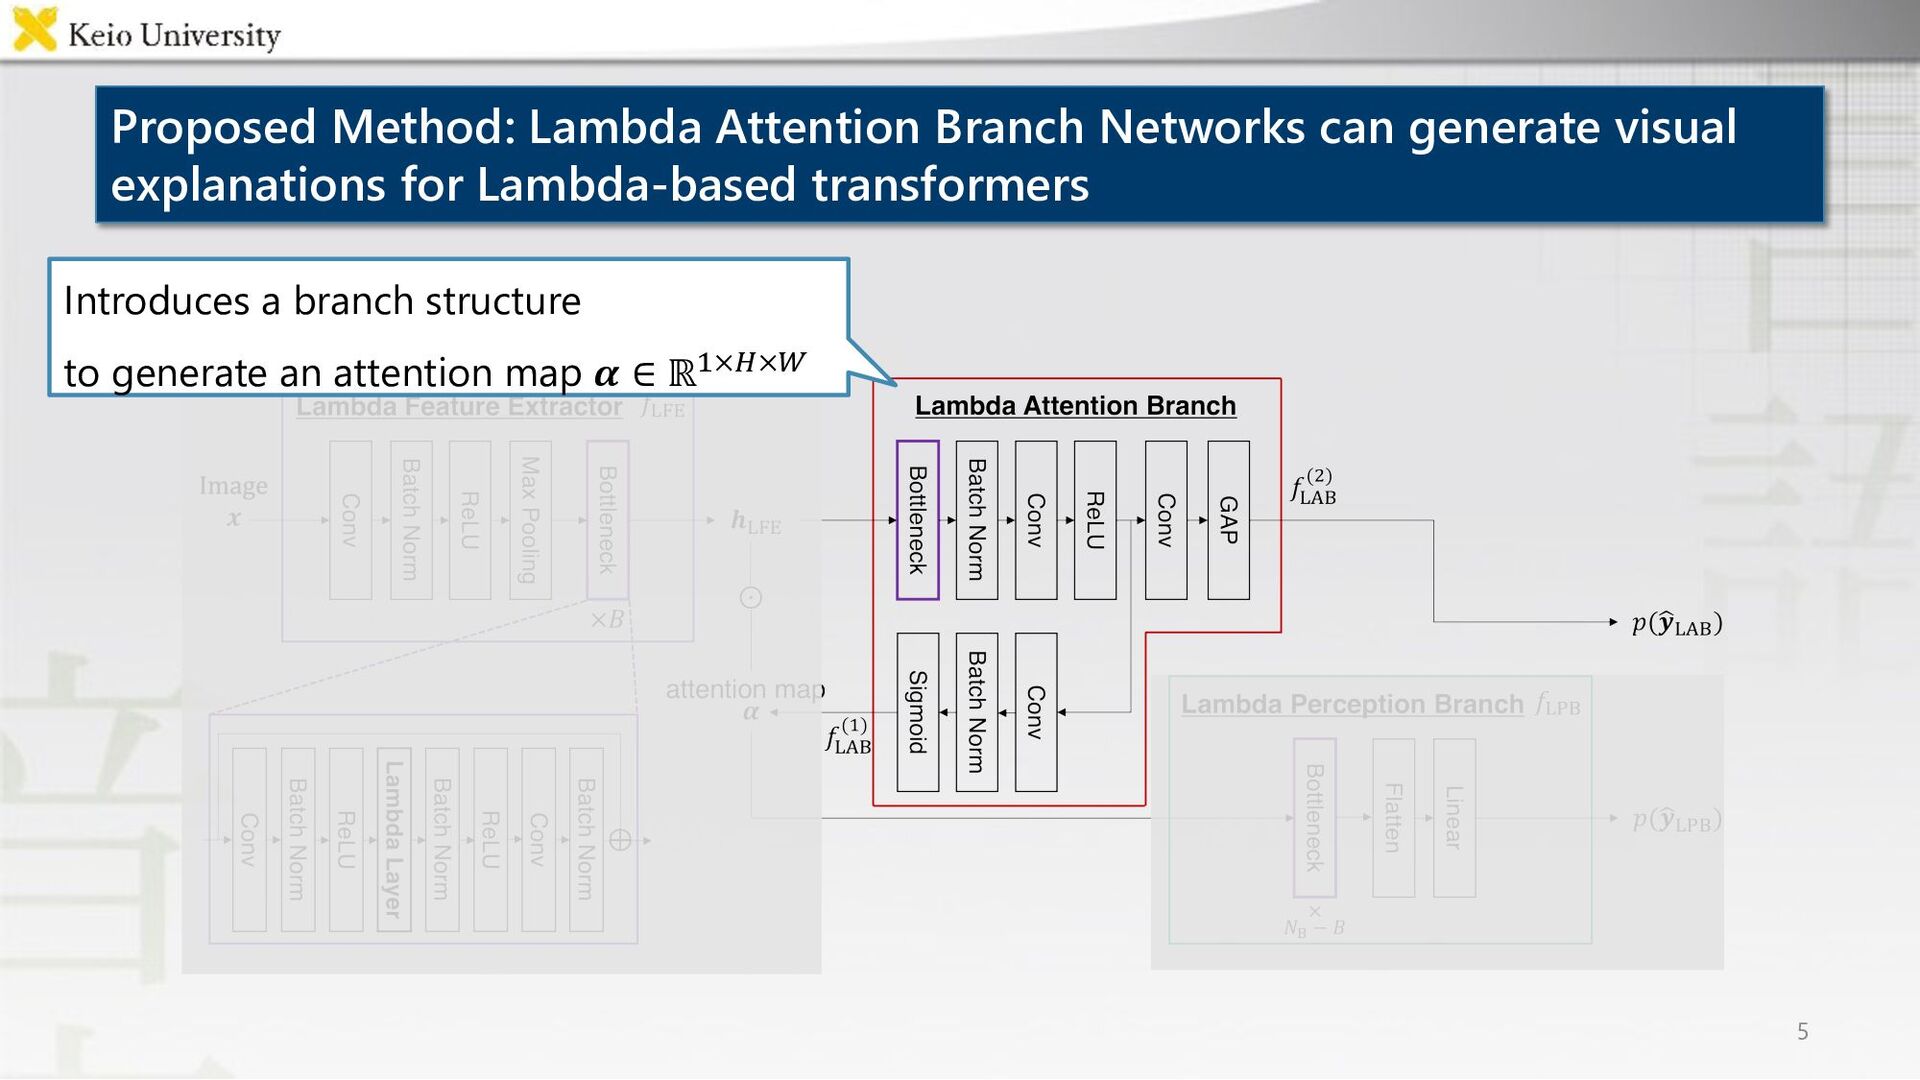
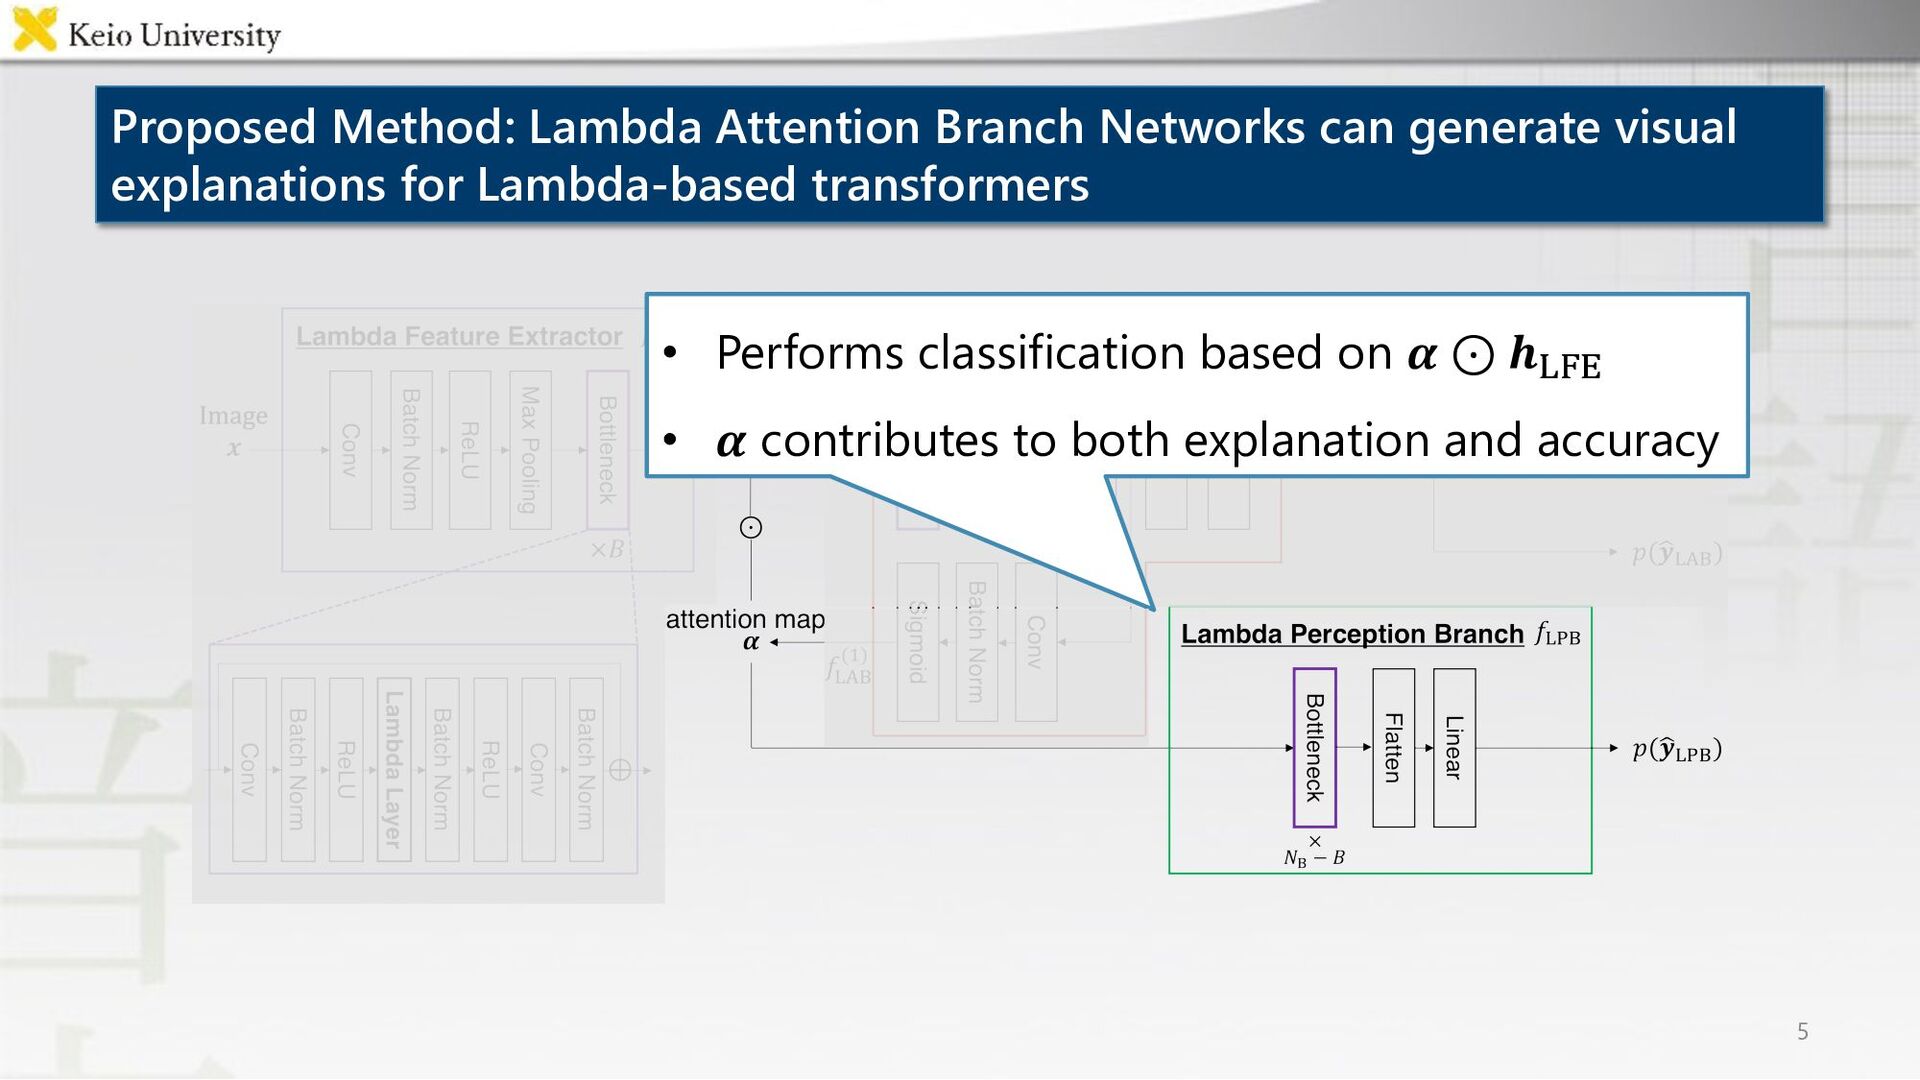
𝜶 contributes to both explanation and accuracy Proposed Method: Lambda Attention Branch Networks can generate visual explanations for Lambda-based transformers
noise in the attention map 1. Generate mask image ) 𝒙 based on attention map Mask image ) 𝒙 Attention map Input 𝒙 2. Minimize KL-divergence between the output of the 𝒙 and ) 𝒙 ℒ*' = 𝐷*' 𝑓 𝒙 |𝑓 ) 𝒙
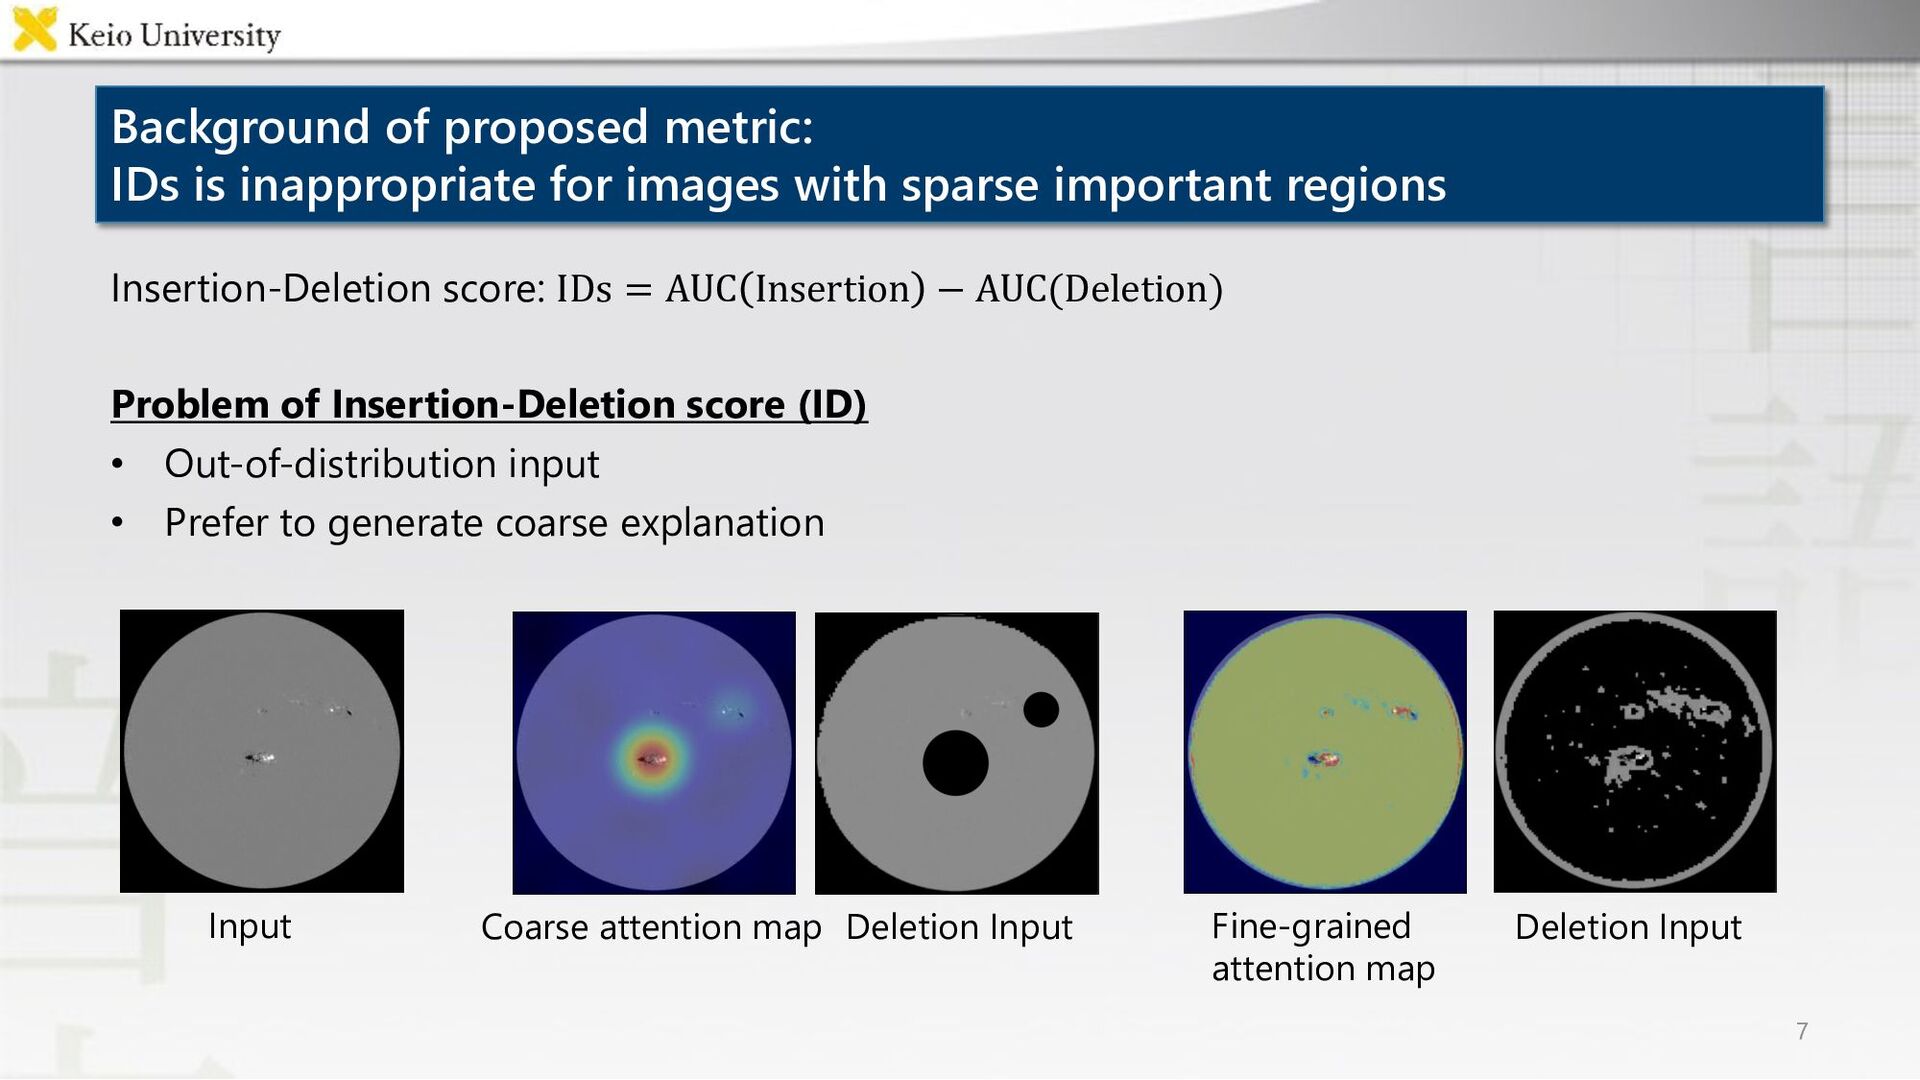
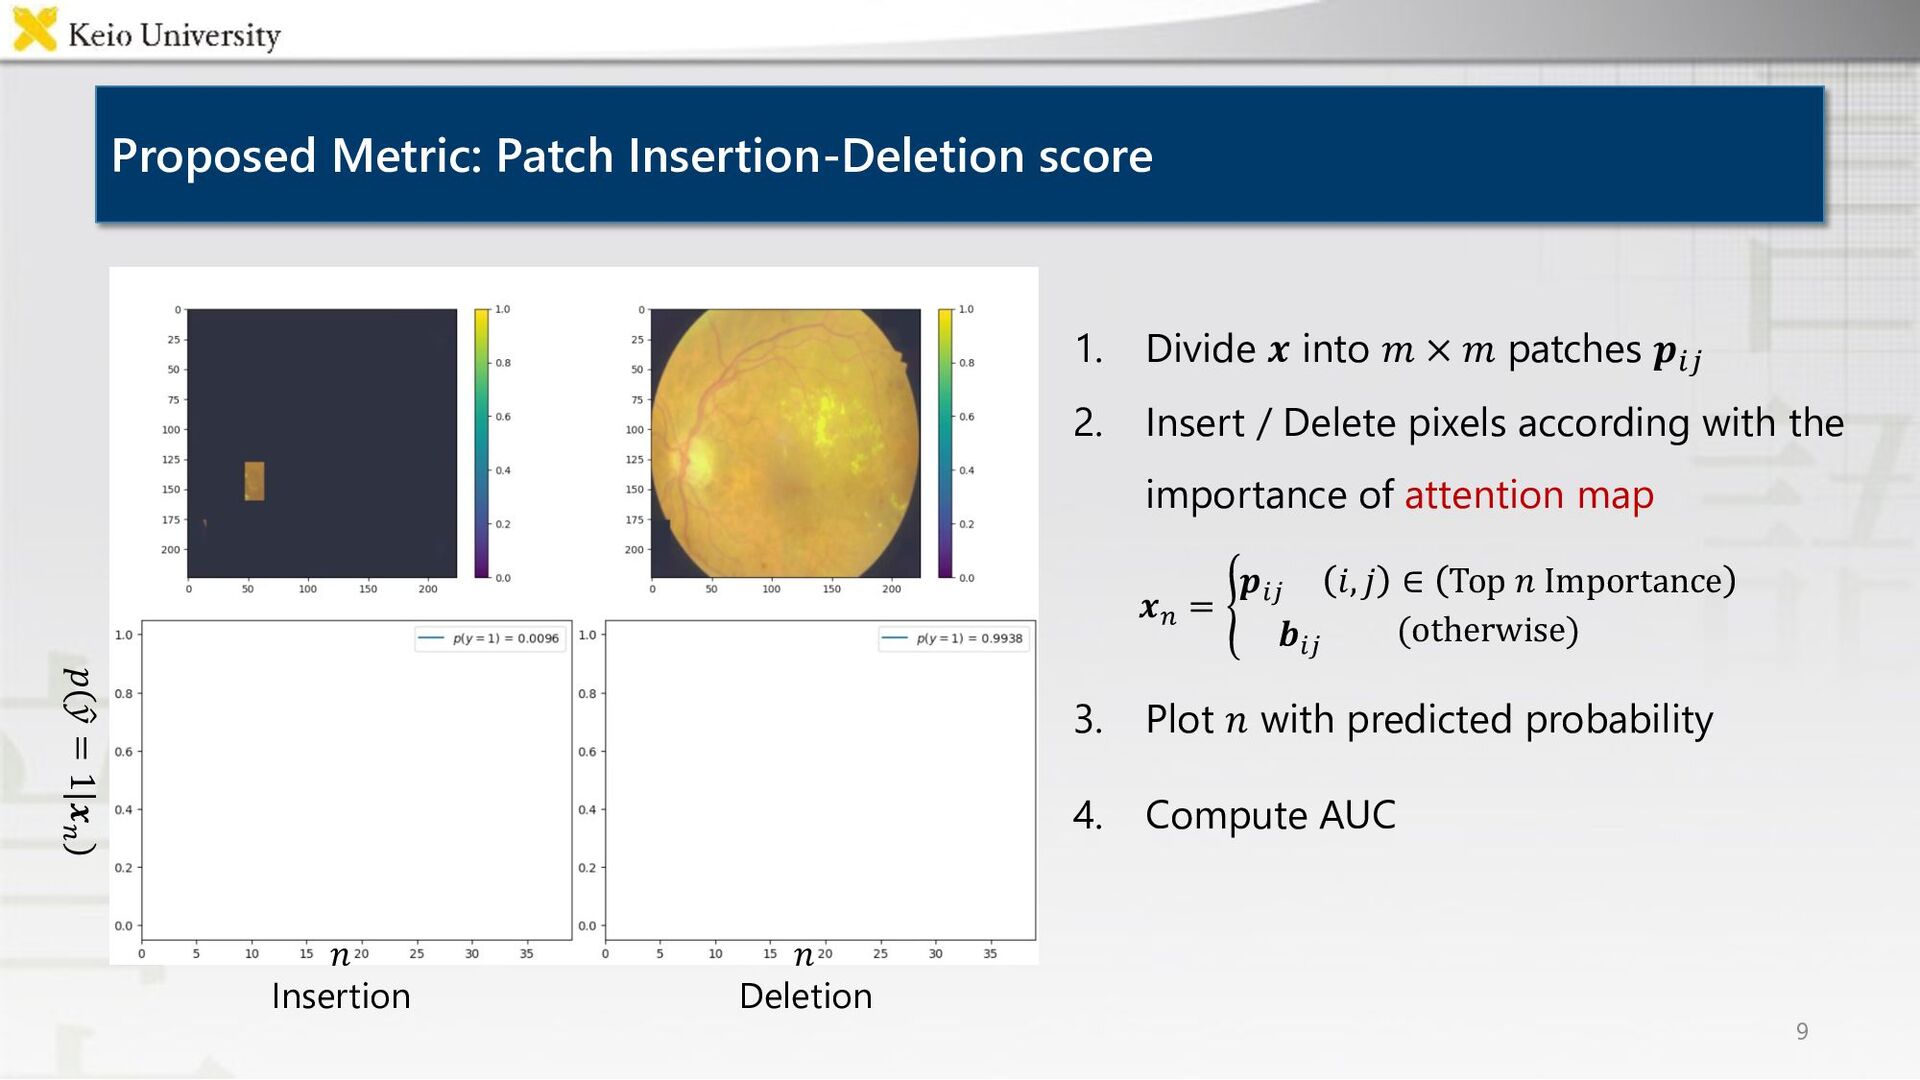
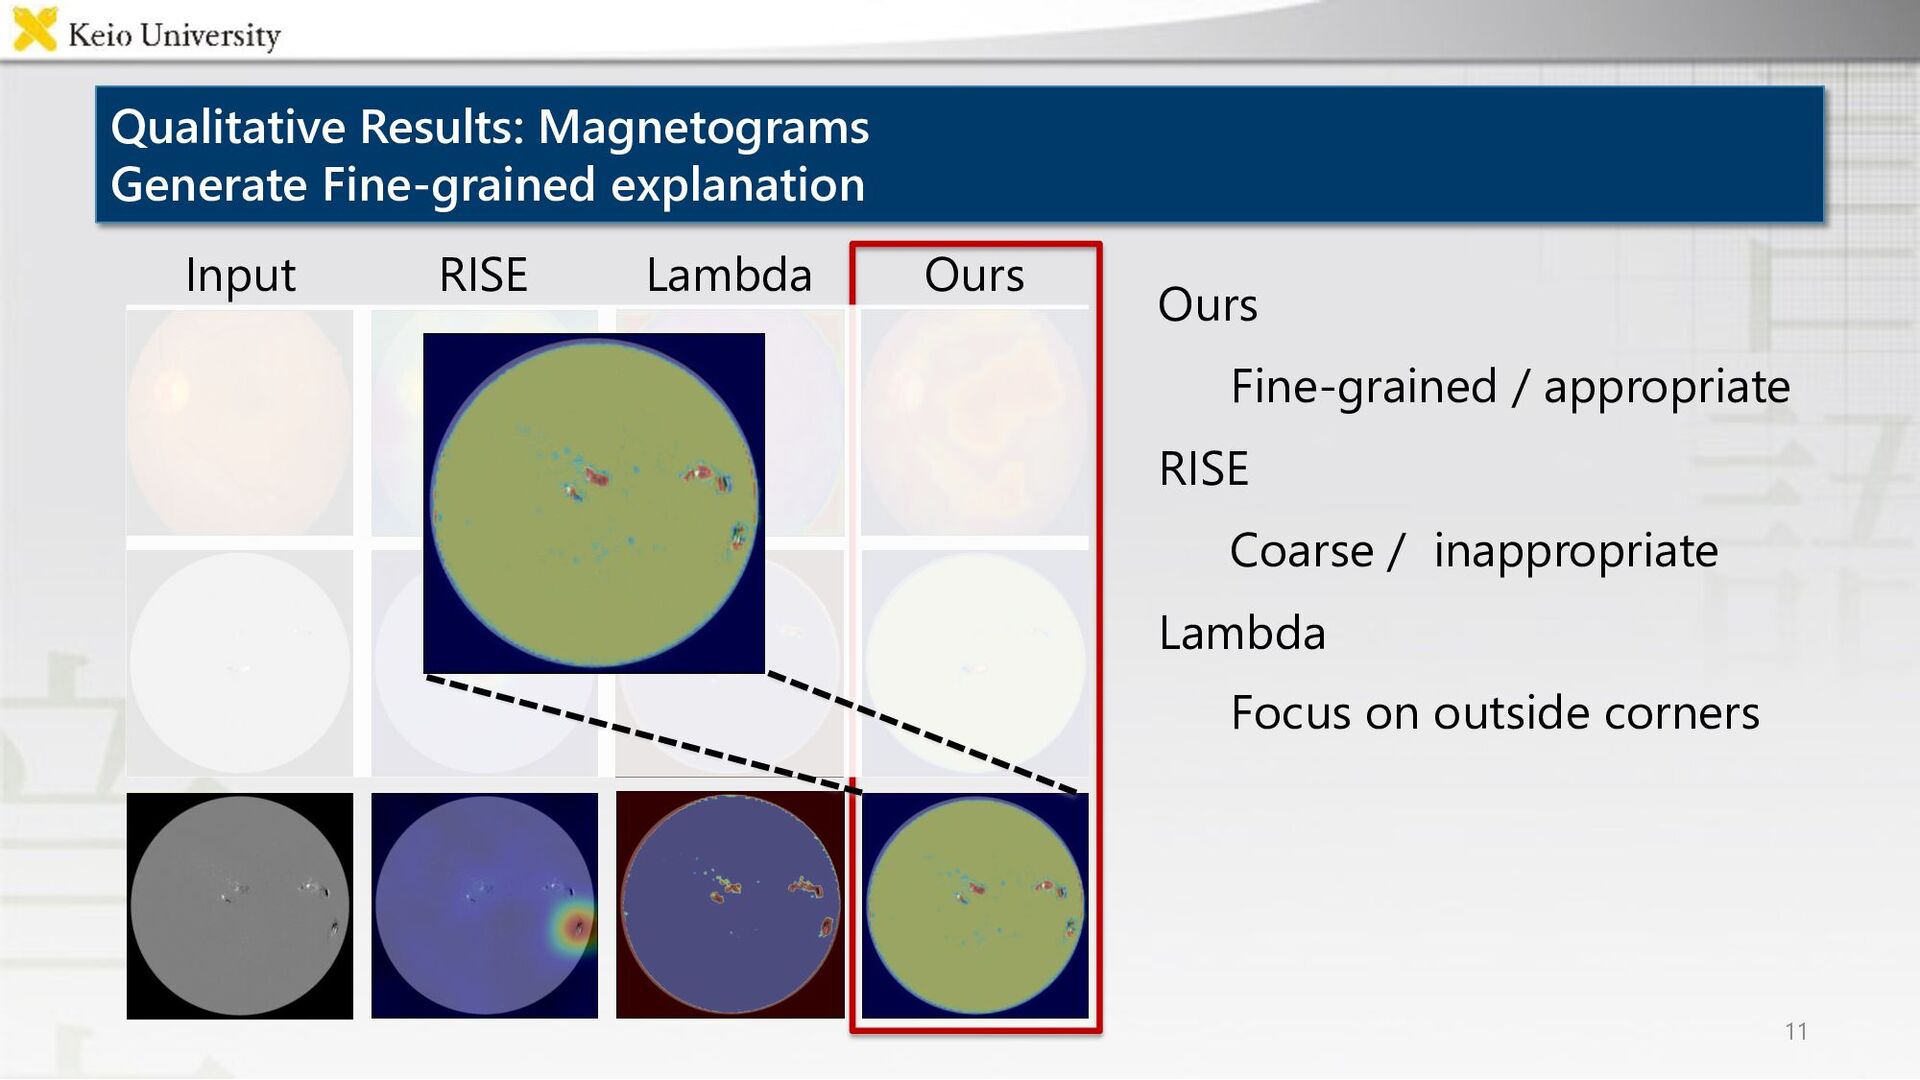
of Insertion-Deletion score (ID) • Out-of-distribution input • Prefer to generate coarse explanation Coarse attention map Deletion Input Fine-grained attention map Deletion Input Input Background of proposed metric: IDs is inappropriate for images with sparse important regions
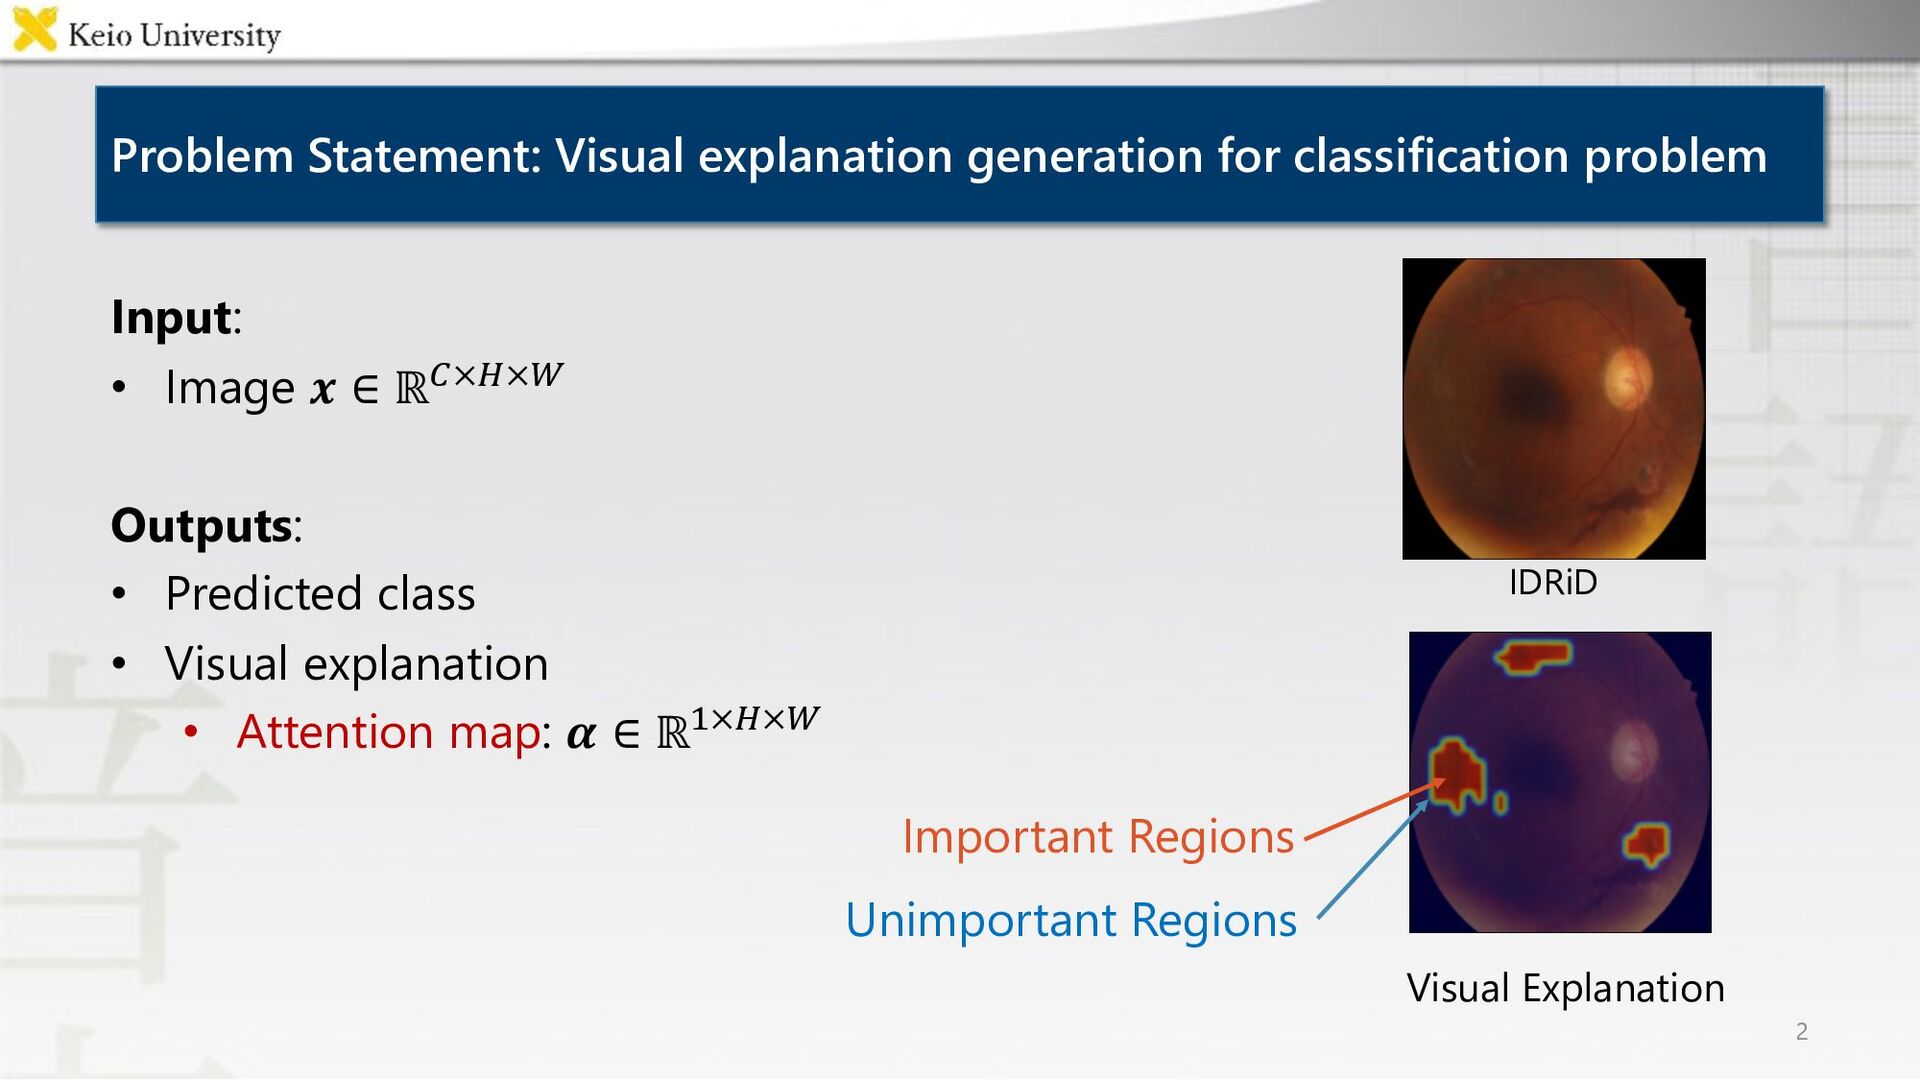
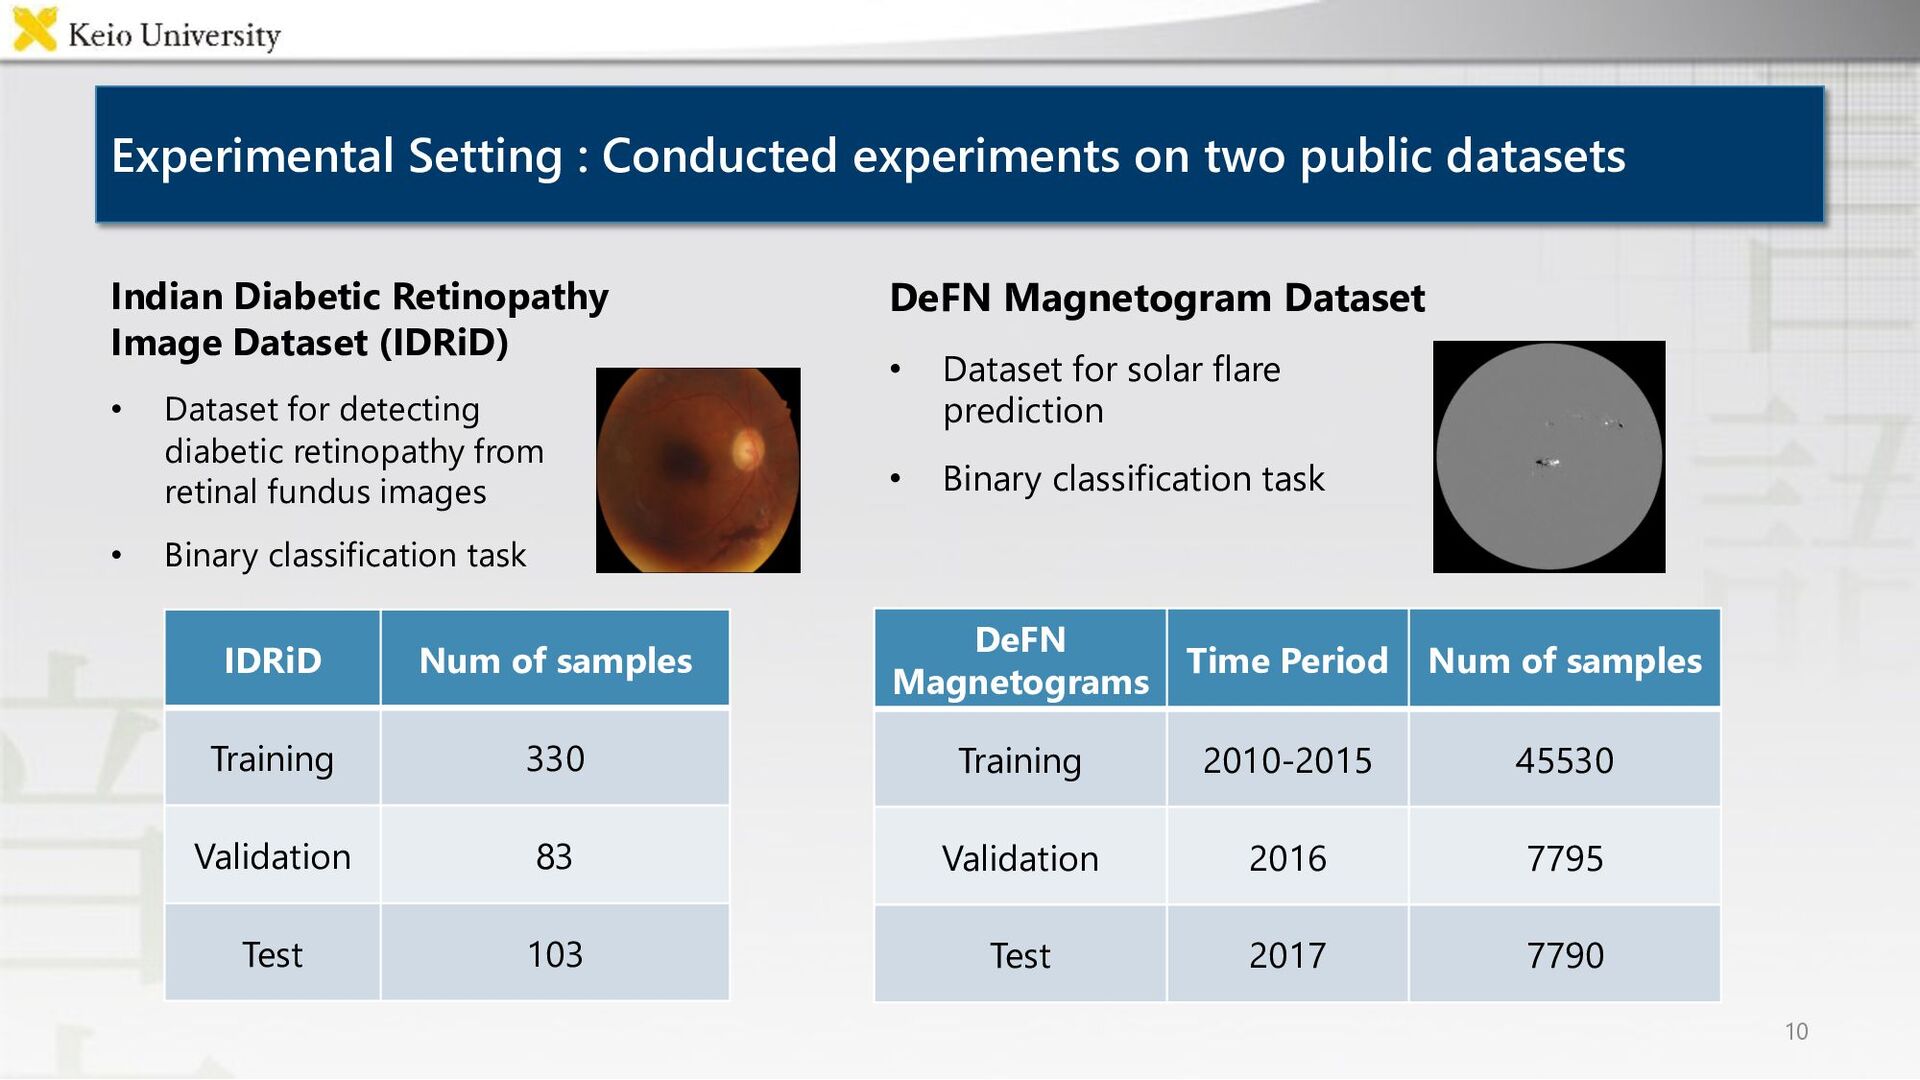
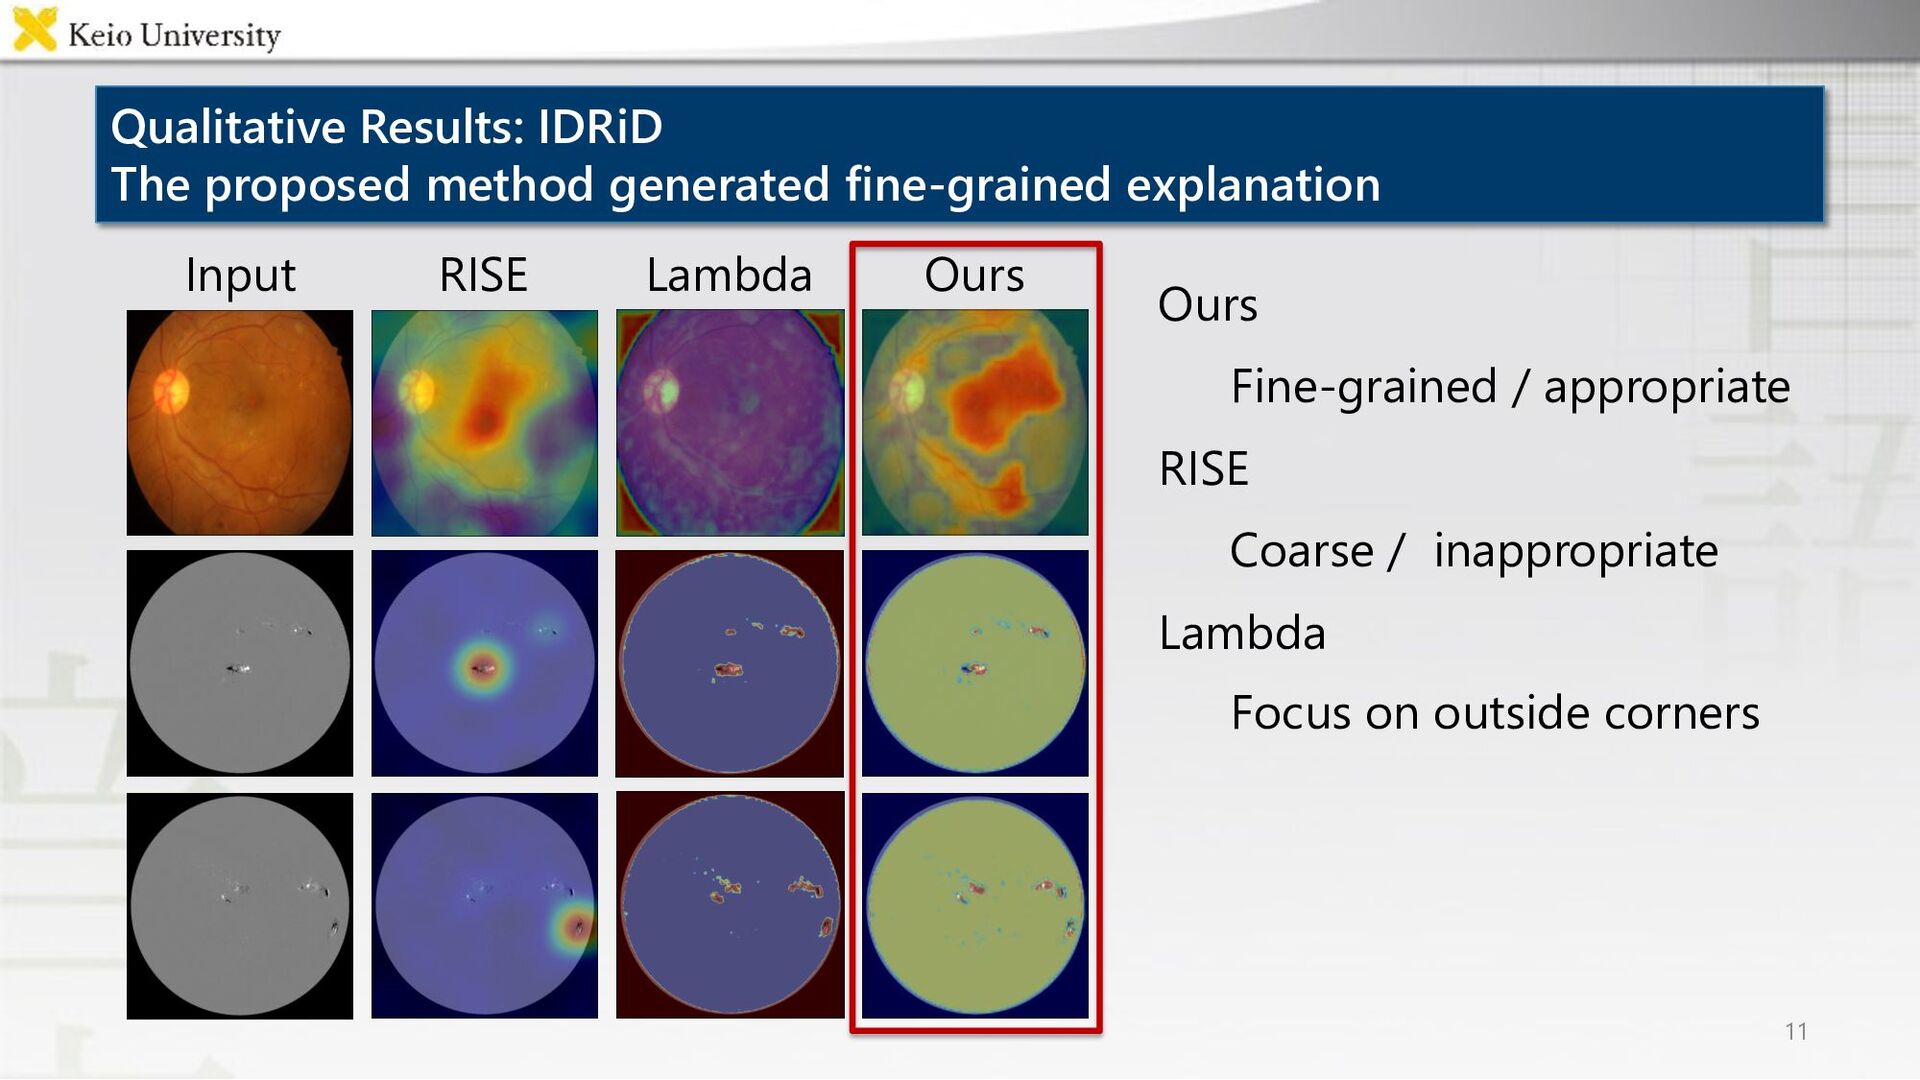
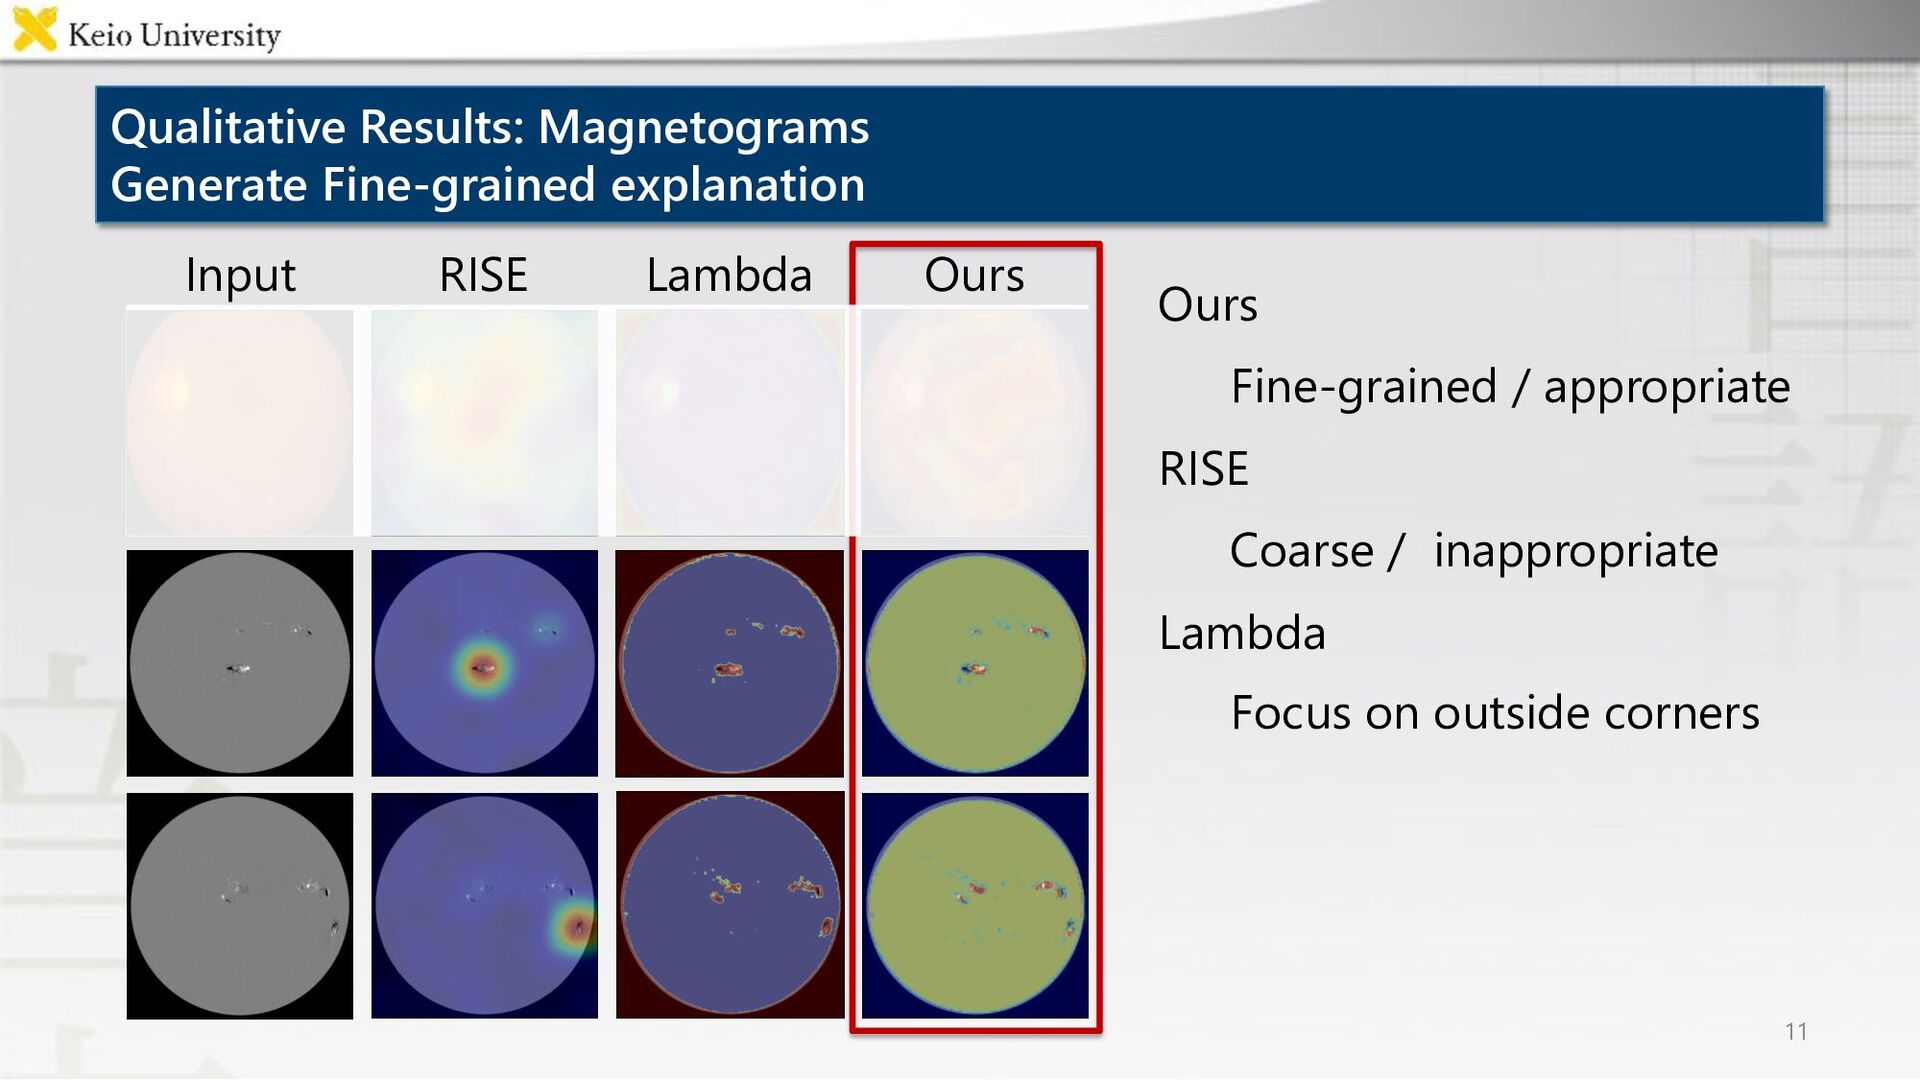
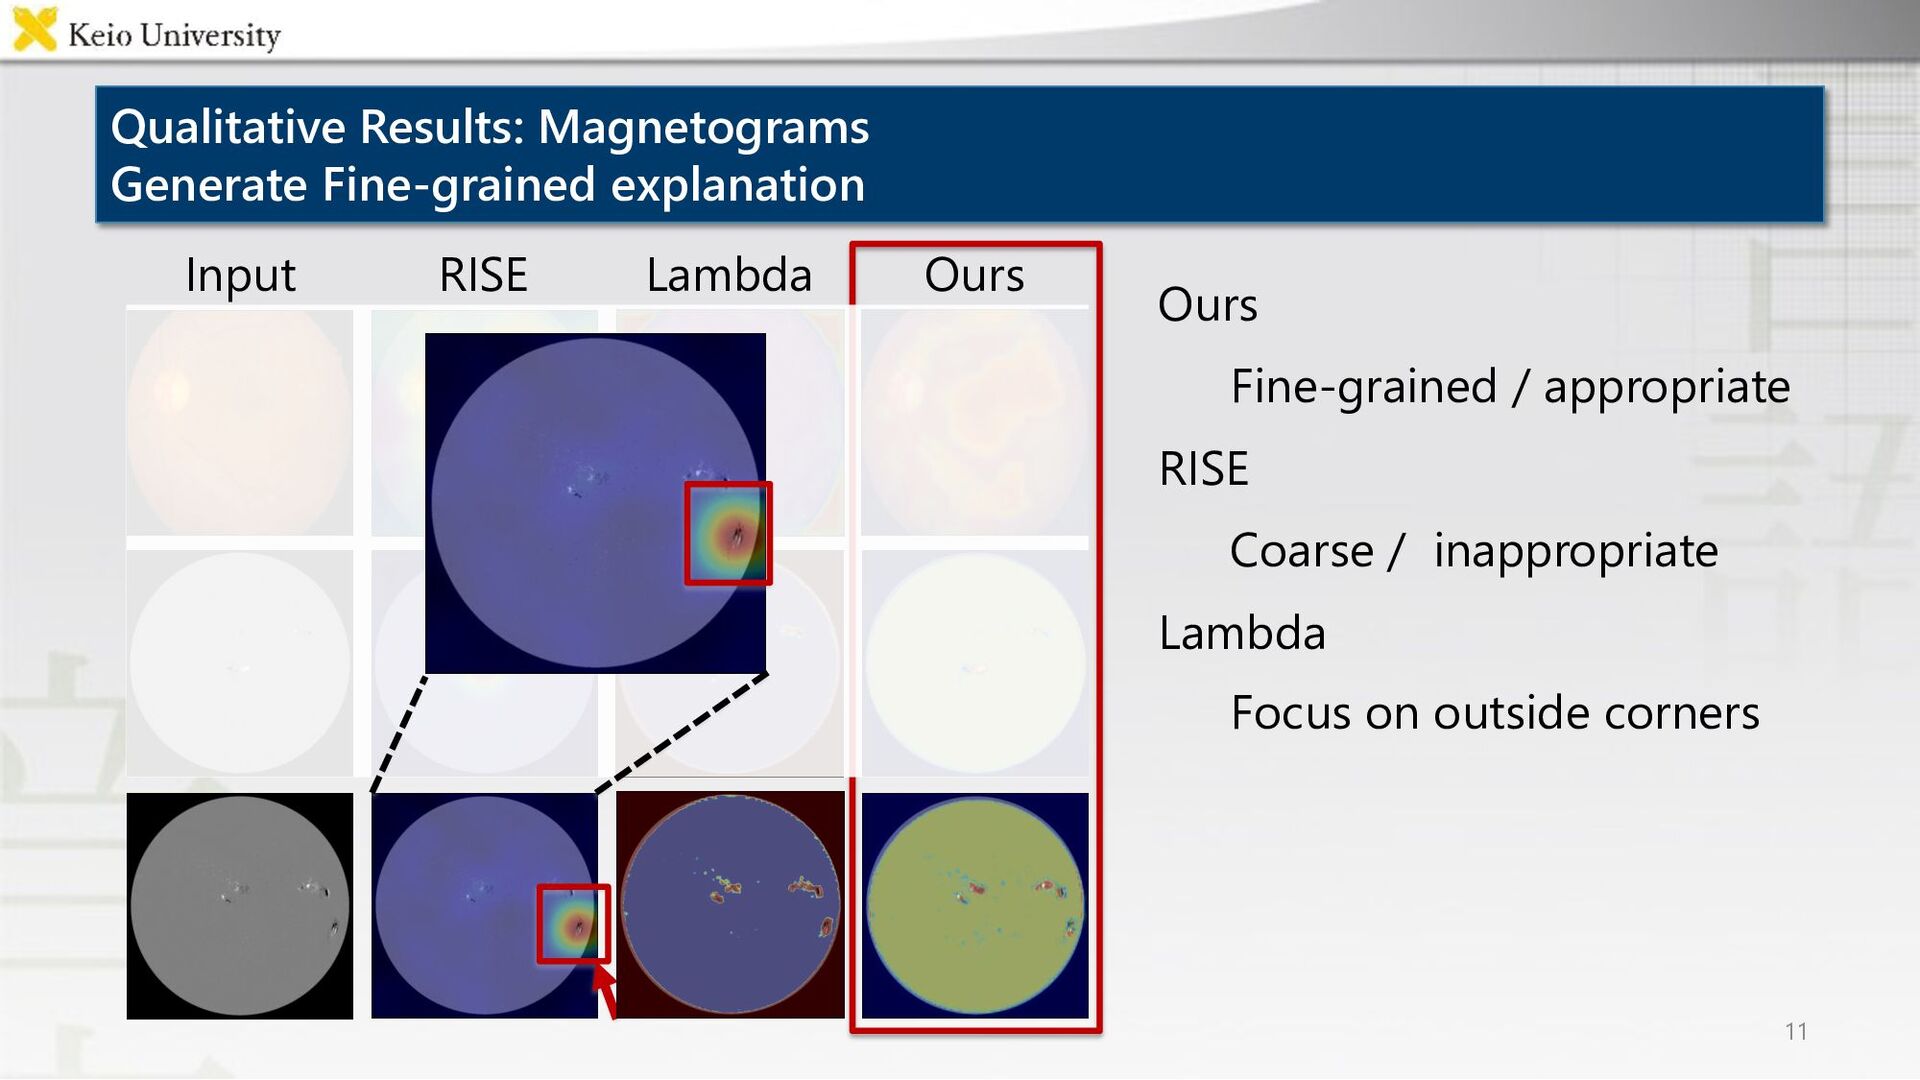
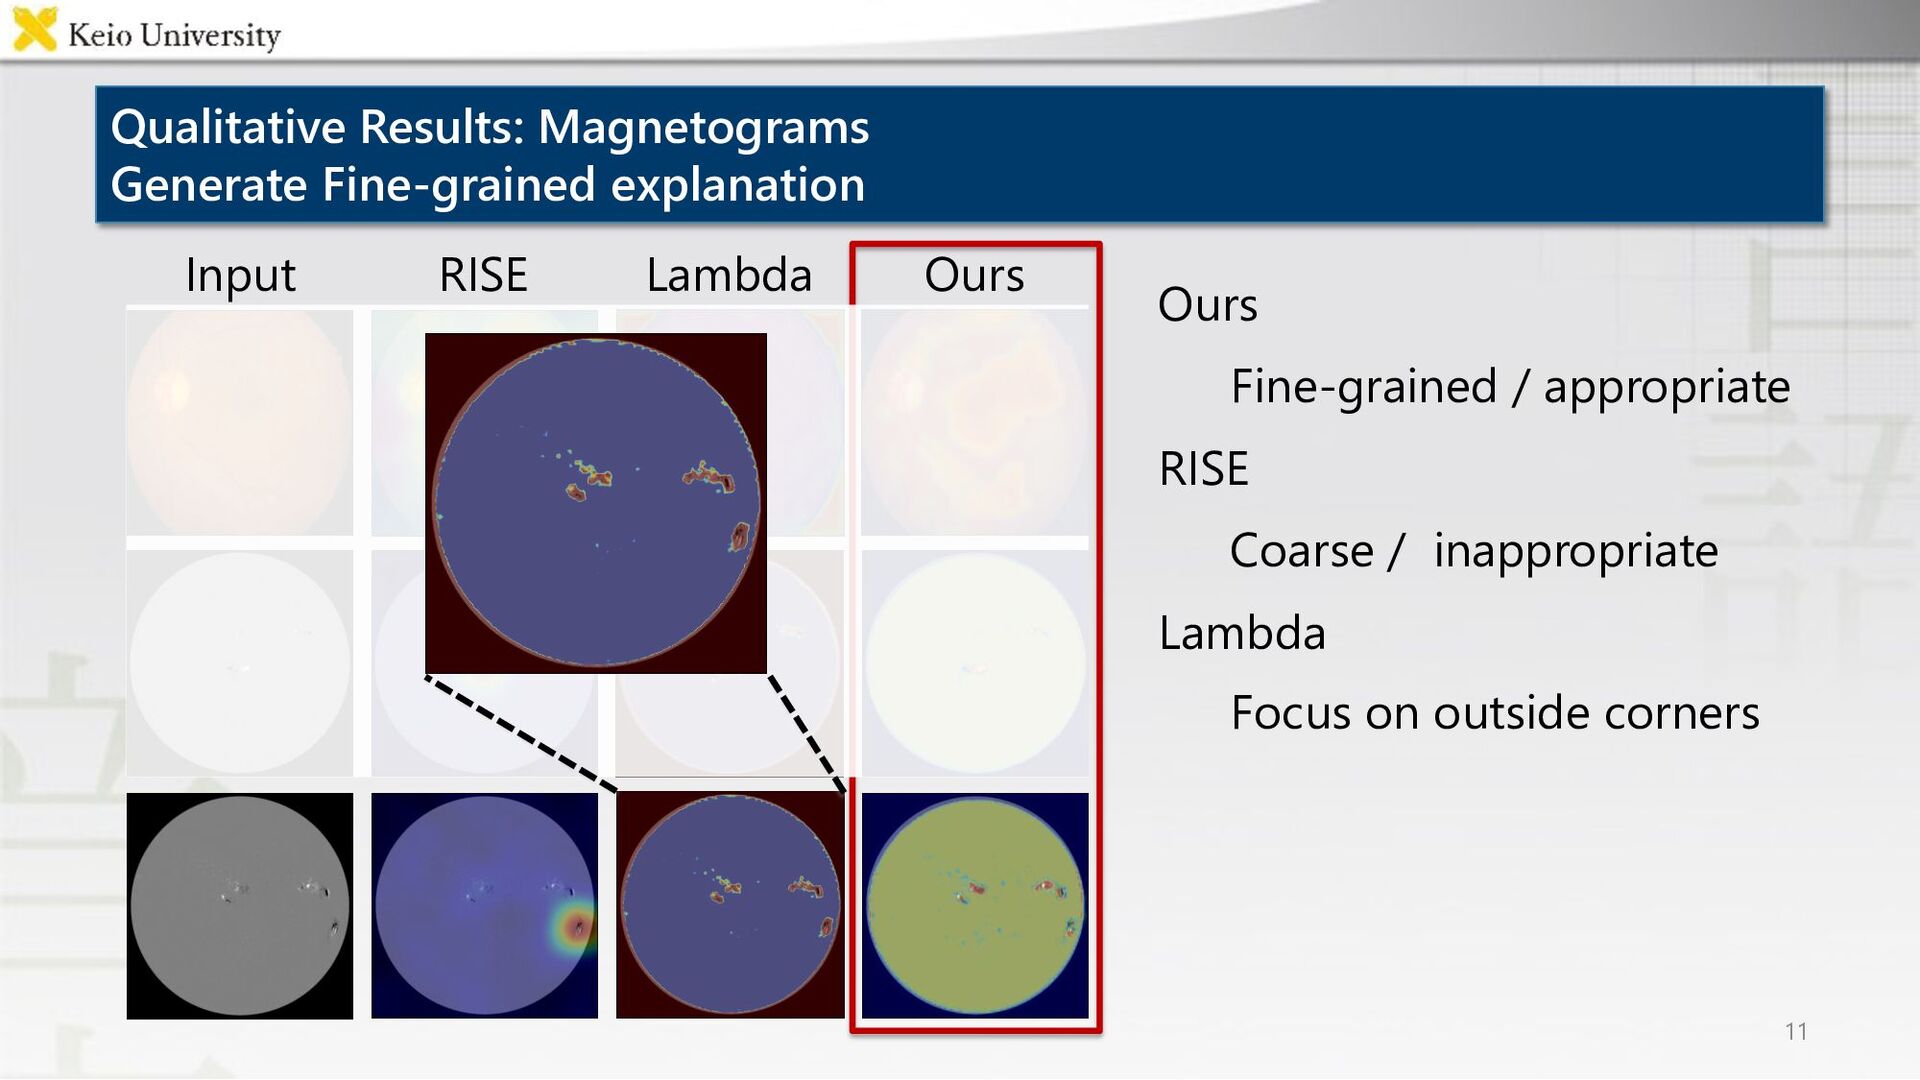
Indian Diabetic Retinopathy Image Dataset (IDRiD) • Dataset for detecting diabetic retinopathy from retinal fundus images • Binary classification task DeFN Magnetogram Dataset • Dataset for solar flare prediction • Binary classification task IDRiD Num of samples Training 330 Validation 83 Test 103 DeFN Magnetograms Time Period Num of samples Training 2010-2015 45530 Validation 2016 7795 Test 2017 7790
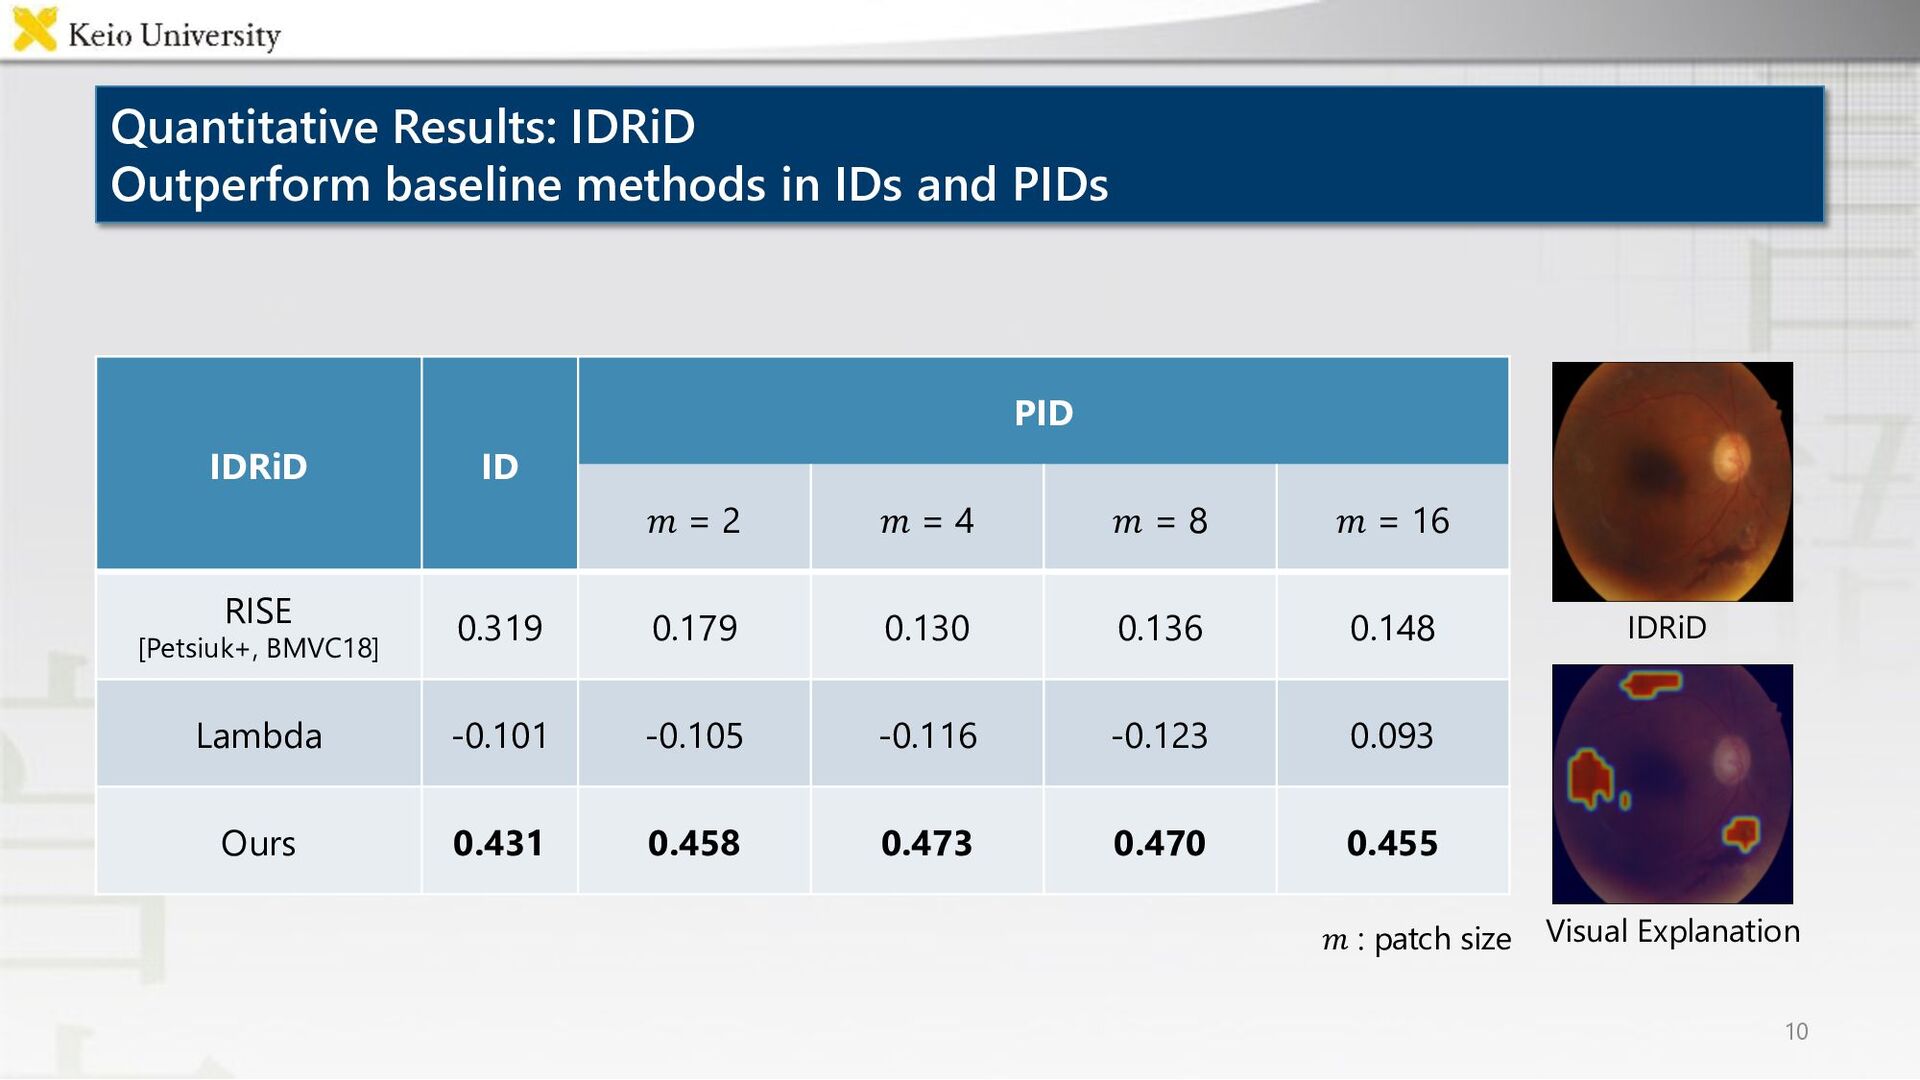
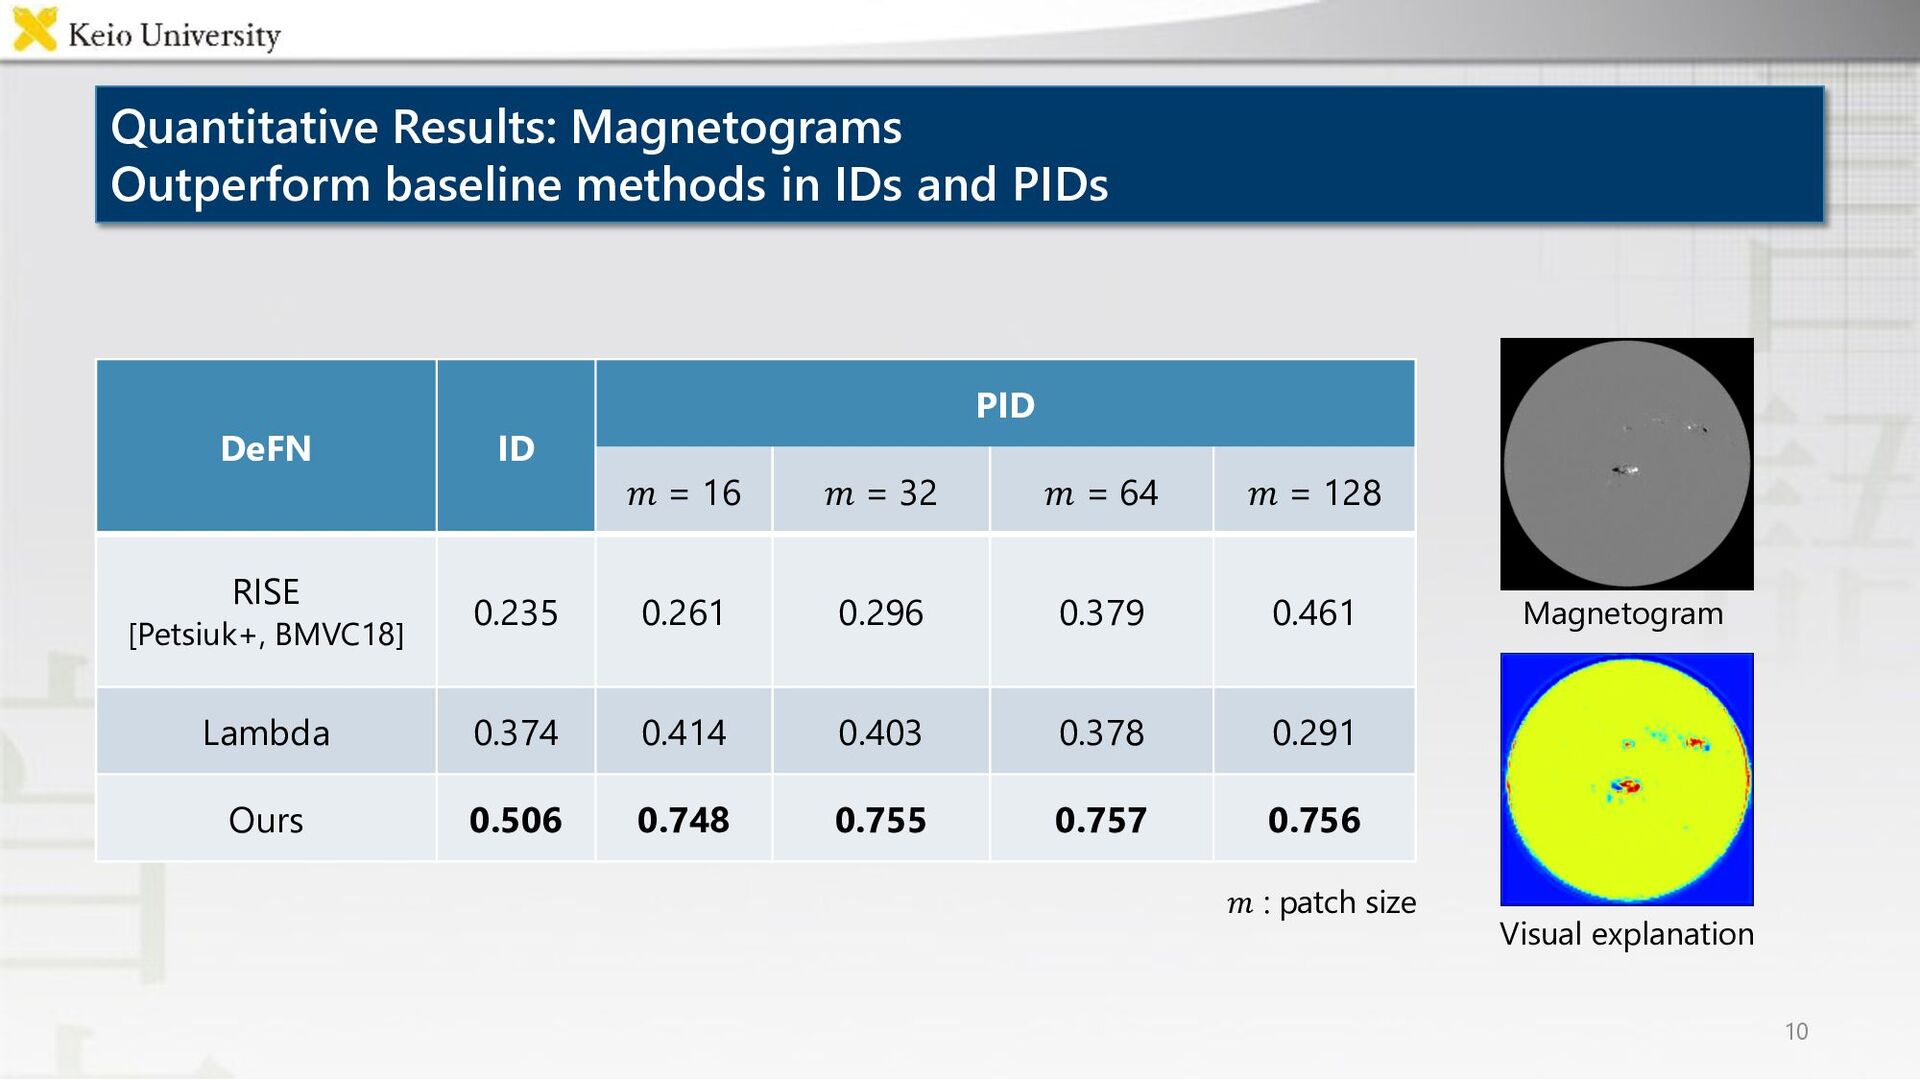
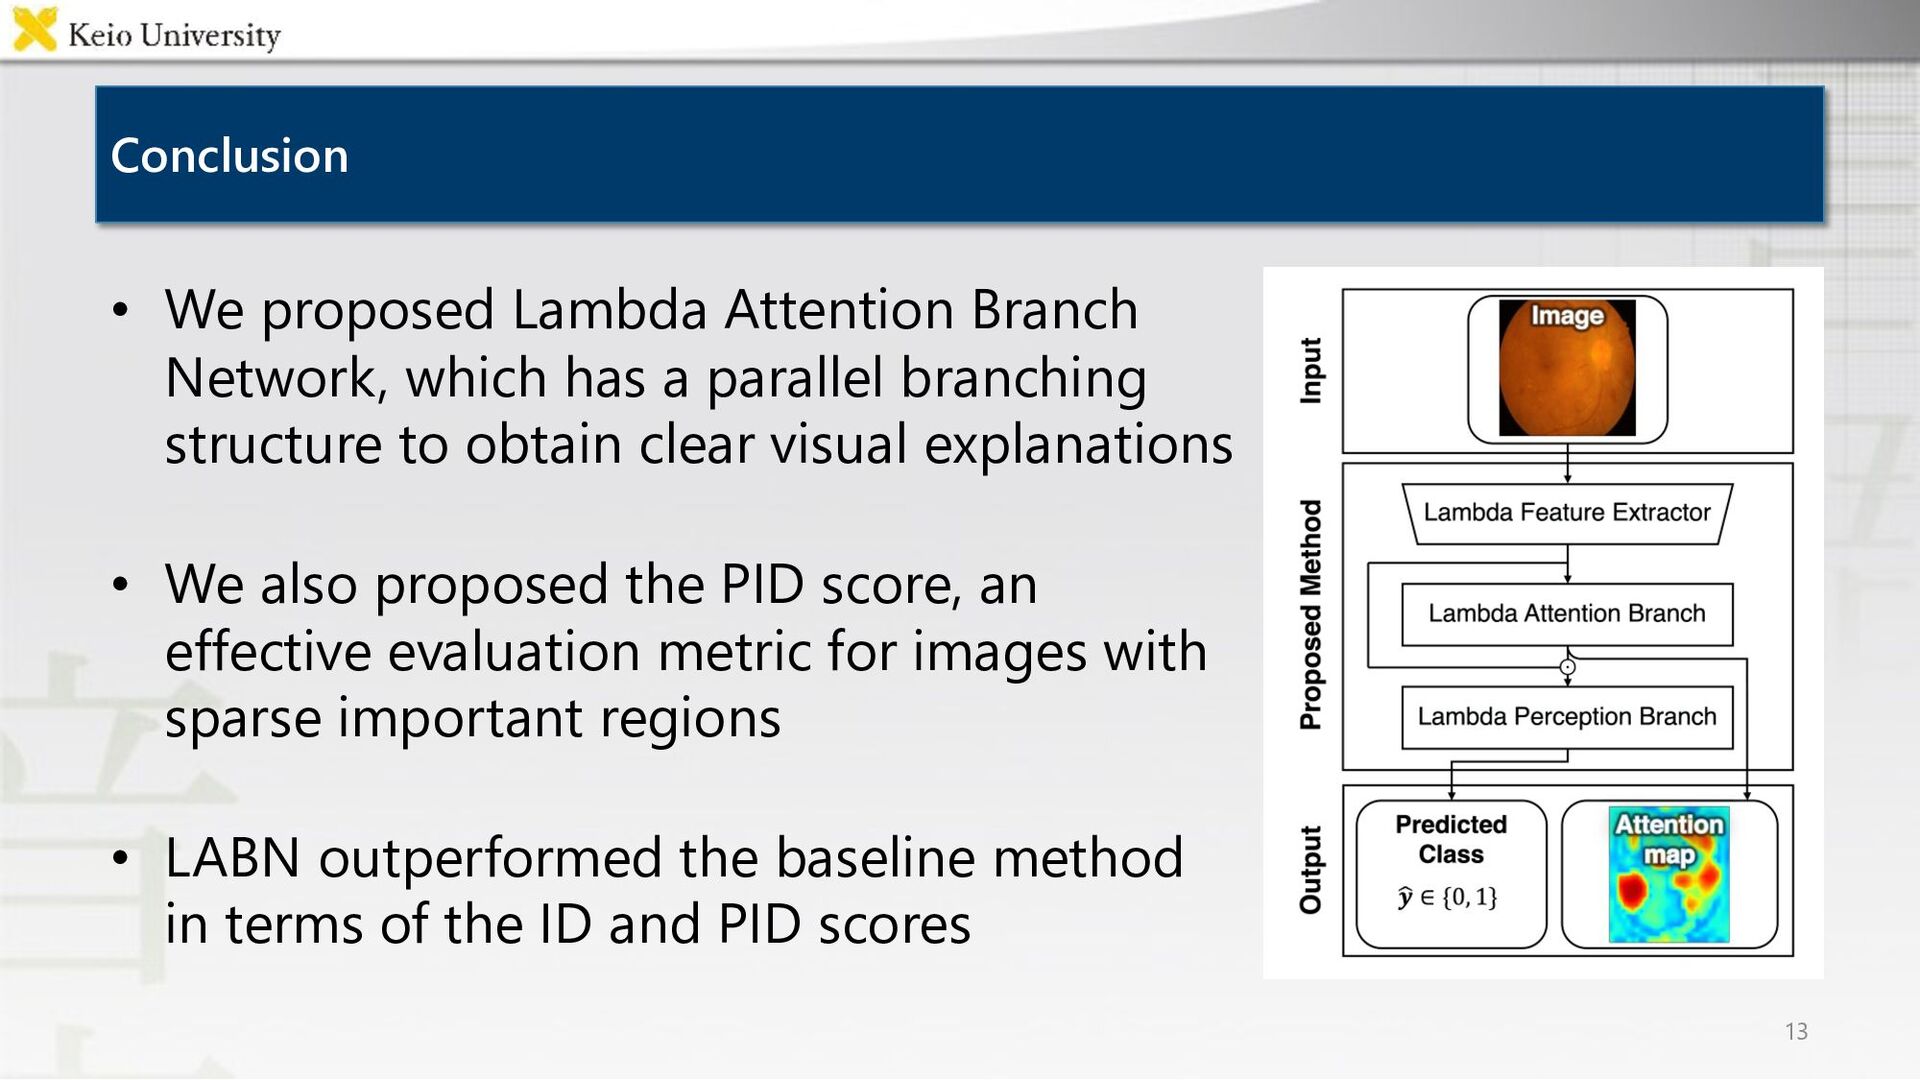
parallel branching structure to obtain clear visual explanations • We also proposed the PID score, an effective evaluation metric for images with sparse important regions • LABN outperformed the baseline method in terms of the ID and PID scores 13 Conclusion
![6 Proposed Method: Introduced Saliency–guided training [Ismail+, NeurIPS21] to reduce](https://files.speakerdeck.com/presentations/8261cc2589fb4bb39e19d916b978e9dd/slide_12.jpg)