and PostgreSQL of course. Work in PostgreSQL-Consulting: • Consulting, support, troubleshooting, profiling, training, etc... https://goo.gl/NYRFQV About me
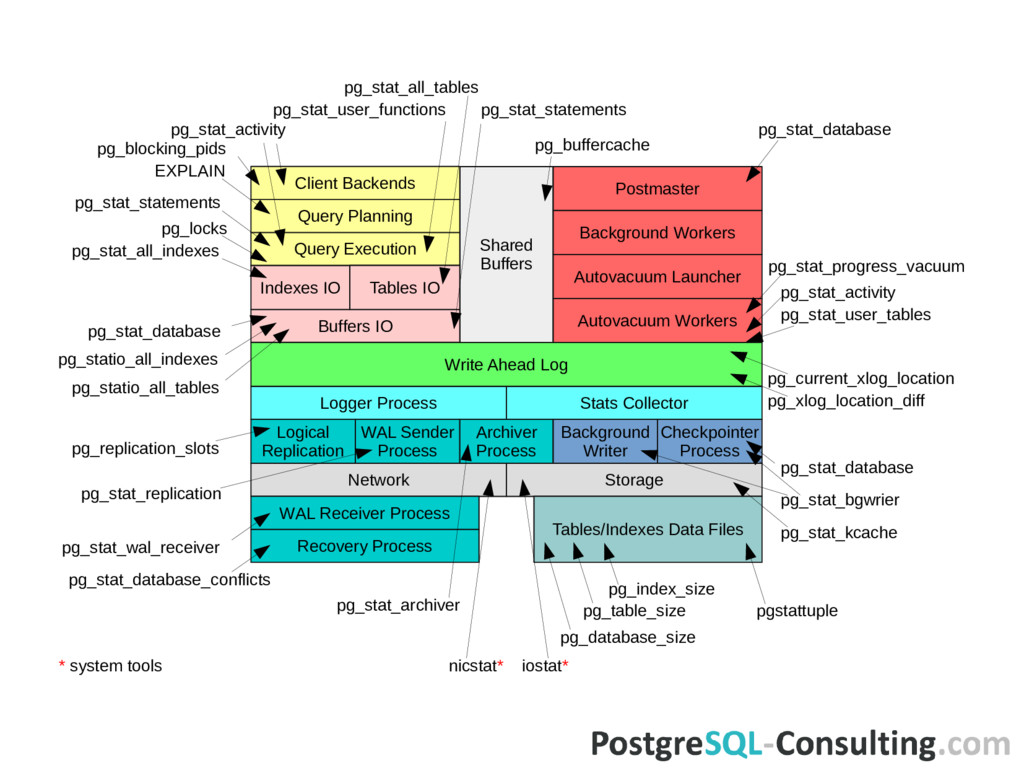
stats is quite easy. – Stats are provided as counters. – No history or what happened X minutes ago? – No builtin tools, only psql and hand-made queries. PostgreSQL statistics
9.x (9.0 ... 9.6). Linux only. Sources on Github. Packages: • ALT Linux; • RedHat/CentOS/Fedora (pgdg, epel-testing); • Ubuntu (Launchpad); What is the pgCenter
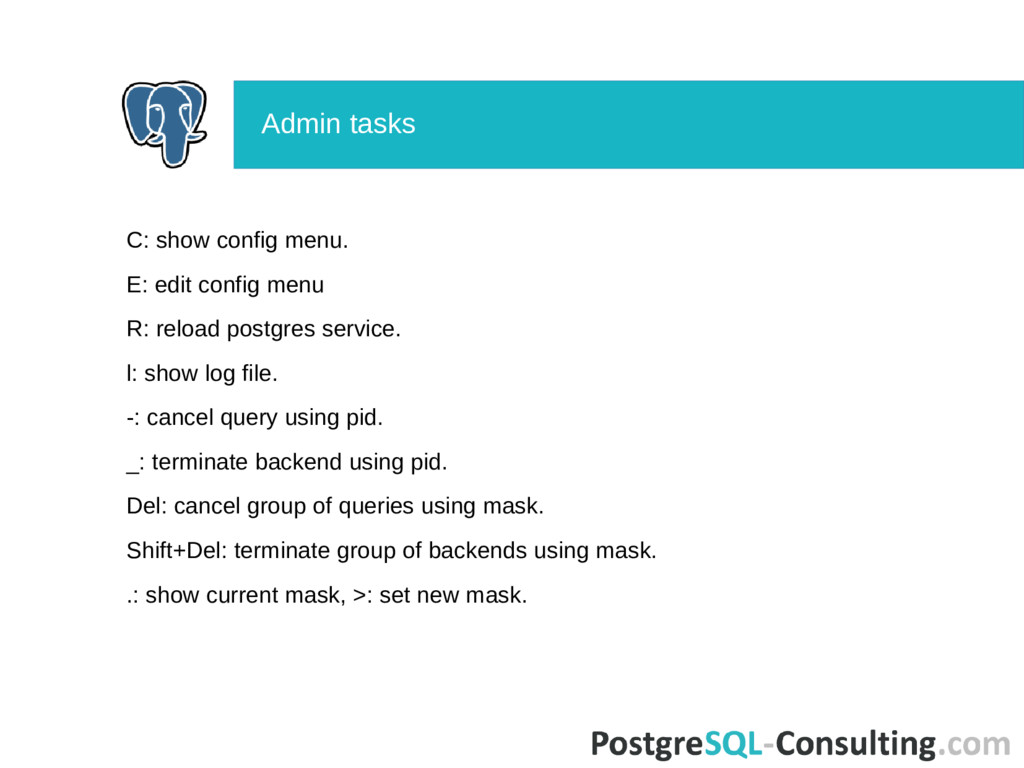
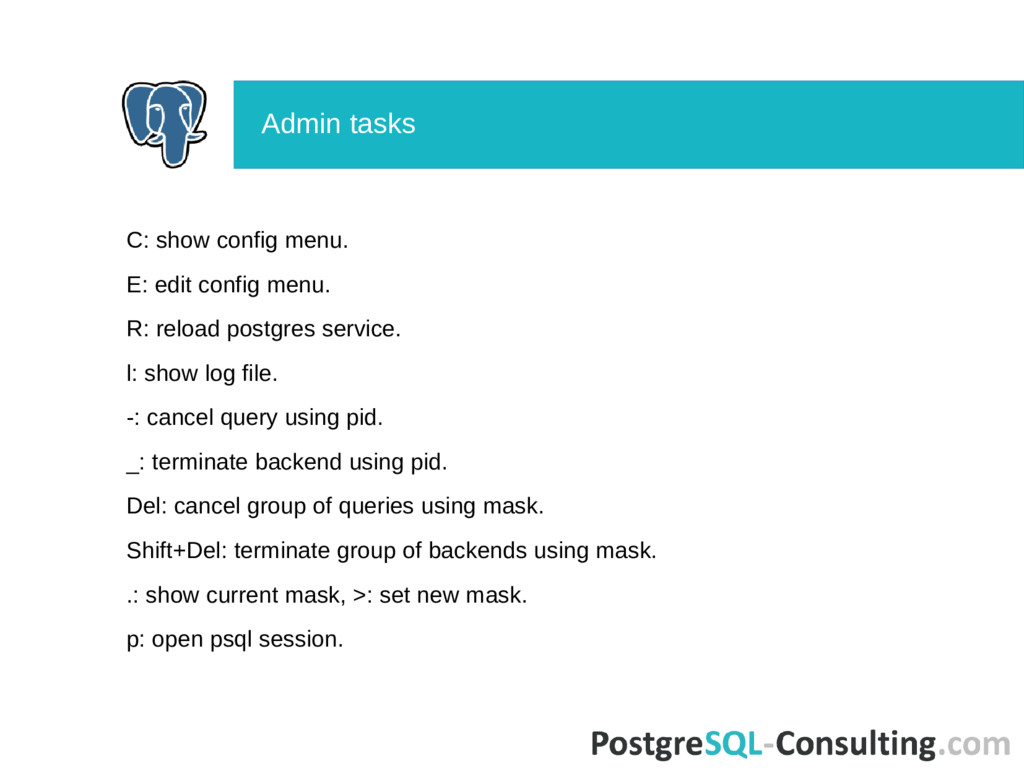
postgres service. l: show log file. -: сancel query using pid. _: terminate backend using pid. Del: cancel group of queries using mask. Shift+Del: terminate group of backends using mask. .: show current mask, >: set new mask. Admin tasks
postgres service. l: show log file. -: cancel query using pid. _: terminate backend using pid. Del: cancel group of queries using mask. Shift+Del: terminate group of backends using mask. .: show current mask, >: set new mask. p: open psql session. Admin tasks
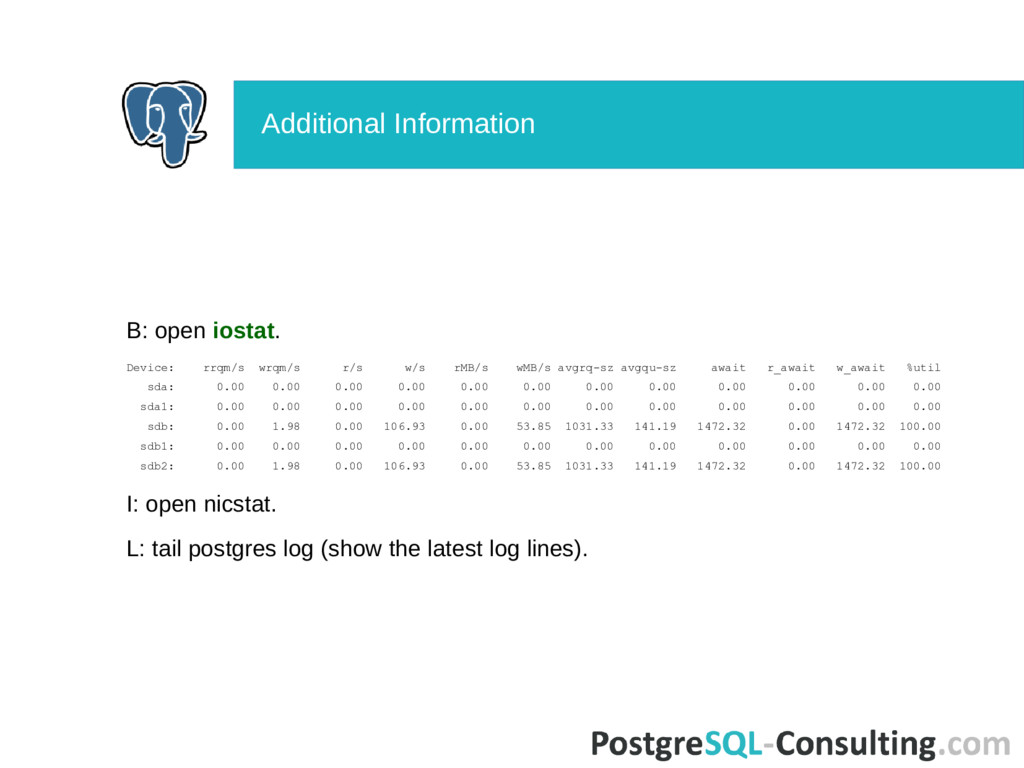
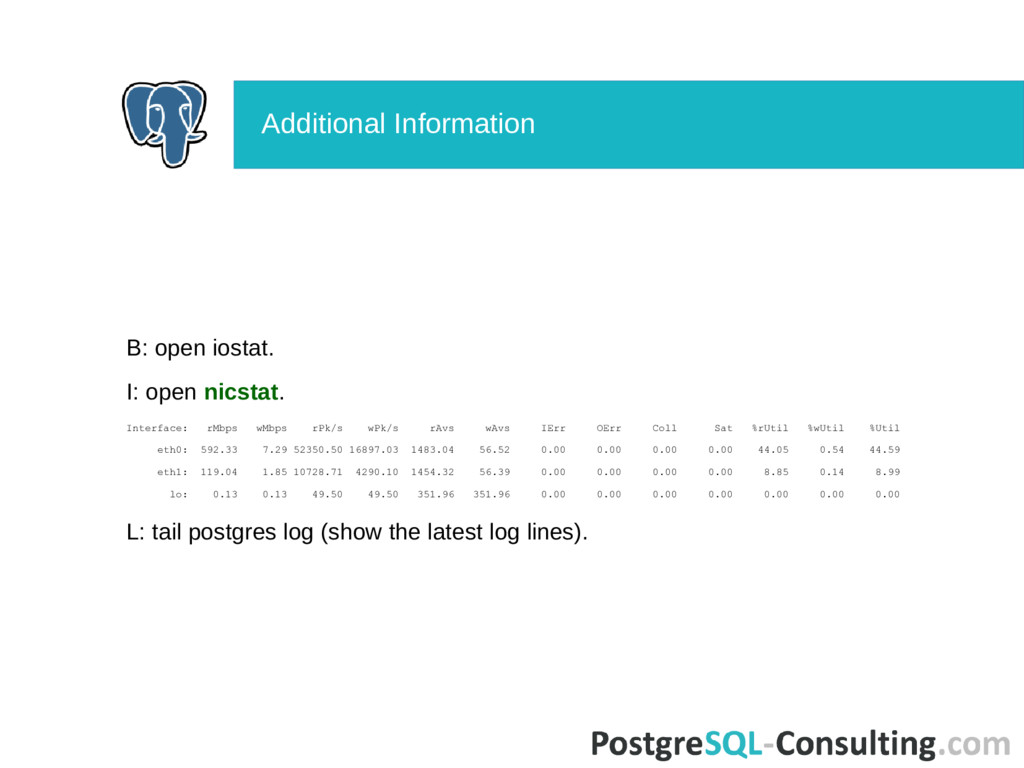
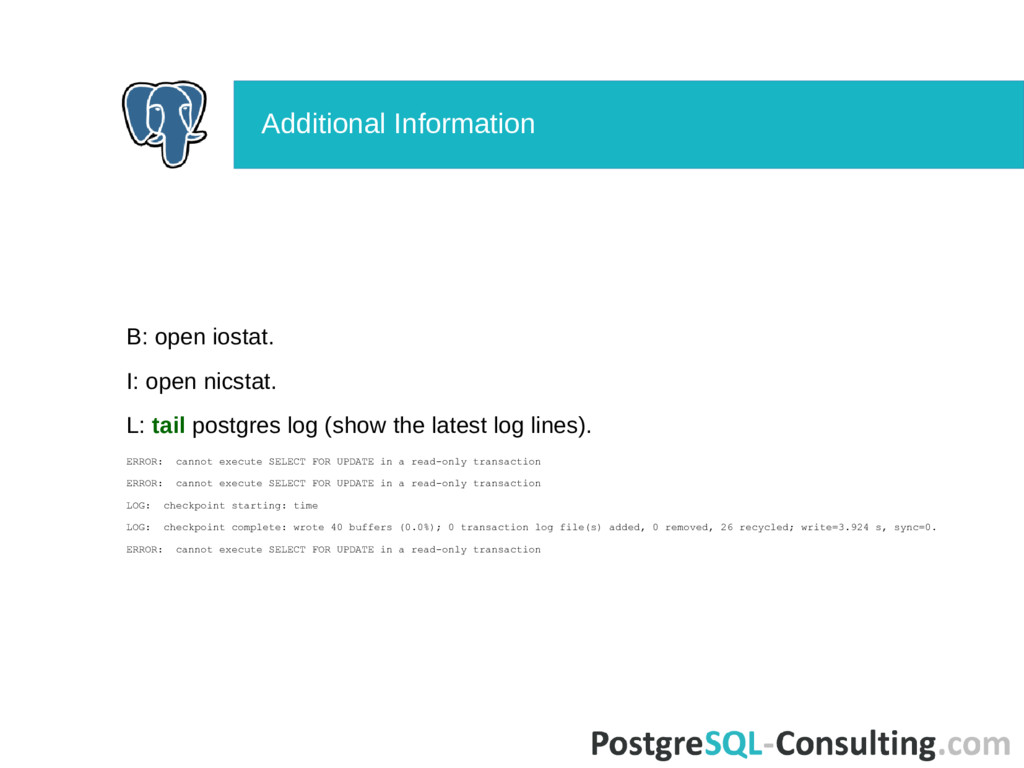
(show the latest log lines). ERROR: cannot execute SELECT FOR UPDATE in a read-only transaction ERROR: cannot execute SELECT FOR UPDATE in a read-only transaction LOG: checkpoint starting: time LOG: checkpoint complete: wrote 40 buffers (0.0%); 0 transaction log file(s) added, 0 removed, 26 recycled; write=3.924 s, sync=0. ERROR: cannot execute SELECT FOR UPDATE in a read-only transaction Additional Information
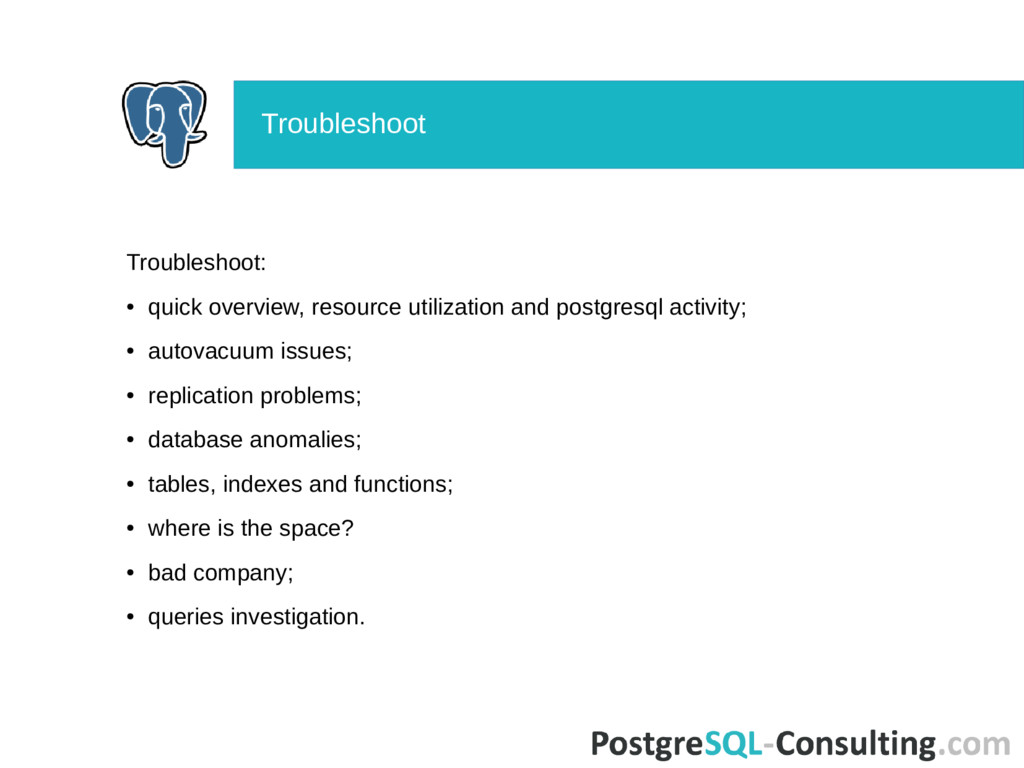
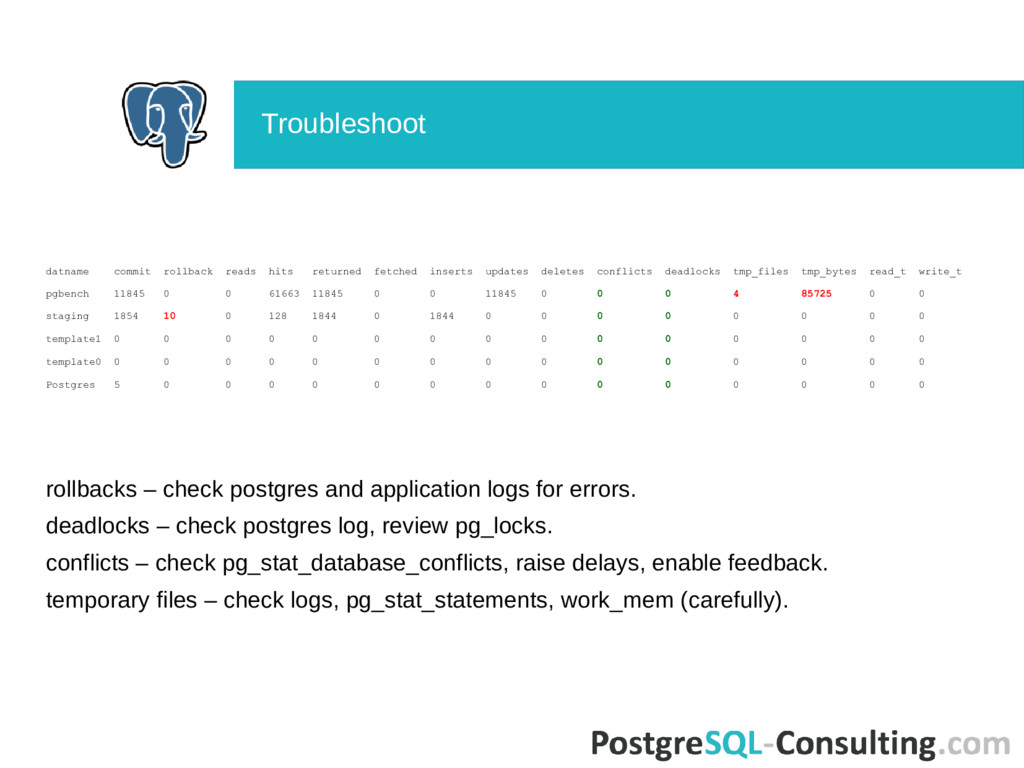
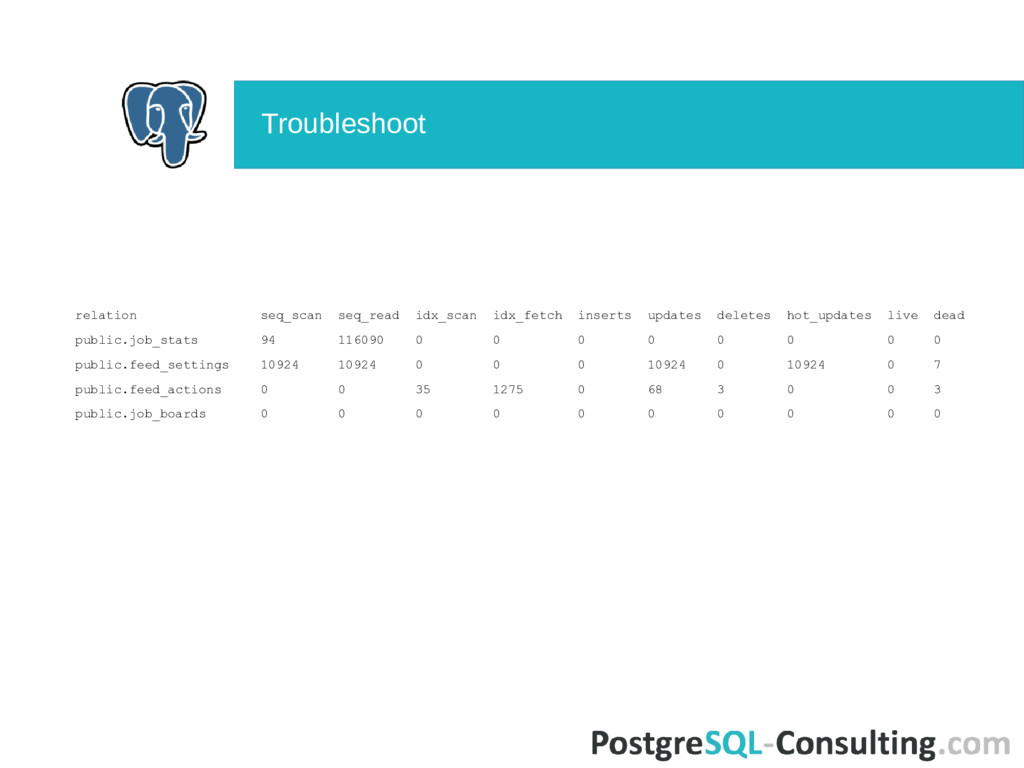
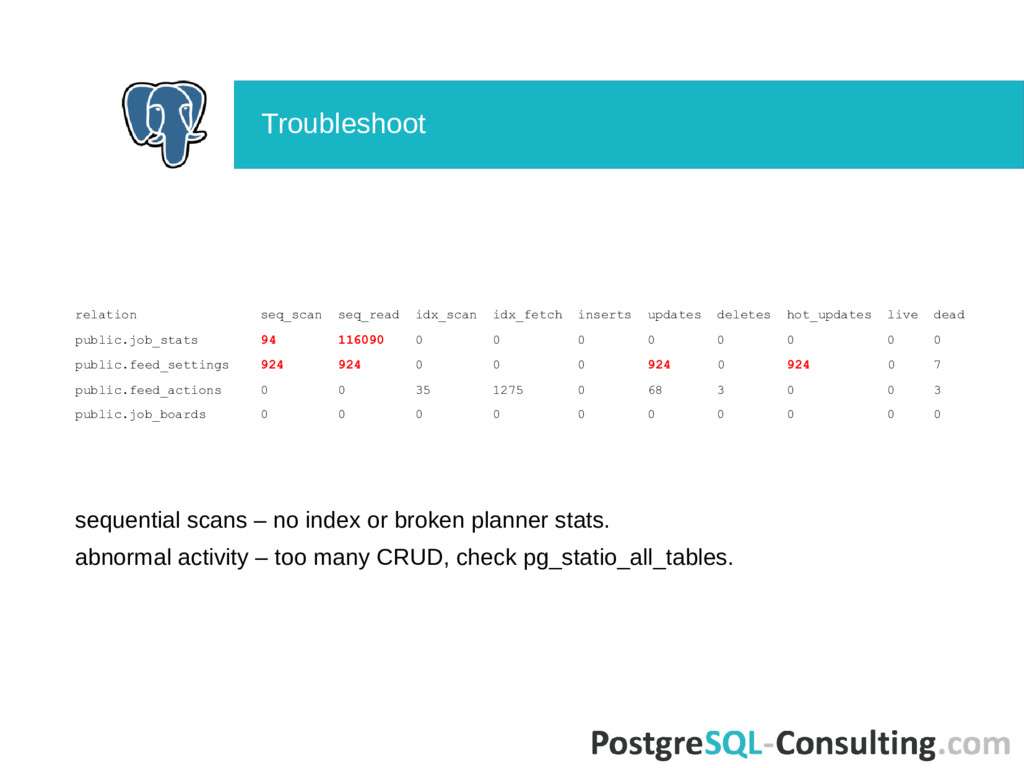
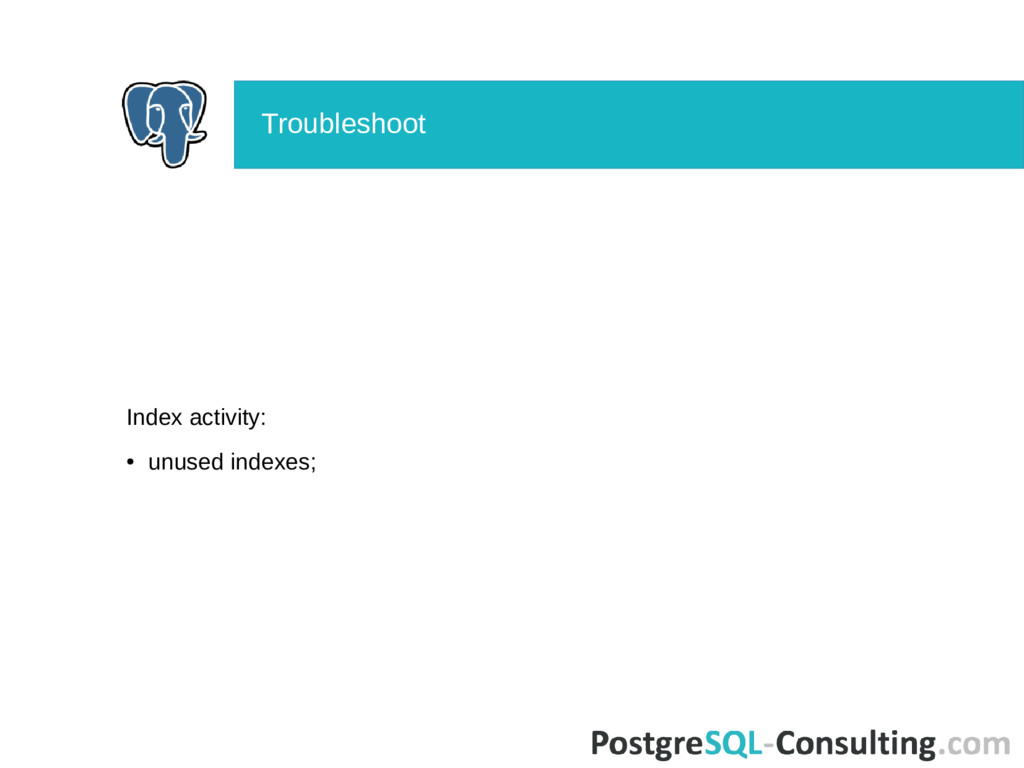
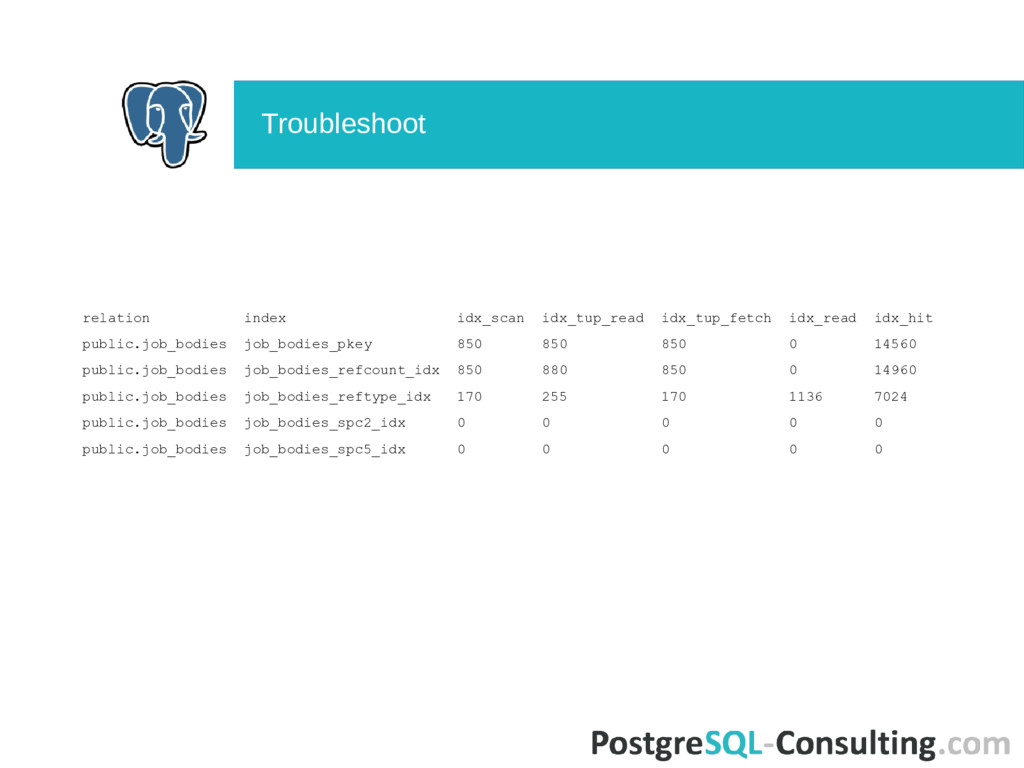
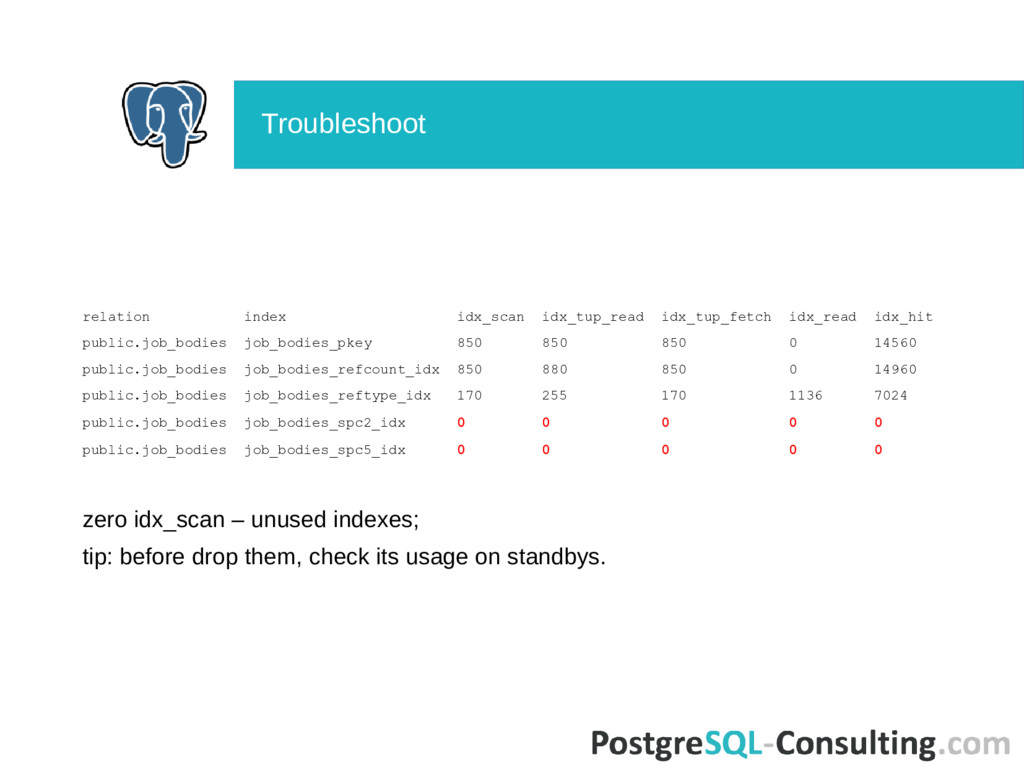
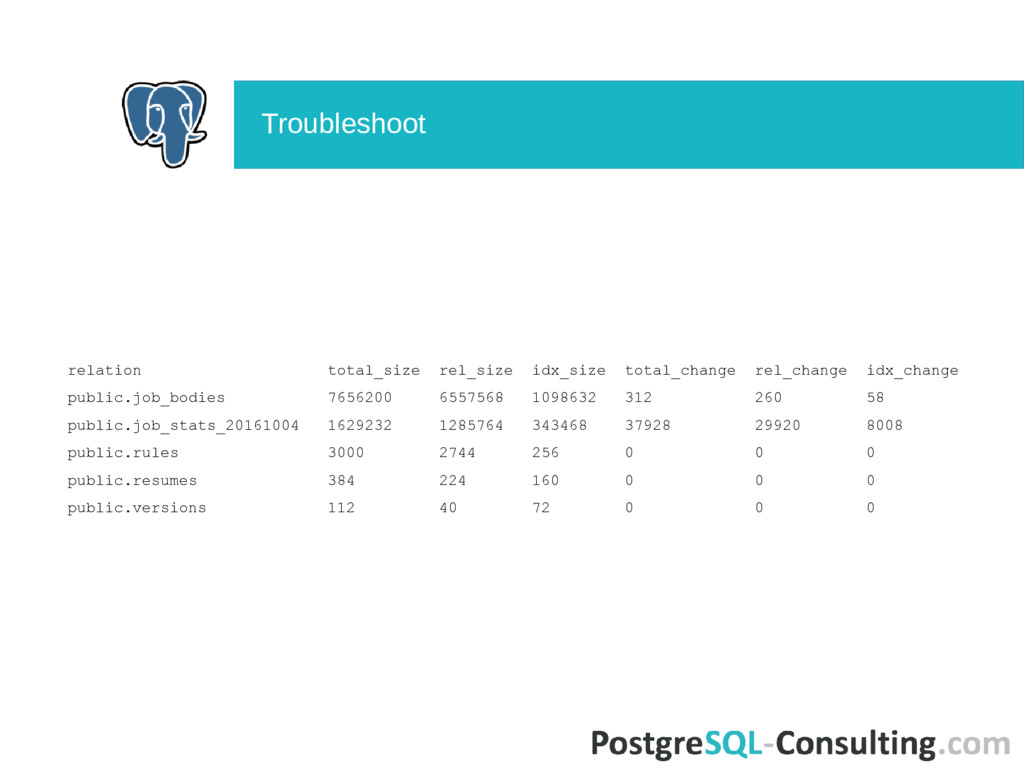
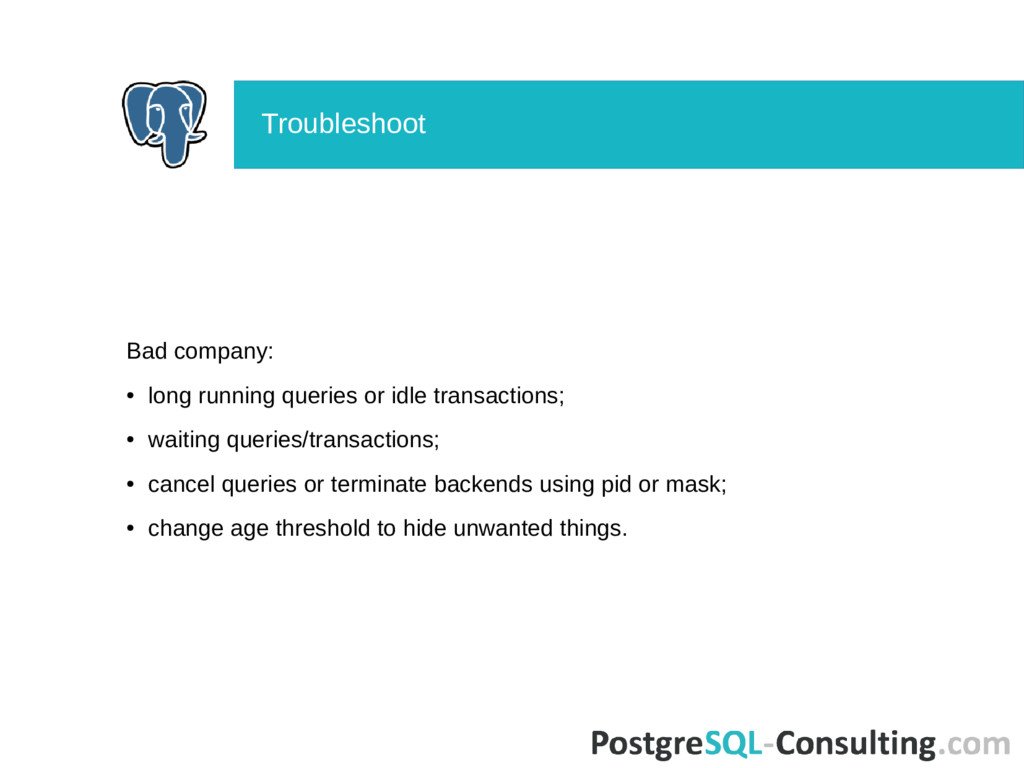
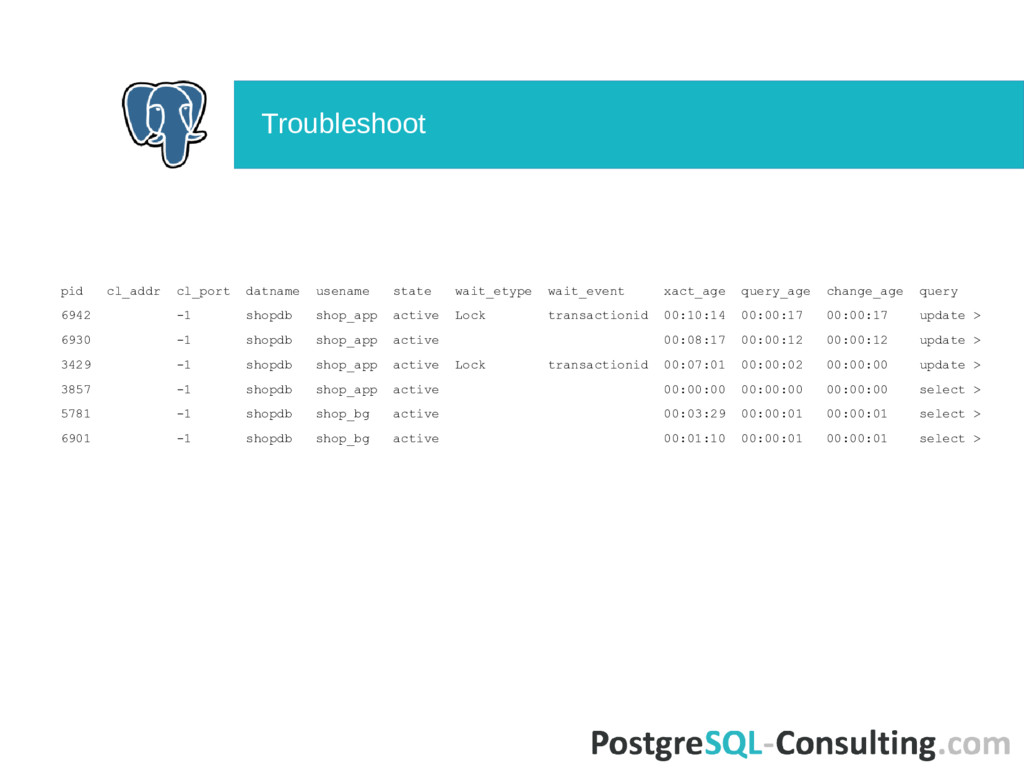
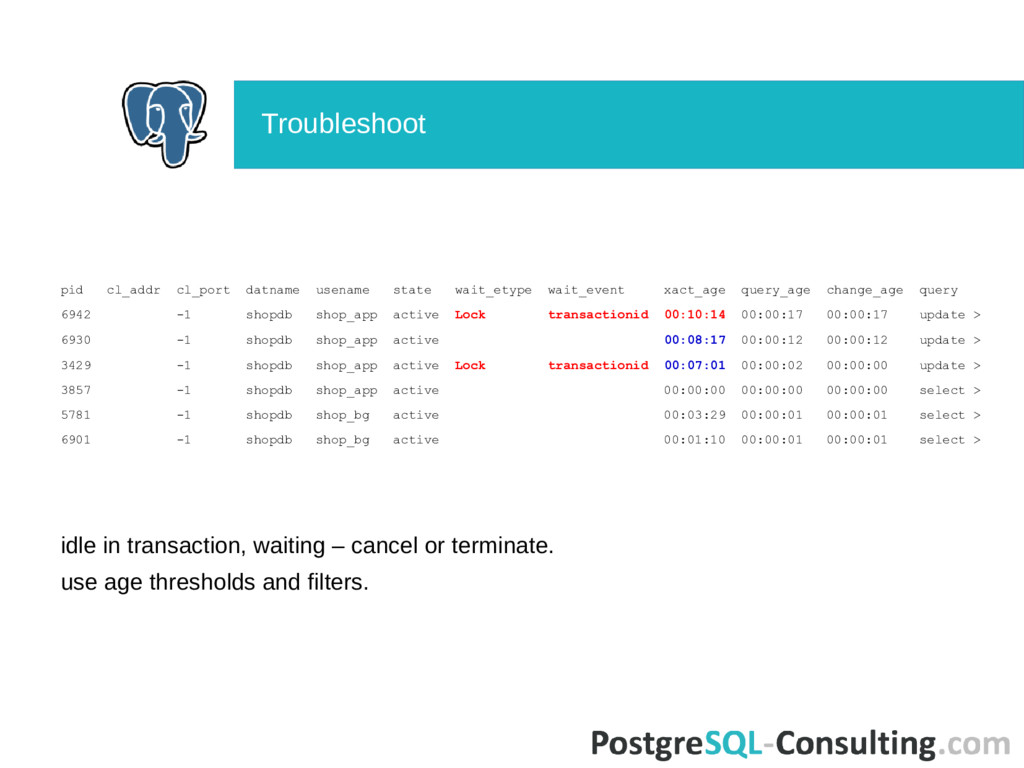
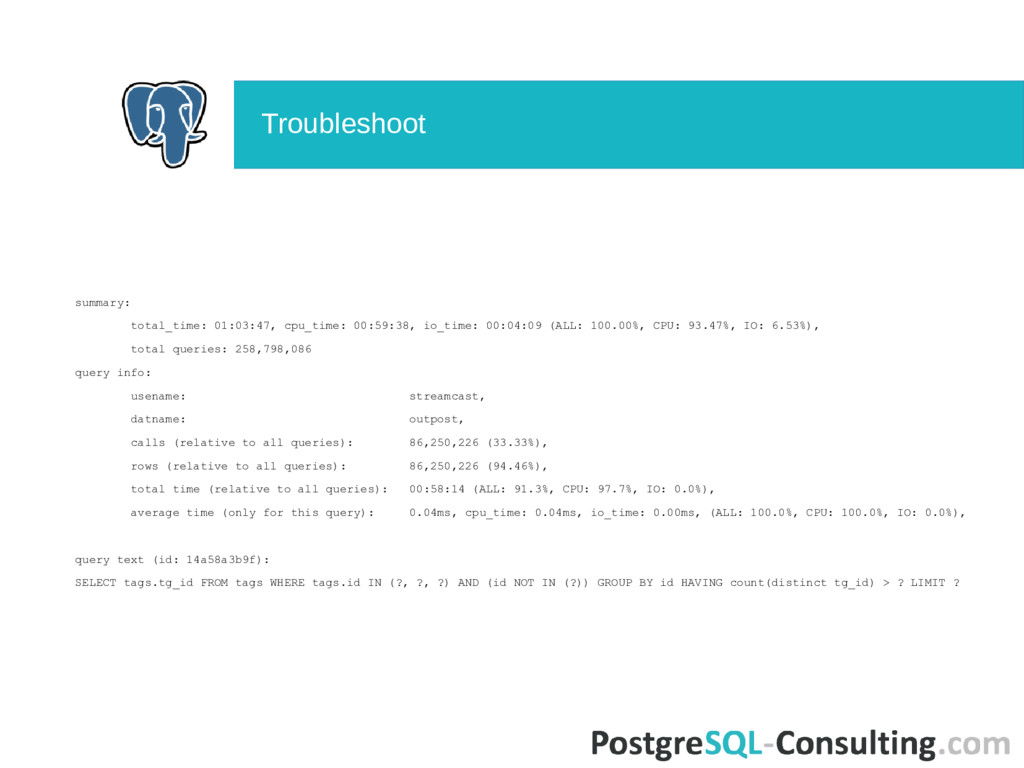
autovacuum issues; • replication problems; • database anomalies; • tables, indexes and functions; • where is the space? • bad company; • queries investigation. Troubleshoot
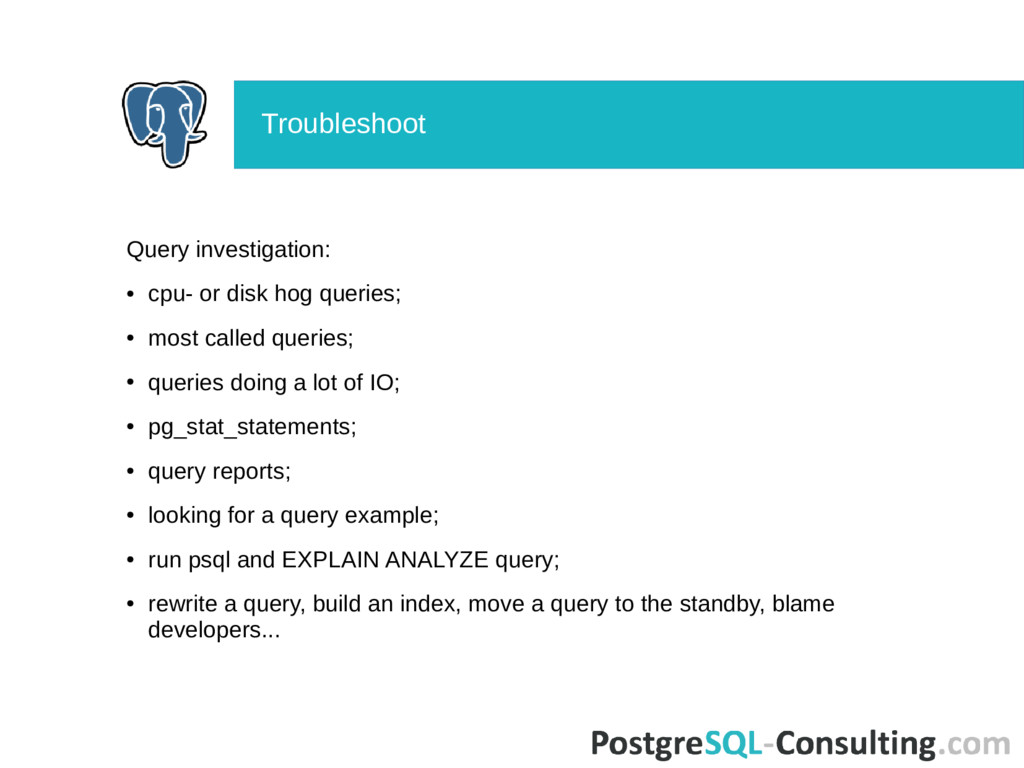
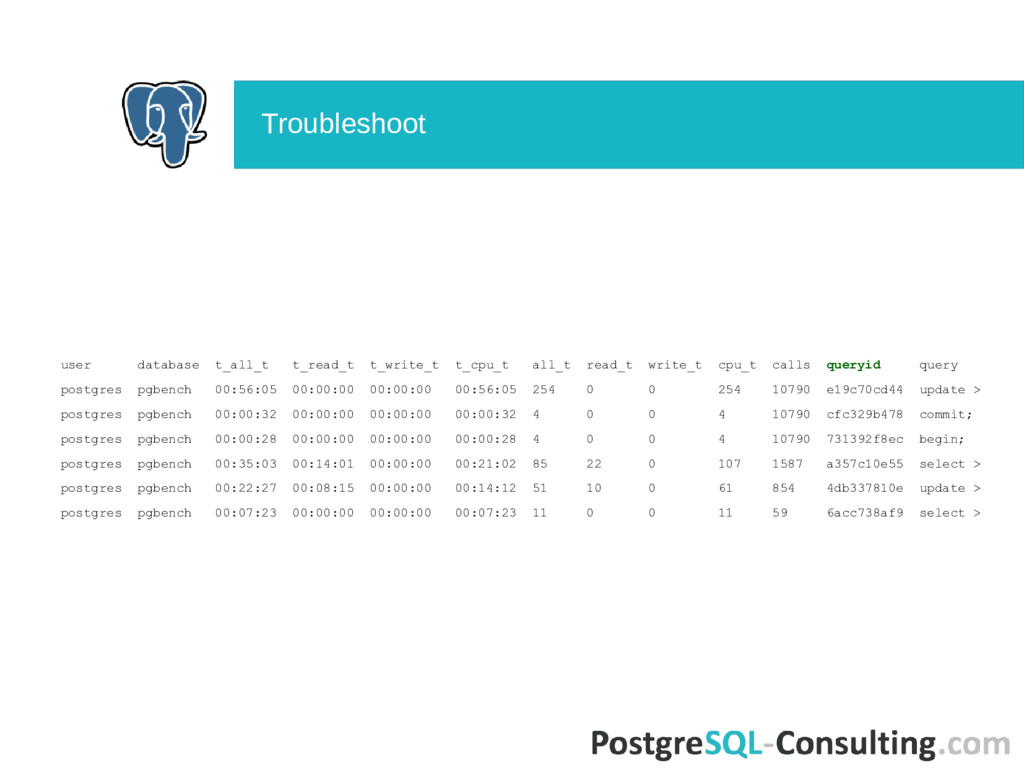
called queries; • queries doing a lot of IO; • pg_stat_statements; • query reports; • looking for a query example; • run psql and EXPLAIN ANALYZE query; • rewrite a query, build an index, move a query to the standby, blame developers... Troubleshoot
93.47%, IO: 6.53%), total queries: 258,798,086 query info: usename: streamcast, datname: outpost, calls (relative to all queries): 86,250,226 (33.33%), rows (relative to all queries): 86,250,226 (94.46%), total time (relative to all queries): 00:58:14 (ALL: 91.3%, CPU: 97.7%, IO: 0.0%), average time (only for this query): 0.04ms, cpu_time: 0.04ms, io_time: 0.00ms, (ALL: 100.0%, CPU: 100.0%, IO: 0.0%), query text (id: 14a58a3b9f): SELECT tags.tg_id FROM tags WHERE tags.id IN (?, ?, ?) AND (id NOT IN (?)) GROUP BY id HAVING count(distinct tg_id) > ? LIMIT ? Troubleshoot
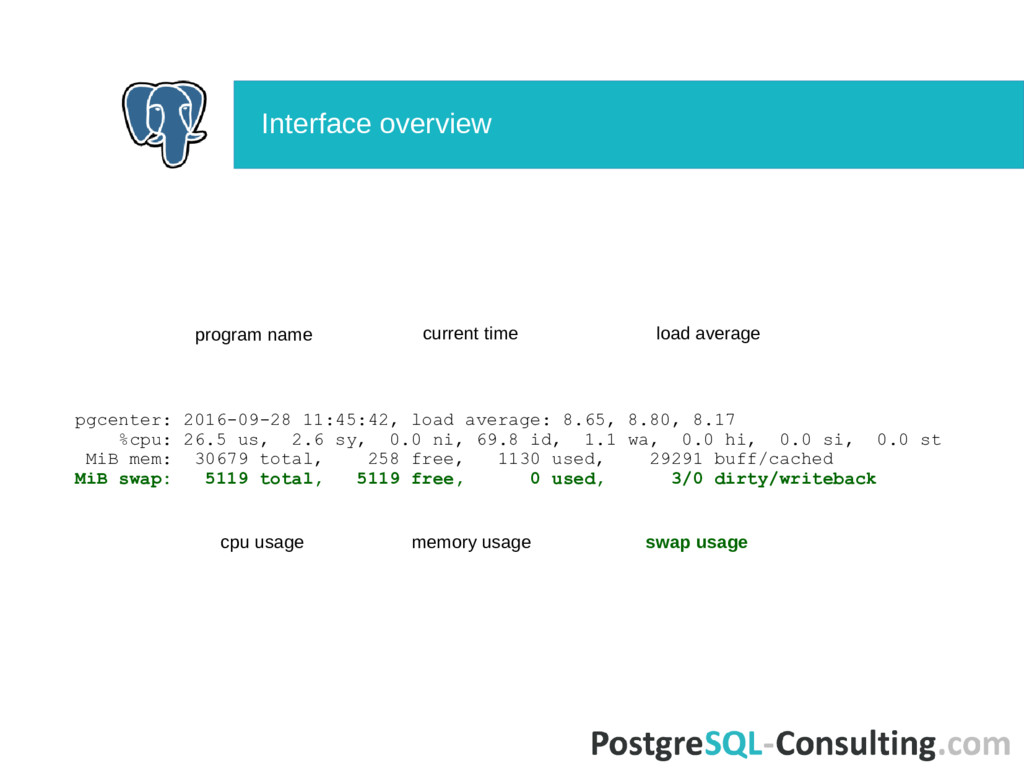
![pgcenter: 2016-09-28 11:45:42, load average: 8.65, 8.80, 8.17 conn1 [ok]:](https://files.speakerdeck.com/presentations/cd09cb1a9cba4444a17076f8bff9e464/slide_8.jpg)
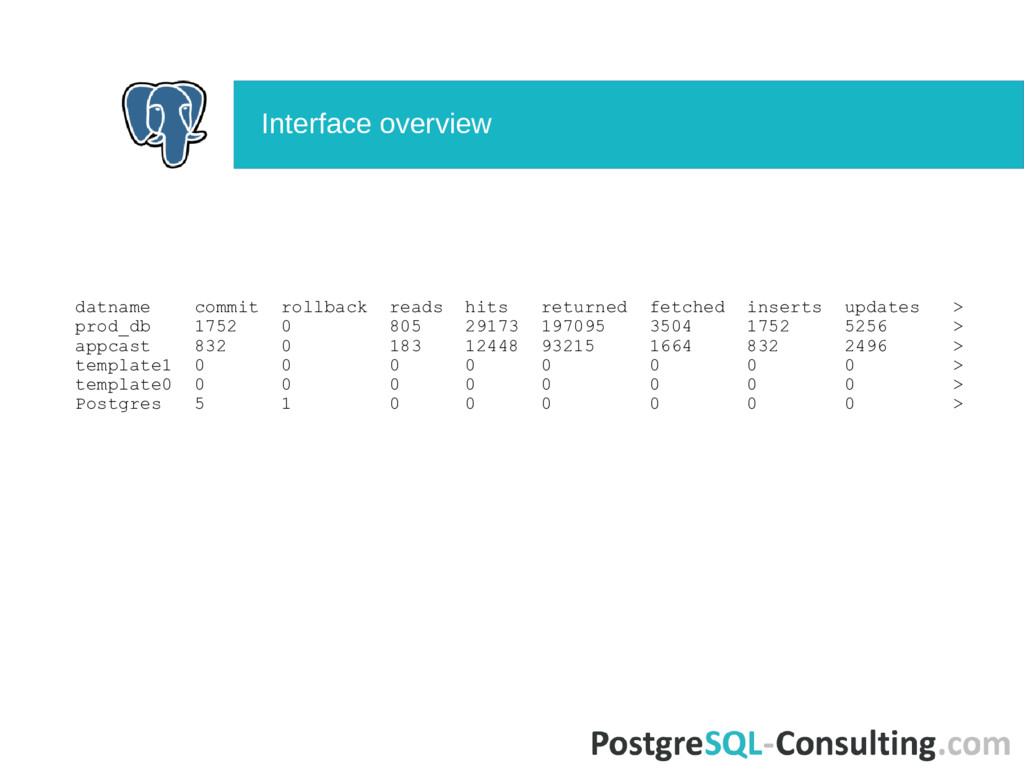
![pgcenter: 2016-09-28 11:45:42, load average: 8.65, 8.80, 8.17 conn1 [ok]:](https://files.speakerdeck.com/presentations/cd09cb1a9cba4444a17076f8bff9e464/slide_9.jpg)
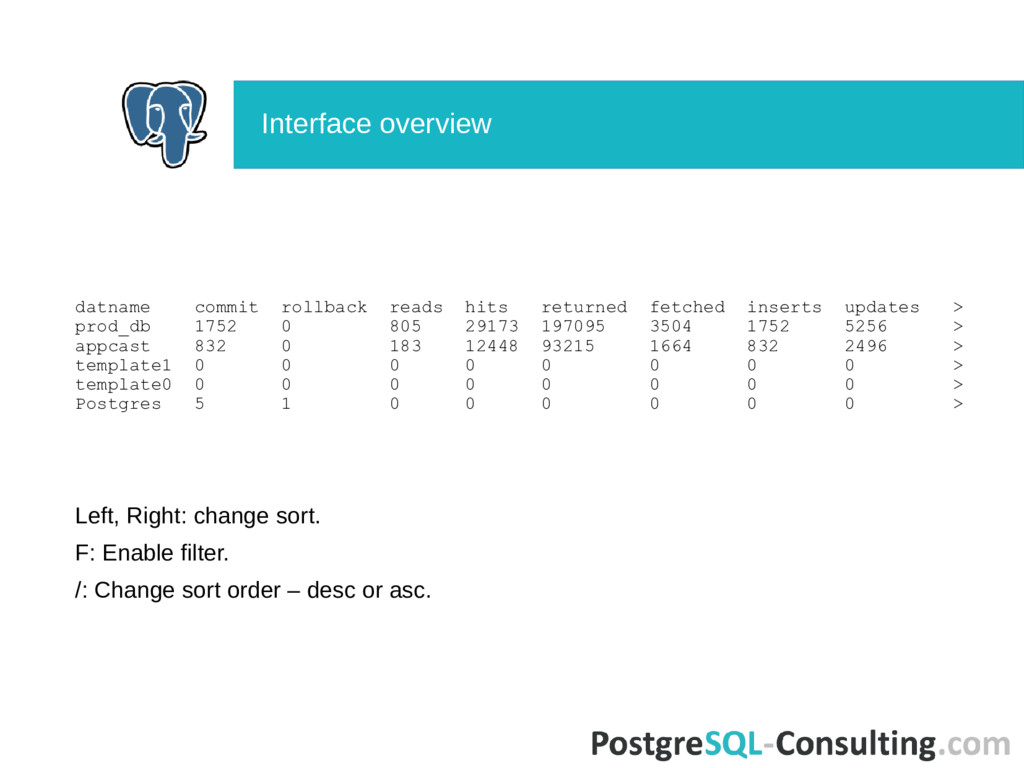
![pgcenter: 2016-09-28 11:45:42, load average: 8.65, 8.80, 8.17 conn1 [ok]:](https://files.speakerdeck.com/presentations/cd09cb1a9cba4444a17076f8bff9e464/slide_10.jpg)
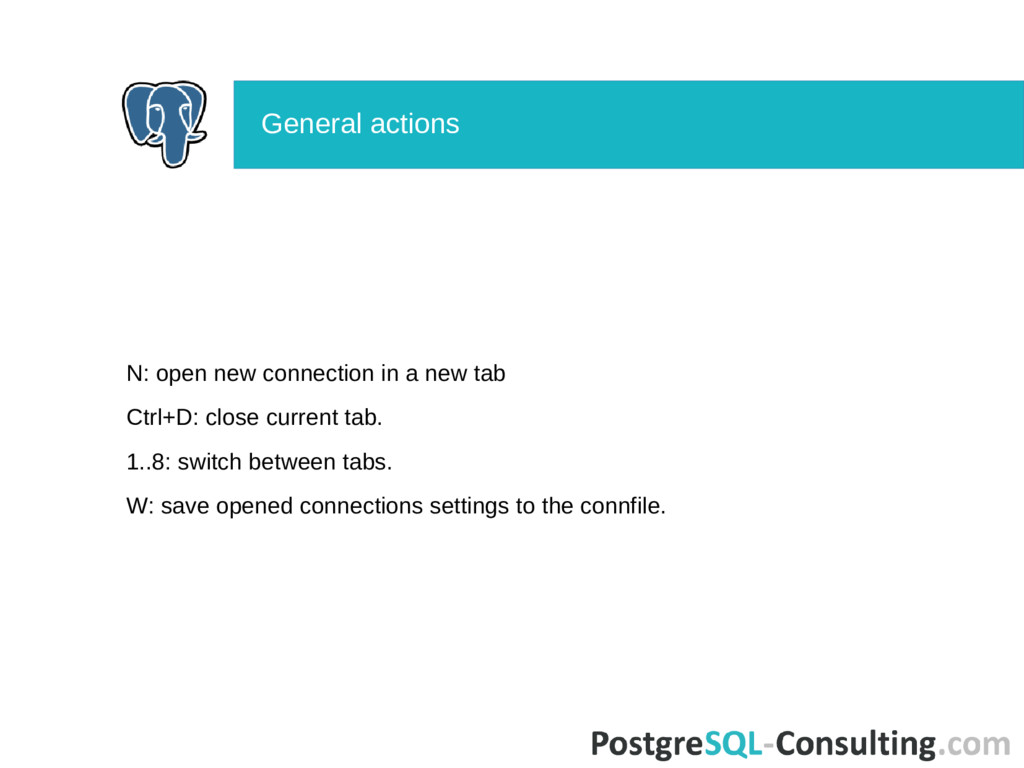
![pgcenter: 2016-09-28 11:45:42, load average: 8.65, 8.80, 8.17 conn1 [ok]:](https://files.speakerdeck.com/presentations/cd09cb1a9cba4444a17076f8bff9e464/slide_11.jpg)
![pgcenter: 2016-09-28 11:45:42, load average: 8.65, 8.80, 8.17 conn1 [ok]:](https://files.speakerdeck.com/presentations/cd09cb1a9cba4444a17076f8bff9e464/slide_12.jpg)
![conn1 [ok]: 127.0.0.1:5432 postgres@postgres (ver: 9.6.0, up 00:29:28) activity: 25](https://files.speakerdeck.com/presentations/cd09cb1a9cba4444a17076f8bff9e464/slide_17.jpg)
![conn1 [ok]: 127.0.0.1:5432 postgres@postgres (ver: 9.6.0, up 00:29:28) activity: 25](https://files.speakerdeck.com/presentations/cd09cb1a9cba4444a17076f8bff9e464/slide_18.jpg)
![conn1 [ok]: 127.0.0.1:5432 postgres@postgres (ver: 9.6.0, up 00:29:28) activity: 25](https://files.speakerdeck.com/presentations/cd09cb1a9cba4444a17076f8bff9e464/slide_19.jpg)
![conn1 [ok]: 127.0.0.1:5432 postgres@postgres (ver: 9.6.0, up 00:29:28) activity: 25](https://files.speakerdeck.com/presentations/cd09cb1a9cba4444a17076f8bff9e464/slide_20.jpg)
![conn1 [ok]: 127.0.0.1:5432 postgres@postgres (ver: 9.6.0, up 05:02:50) activity: 44](https://files.speakerdeck.com/presentations/cd09cb1a9cba4444a17076f8bff9e464/slide_38.jpg)
![conn1 [ok]: 127.0.0.1:5432 postgres@postgres (ver: 9.6.0, up 05:02:50) activity: 44](https://files.speakerdeck.com/presentations/cd09cb1a9cba4444a17076f8bff9e464/slide_39.jpg)
![Alexey Lesovsky [email protected] PostgreSQL–Consulting: Data maintenance as its best. http://postgresql-consulting.com](https://files.speakerdeck.com/presentations/cd09cb1a9cba4444a17076f8bff9e464/slide_63.jpg)