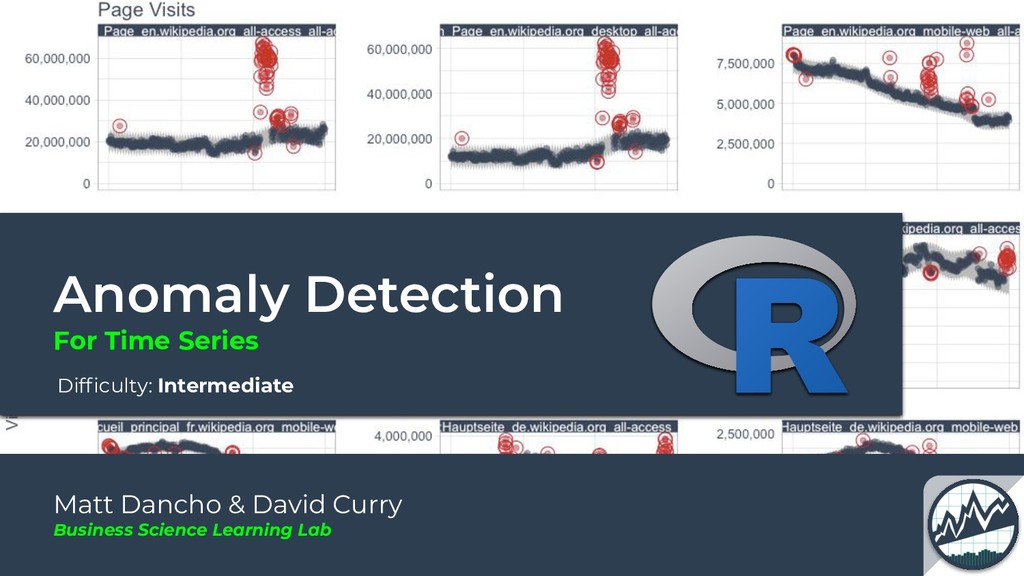
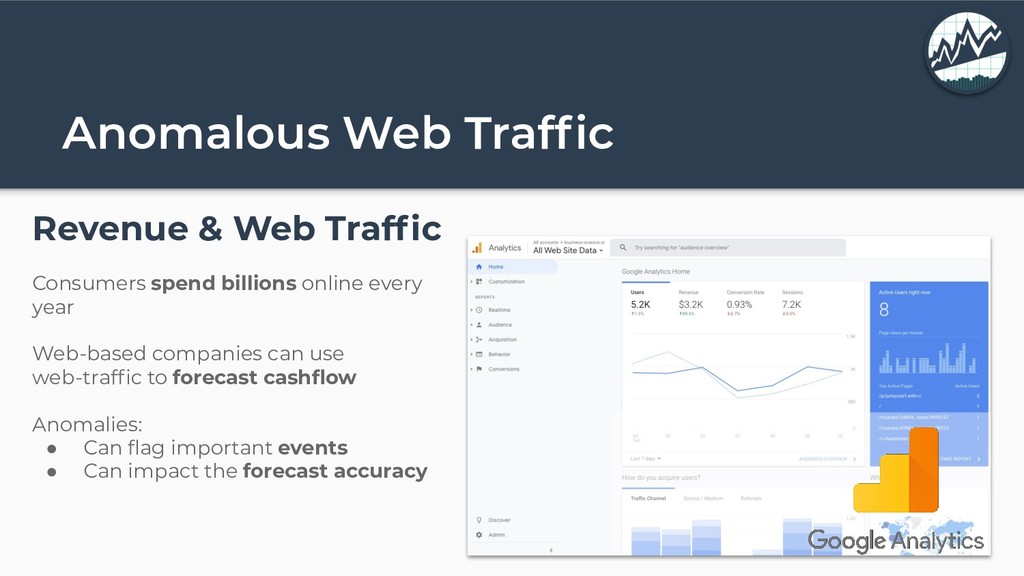
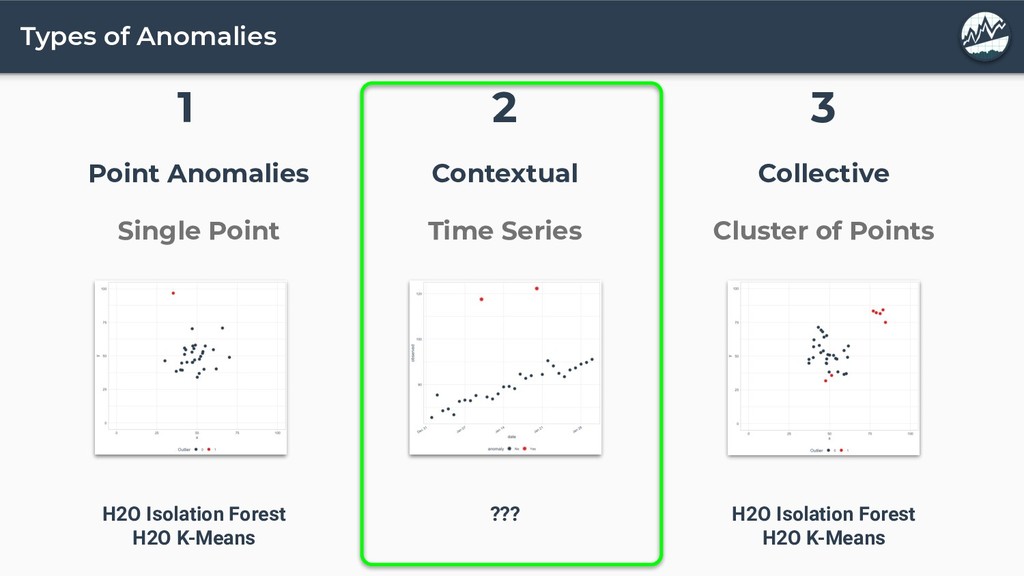
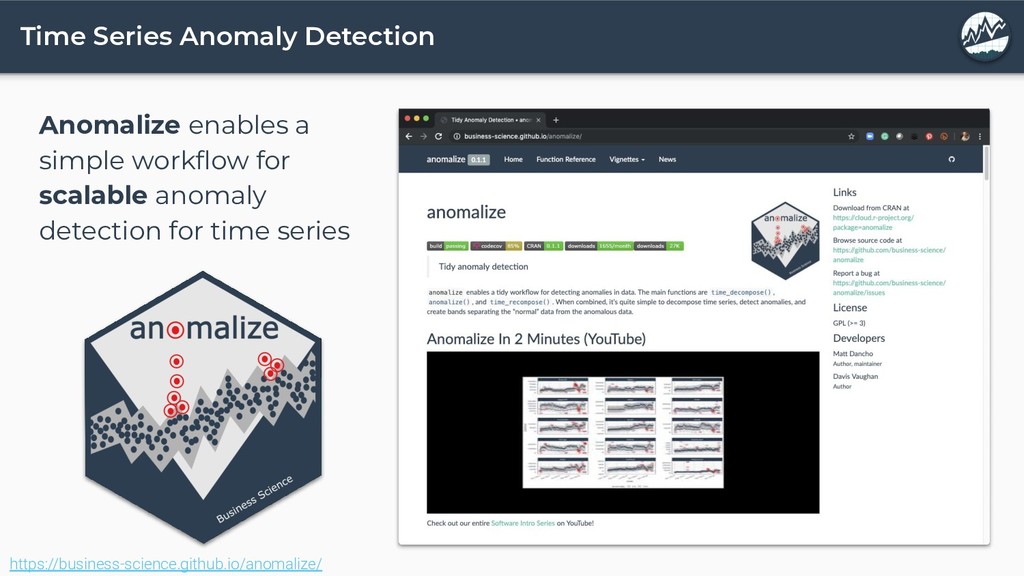
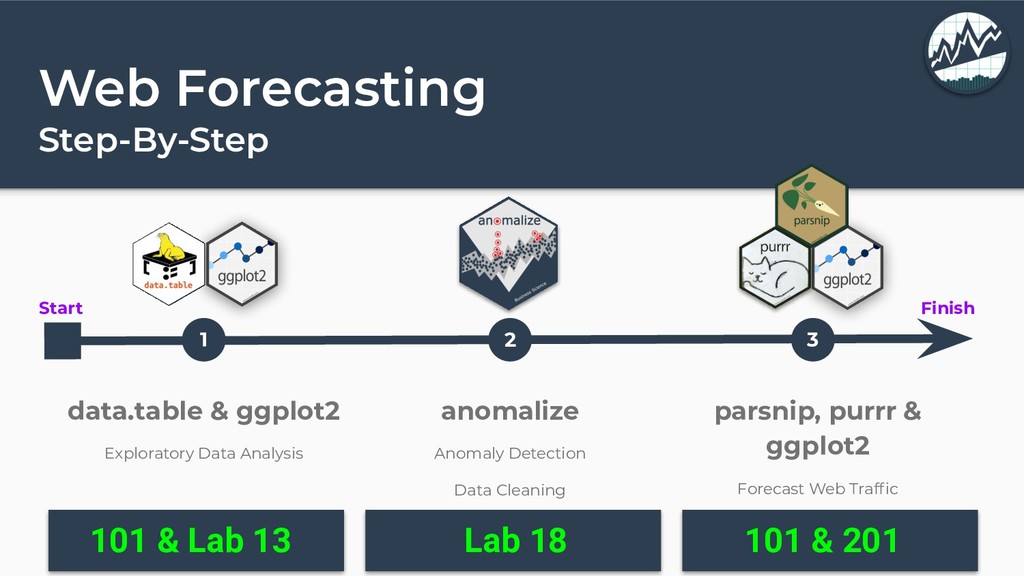
Detecting anomalies in time series can signify critical events and can improve forecasting results substantially. In this lab, you'll learn how to implement scalable time series anomaly detection with the anomalize R package.
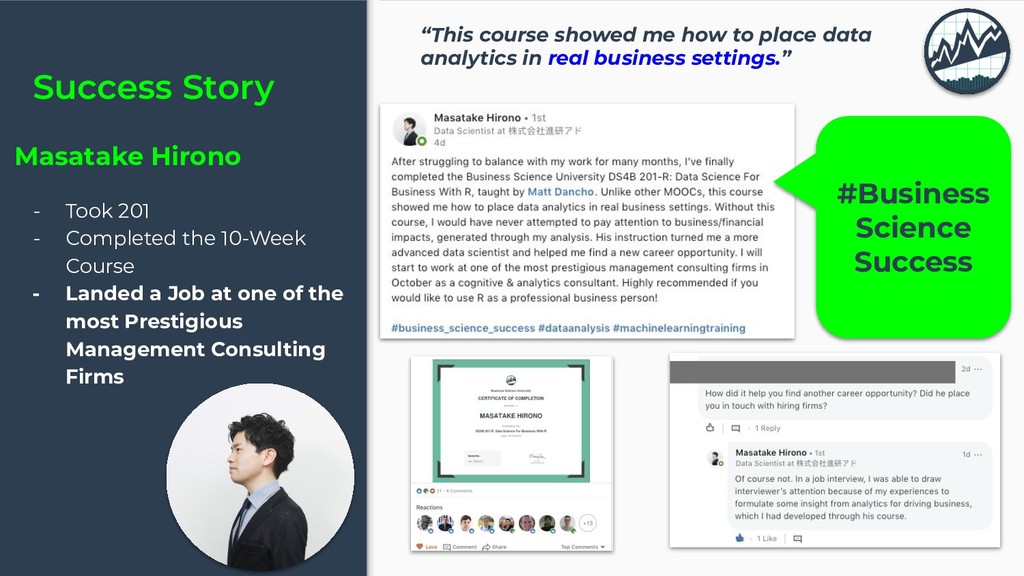
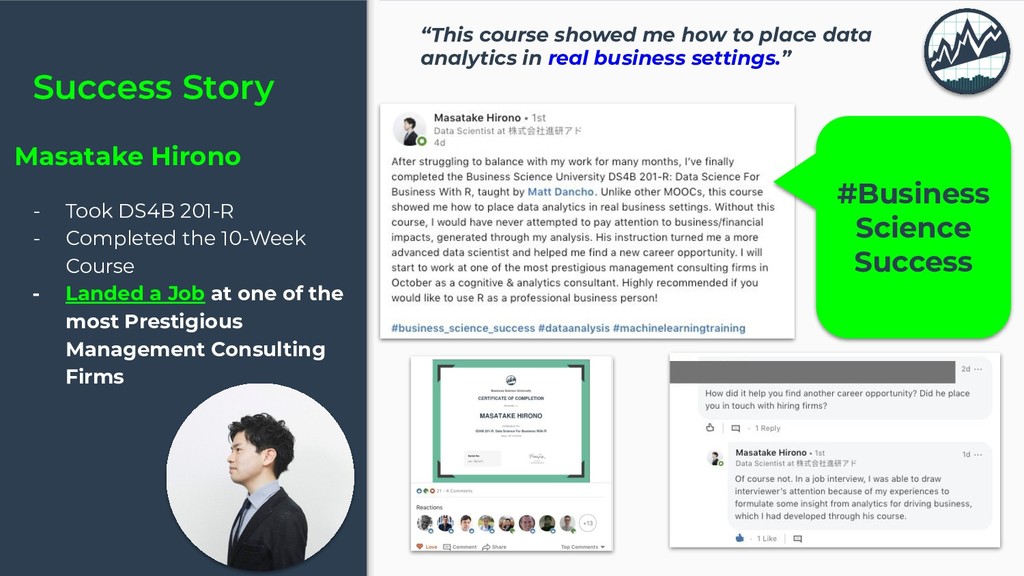
10-Week Course - Landed a Job at one of the most Prestigious Management Consulting Firms “This course showed me how to place data analytics in real business settings.” #Business Science Success
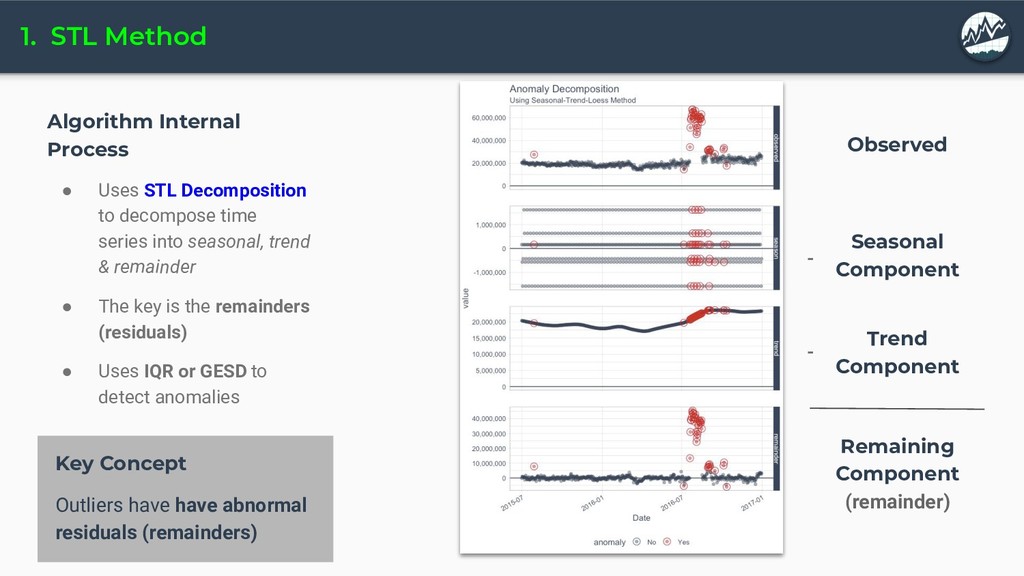
to decompose time series into seasonal, trend & remainder • The key is the remainders (residuals) • Uses IQR or GESD to detect anomalies Key Concept Outliers have have abnormal residuals (remainders) Observed Seasonal Component Trend Component Remaining Component (remainder) - -
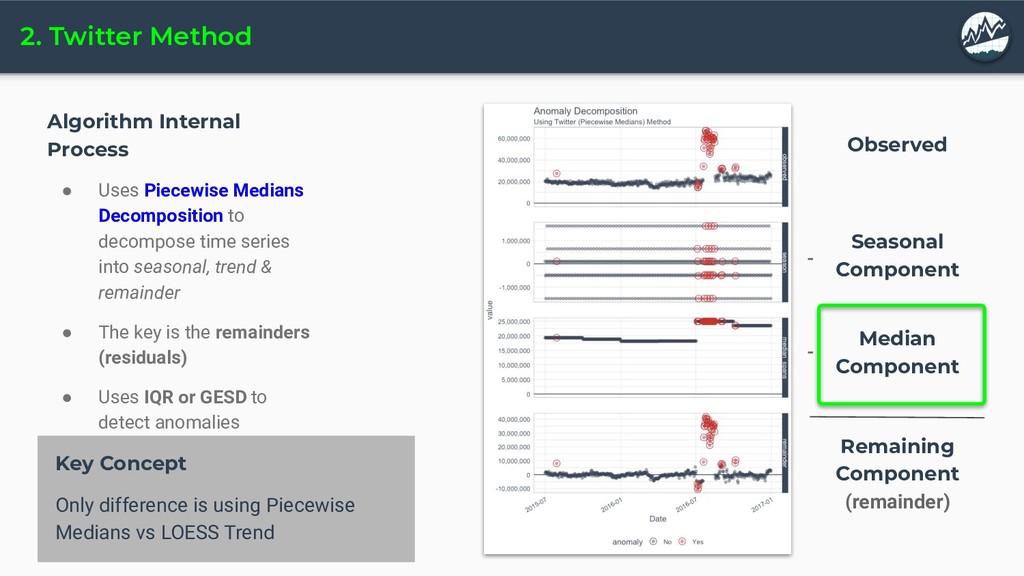
Decomposition to decompose time series into seasonal, trend & remainder • The key is the remainders (residuals) • Uses IQR or GESD to detect anomalies Key Concept Only difference is using Piecewise Medians vs LOESS Trend Observed Seasonal Component Median Component Remaining Component (remainder) - -
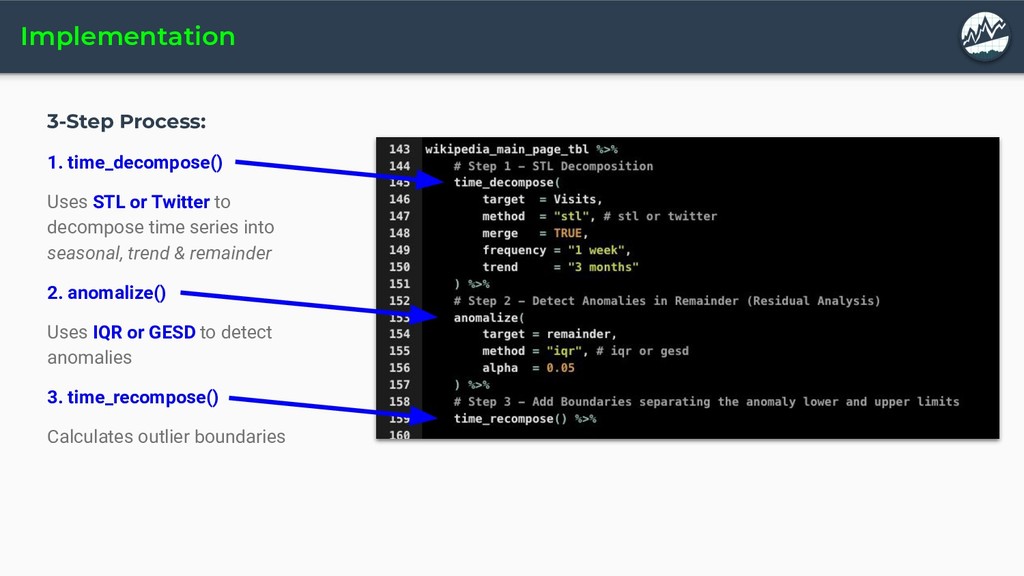
decompose time series into seasonal, trend & remainder 2. anomalize() Uses IQR or GESD to detect anomalies 3. time_recompose() Calculates outlier boundaries
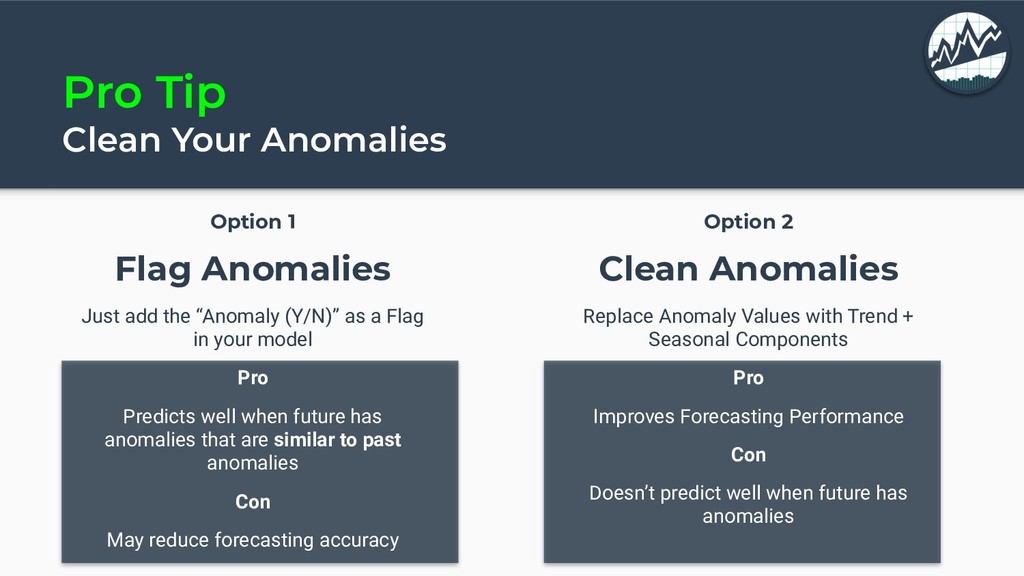
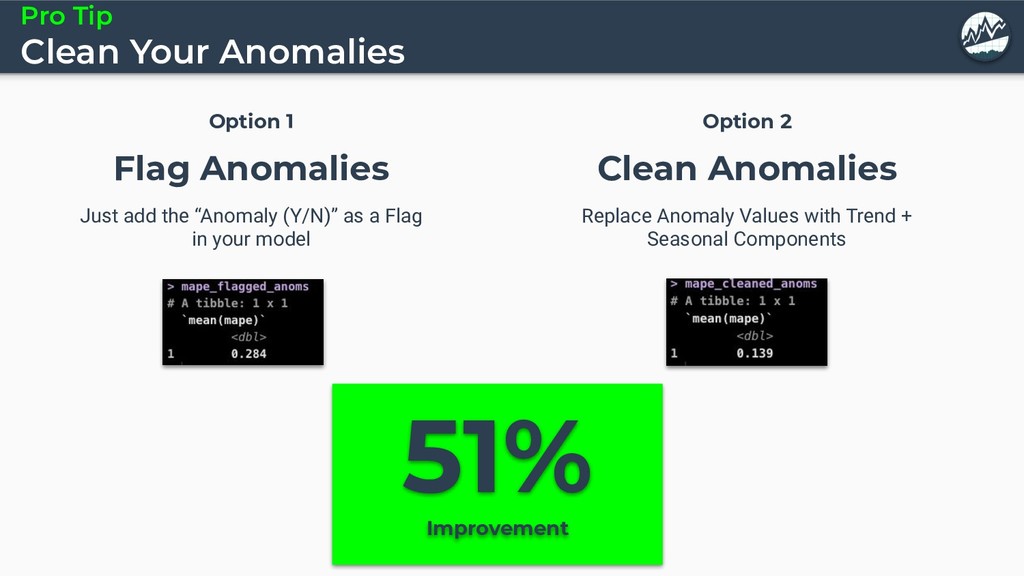
Anomaly Values with Trend + Seasonal Components Pro Improves Forecasting Performance Con Doesn’t predict well when future has anomalies Option 1 Flag Anomalies Just add the “Anomaly (Y/N)” as a Flag in your model Pro Predicts well when future has anomalies that are similar to past anomalies Con May reduce forecasting accuracy
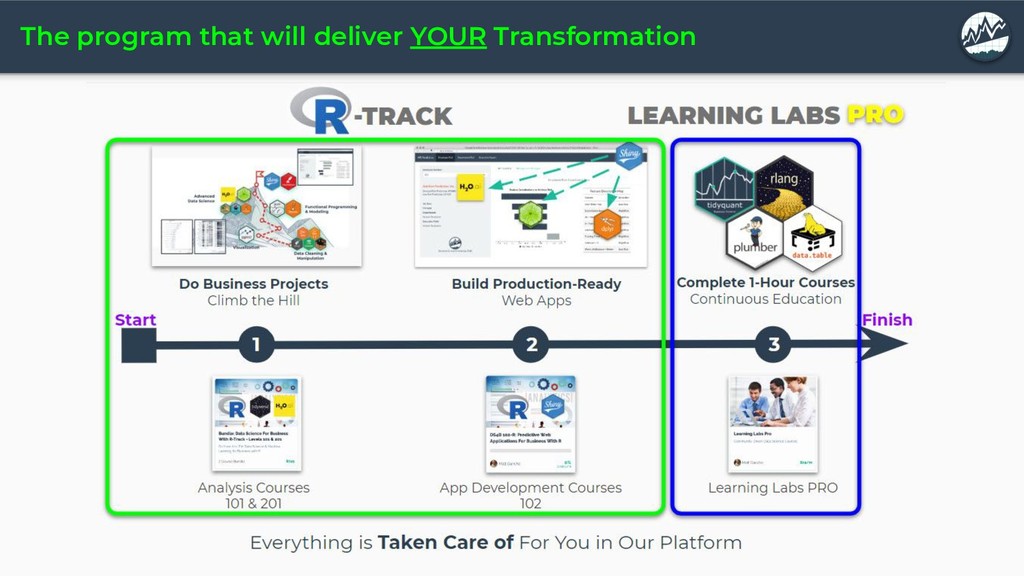
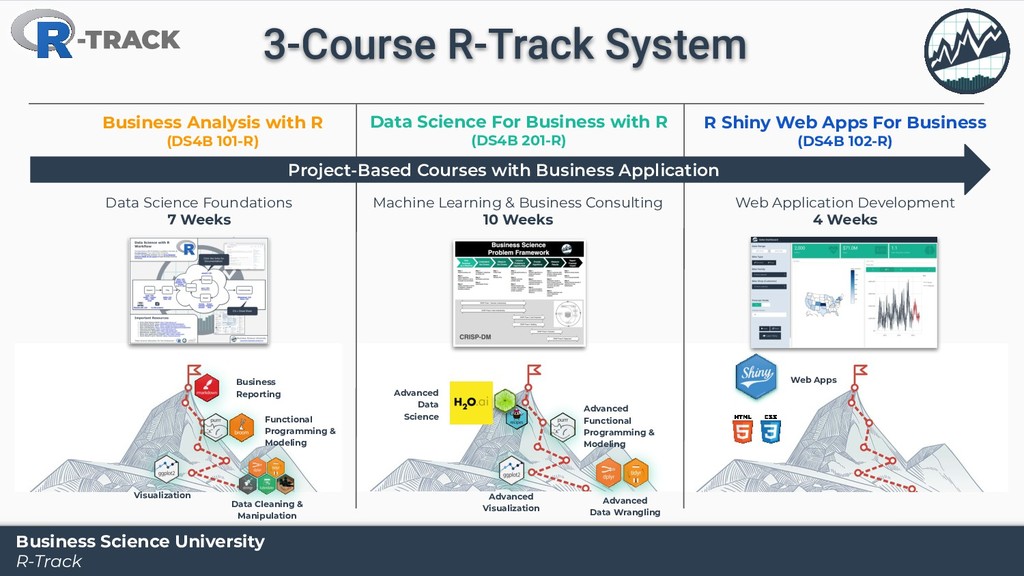
Advanced Data Science Visualization Data Cleaning & Manipulation Functional Programming & Modeling Business Reporting Business Analysis with R (DS4B 101-R) Data Science For Business with R (DS4B 201-R) R Shiny Web Apps For Business (DS4B 102-R) Web Apps Data Science Foundations 7 Weeks Machine Learning & Business Consulting 10 Weeks Web Application Development 4 Weeks -TRACK Project-Based Courses with Business Application Business Science University R-Track 3-Course R-Track System
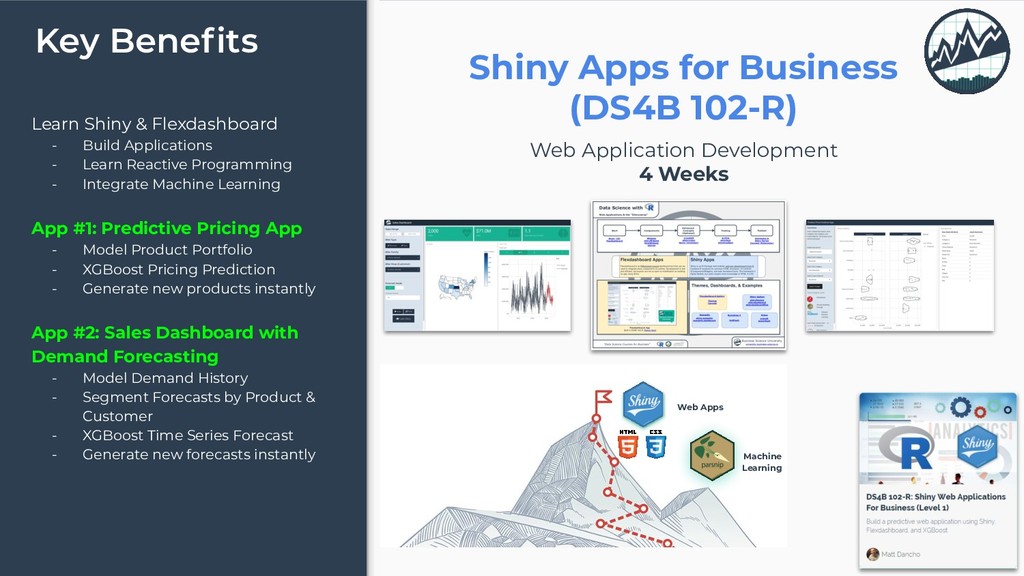
Learn Reactive Programming - Integrate Machine Learning App #1: Predictive Pricing App - Model Product Portfolio - XGBoost Pricing Prediction - Generate new products instantly App #2: Sales Dashboard with Demand Forecasting - Model Demand History - Segment Forecasts by Product & Customer - XGBoost Time Series Forecast - Generate new forecasts instantly Shiny Apps for Business (DS4B 102-R) Web Application Development 4 Weeks Web Apps Machine Learning
the 10-Week Course - Landed a Job at one of the most Prestigious Management Consulting Firms “This course showed me how to place data analytics in real business settings.” #Business Science Success