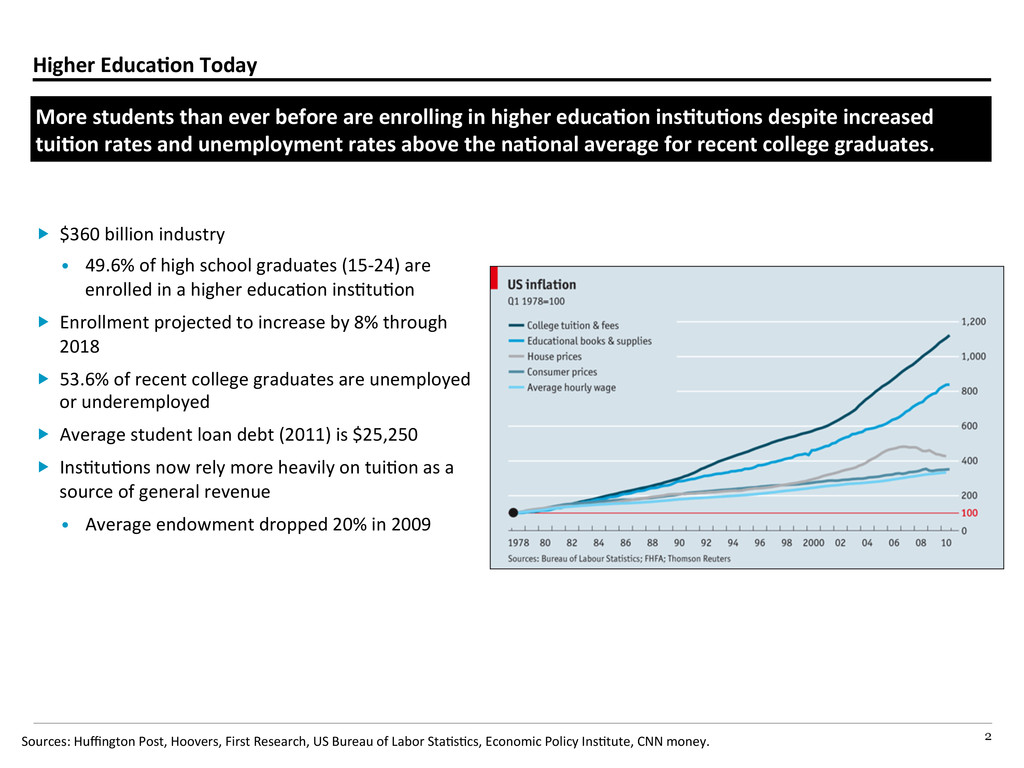
before are enrolling in higher educaAon insAtuAons despite increased tuiAon rates and unemployment rates above the naAonal average for recent college graduates. $360 billion industry • 49.6% of high school graduates (15-‐24) are enrolled in a higher educaBon insBtuBon Enrollment projected to increase by 8% through 2018 53.6% of recent college graduates are unemployed or underemployed Average student loan debt (2011) is $25,250 InsBtuBons now rely more heavily on tuiBon as a source of general revenue • Average endowment dropped 20% in 2009 Sources: Huffington Post, Hoovers, First Research, US Bureau of Labor StaBsBcs, Economic Policy InsBtute, CNN money.
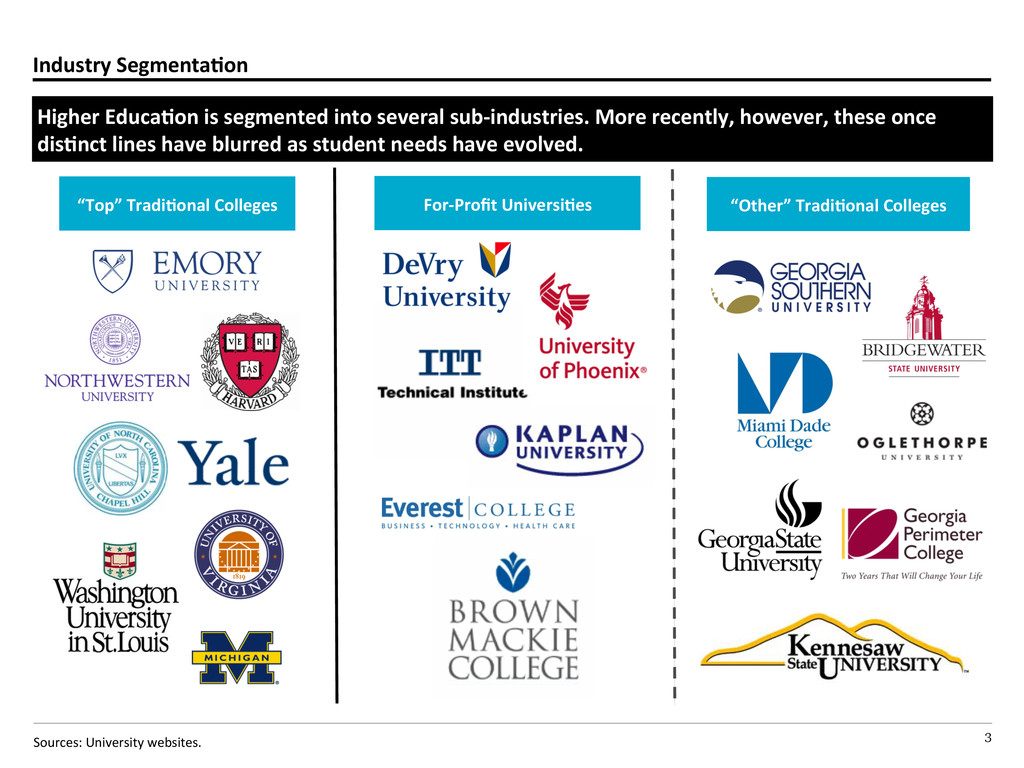
sub-‐industries. More recently, however, these once disAnct lines have blurred as student needs have evolved. Sources: University websites. “Top” TradiAonal Colleges “Other” TradiAonal Colleges For-‐Profit UniversiAes
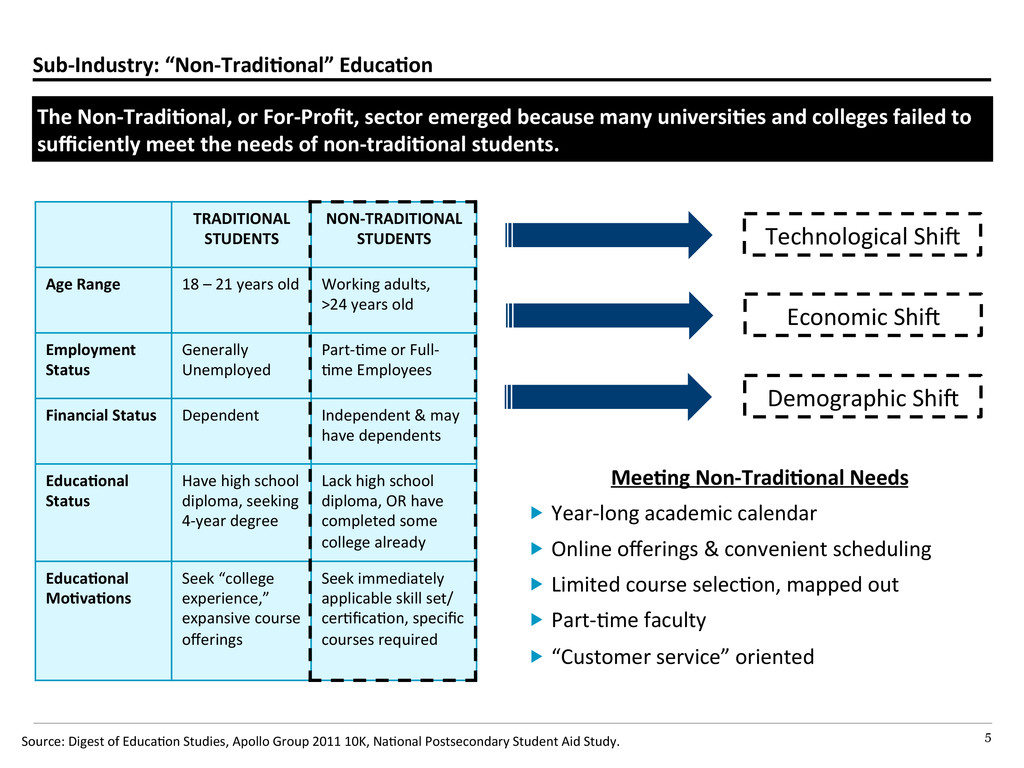
Apollo Group 2011 10K, NaBonal Postsecondary Student Aid Study. The Non-‐TradiAonal, or For-‐Profit, sector emerged because many universiAes and colleges failed to sufficiently meet the needs of non-‐tradiAonal students. TRADITIONAL STUDENTS NON-‐TRADITIONAL STUDENTS Age Range 18 – 21 years old Working adults, >24 years old Employment Status Generally Unemployed Part-‐Bme or Full-‐ Bme Employees Financial Status Dependent Independent & may have dependents EducaAonal Status Have high school diploma, seeking 4-‐year degree Lack high school diploma, OR have completed some college already EducaAonal MoAvaAons Seek “college experience,” expansive course offerings Seek immediately applicable skill set/ cerBficaBon, specific courses required Technological Shij Demographic Shij Economic Shij MeeAng Non-‐TradiAonal Needs Year-‐long academic calendar Online offerings & convenient scheduling Limited course selecBon, mapped out Part-‐Bme faculty “Customer service” oriented
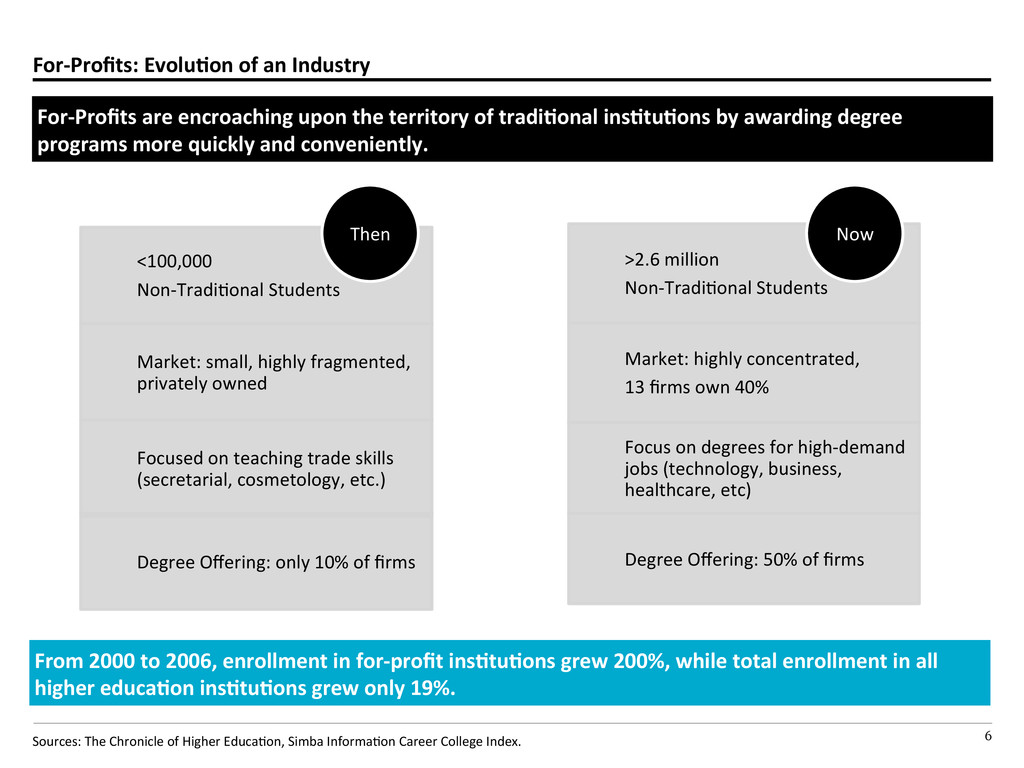
upon the territory of tradiAonal insAtuAons by awarding degree programs more quickly and conveniently. Sources: The Chronicle of Higher EducaBon, Simba InformaBon Career College Index. <100,000 Non-‐TradiBonal Students Market: small, highly fragmented, privately owned Focused on teaching trade skills (secretarial, cosmetology, etc.) Degree Offering: only 10% of firms Then >2.6 million Non-‐TradiBonal Students Market: highly concentrated, 13 firms own 40% Focus on degrees for high-‐demand jobs (technology, business, healthcare, etc) Degree Offering: 50% of firms Now From 2000 to 2006, enrollment in for-‐profit insAtuAons grew 200%, while total enrollment in all higher educaAon insAtuAons grew only 19%.
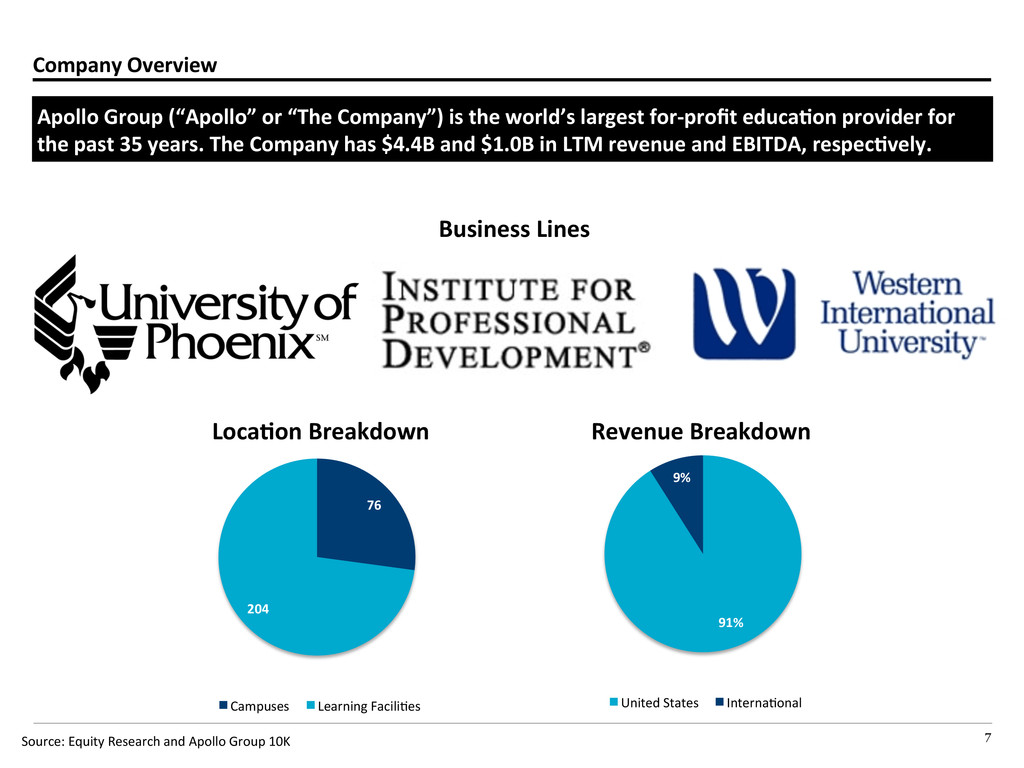
is the world’s largest for-‐profit educaAon provider for the past 35 years. The Company has $4.4B and $1.0B in LTM revenue and EBITDA, respecAvely. Source: Equity Research and Apollo Group 10K 76 204 Campuses Learning FaciliBes 91% 9% United States InternaBonal Business Lines LocaAon Breakdown Revenue Breakdown
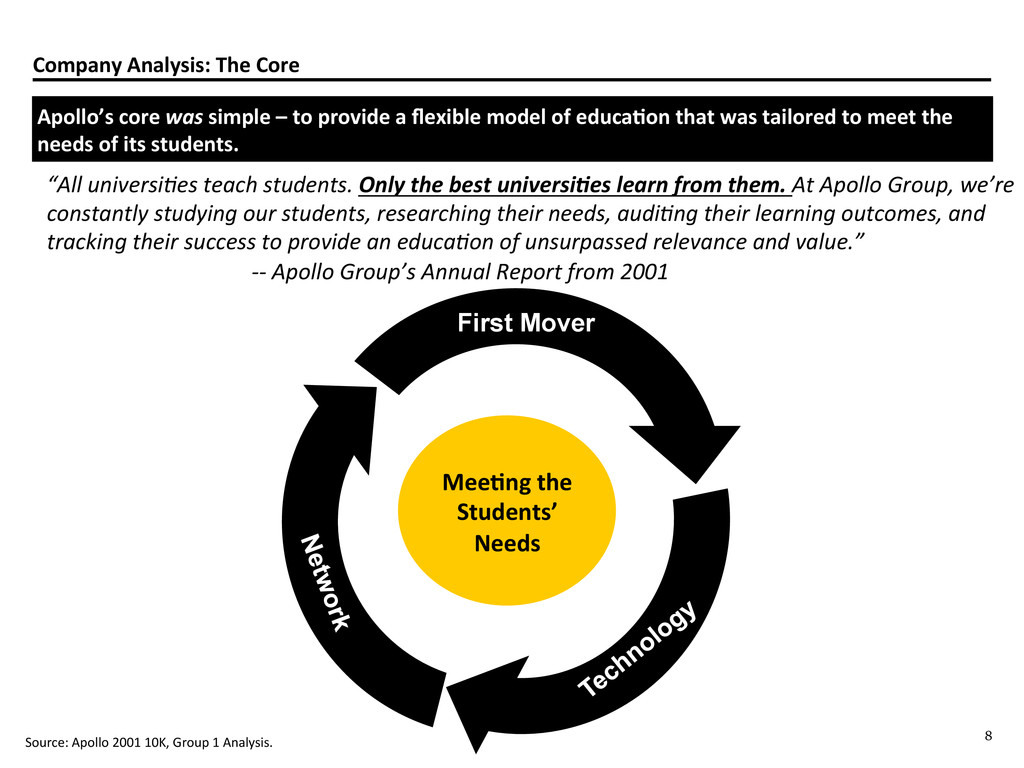
– to provide a flexible model of educaAon that was tailored to meet the needs of its students. Source: Apollo 2001 10K, Group 1 Analysis. “All universi,es teach students. Only the best universi1es learn from them. At Apollo Group, we’re constantly studying our students, researching their needs, audi,ng their learning outcomes, and tracking their success to provide an educa,on of unsurpassed relevance and value.” -‐-‐ Apollo Group’s Annual Report from 2001 MeeAng the Students’ Needs First Mover
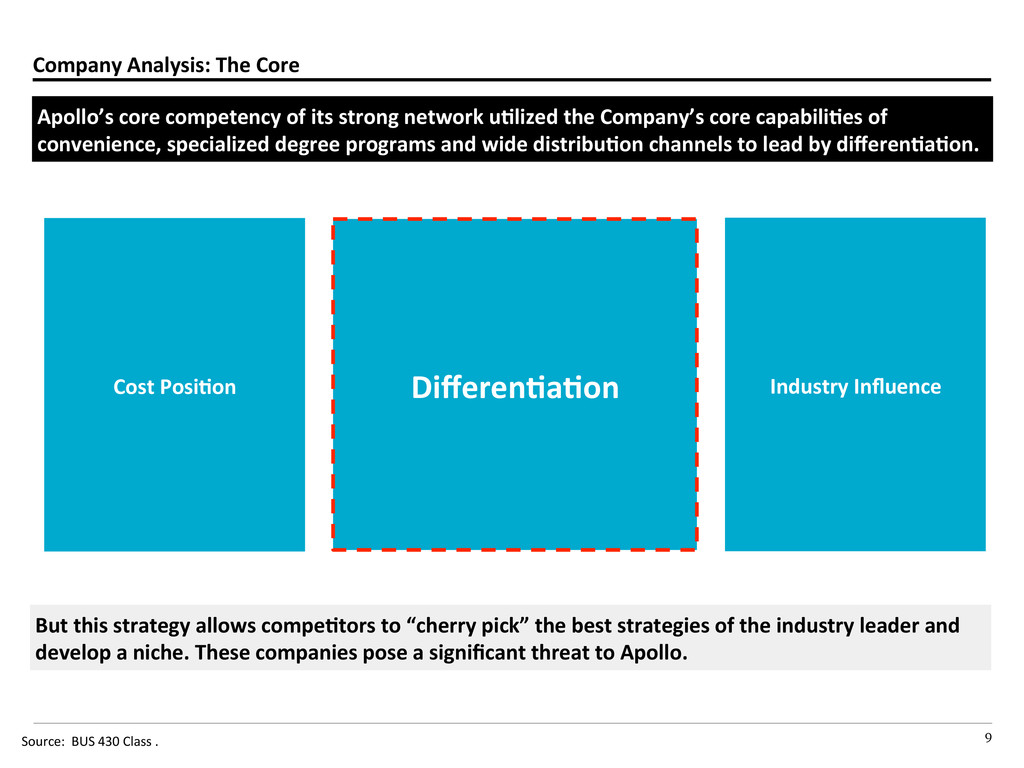
its strong network uAlized the Company’s core capabiliAes of convenience, specialized degree programs and wide distribuAon channels to lead by differenAaAon. Source: BUS 430 Class . Cost PosiAon DifferenAaAon Industry Influence But this strategy allows compeAtors to “cherry pick” the best strategies of the industry leader and develop a niche. These companies pose a significant threat to Apollo.
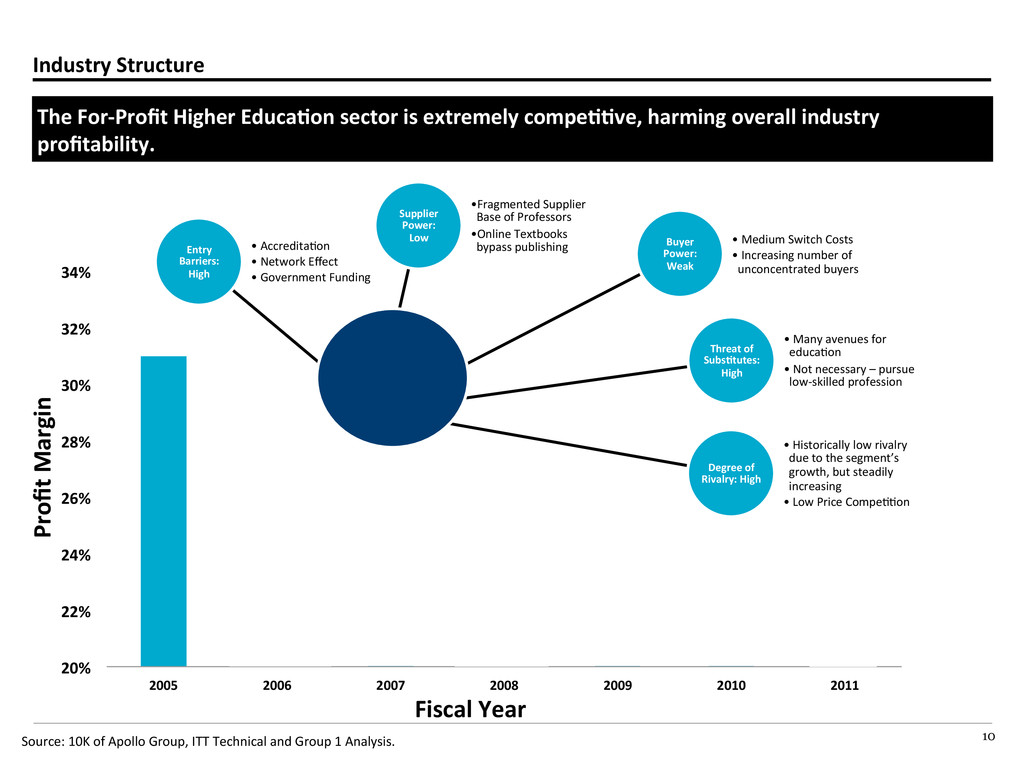
30% 32% 34% 2005 2006 2007 2008 2009 2010 2011 Entry Barriers: High • AccreditaBon • Network Effect • Government Funding Supplier Power: Low • Fragmented Supplier Base of Professors • Online Textbooks bypass publishing Buyer Power: Weak • Medium Switch Costs • Increasing number of unconcentrated buyers Degree of Rivalry: High • Historically low rivalry due to the segment’s growth, but steadily increasing • Low Price CompeBBon Threat of SubsAtutes: High • Many avenues for educaBon • Not necessary – pursue low-‐skilled profession Industry Structure The For-‐Profit Higher EducaAon sector is extremely compeAAve, harming overall industry profitability. Source: 10K of Apollo Group, ITT Technical and Group 1 Analysis. Profit Margin Fiscal Year
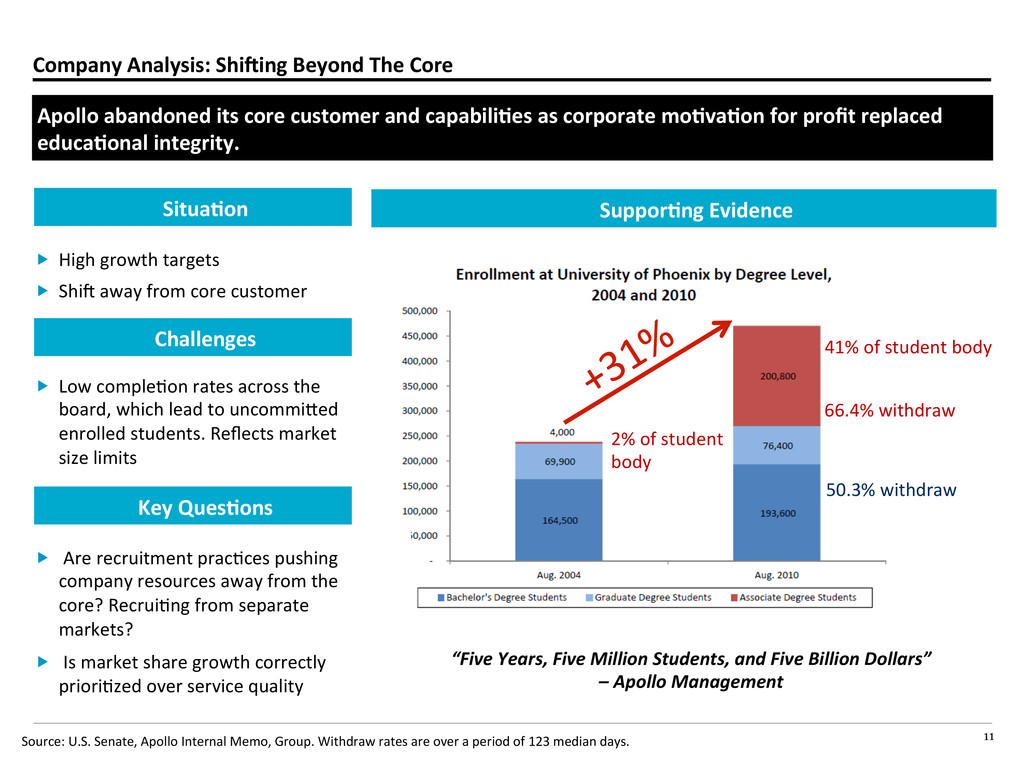
its core customer and capabiliAes as corporate moAvaAon for profit replaced educaAonal integrity. Source: U.S. Senate, Apollo Internal Memo, Group. Withdraw rates are over a period of 123 median days. “Five Years, Five Million Students, and Five Billion Dollars” – Apollo Management 41% of student body 2% of student body 66.4% withdraw 50.3% withdraw SupporAng Evidence SituaAon Challenges Key QuesAons High growth targets Shij away from core customer Low compleBon rates across the board, which lead to uncommioed enrolled students. Reflects market size limits Are recruitment pracBces pushing company resources away from the core? RecruiBng from separate markets? Is market share growth correctly prioriBzed over service quality
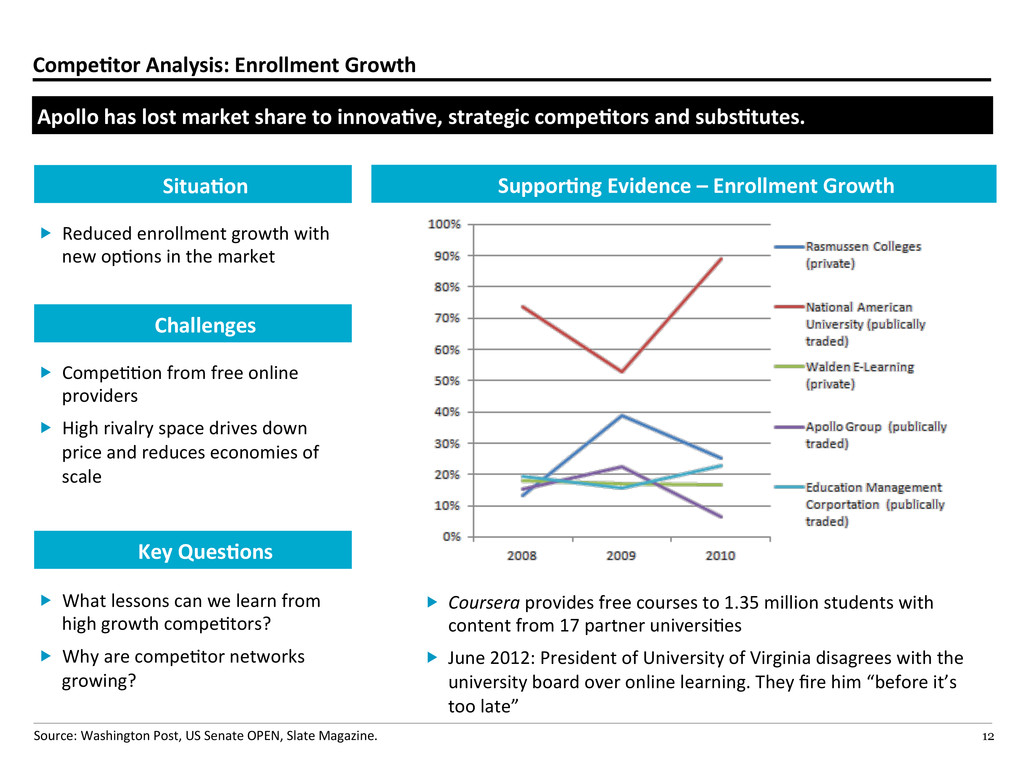
share to innovaAve, strategic compeAtors and subsAtutes. Source: Washington Post, US Senate OPEN, Slate Magazine. SupporAng Evidence – Enrollment Growth SituaAon Challenges Key QuesAons Reduced enrollment growth with new opBons in the market CompeBBon from free online providers High rivalry space drives down price and reduces economies of scale What lessons can we learn from high growth compeBtors? Why are compeBtor networks growing? Coursera provides free courses to 1.35 million students with content from 17 partner universiBes June 2012: President of University of Virginia disagrees with the university board over online learning. They fire him “before it’s too late”
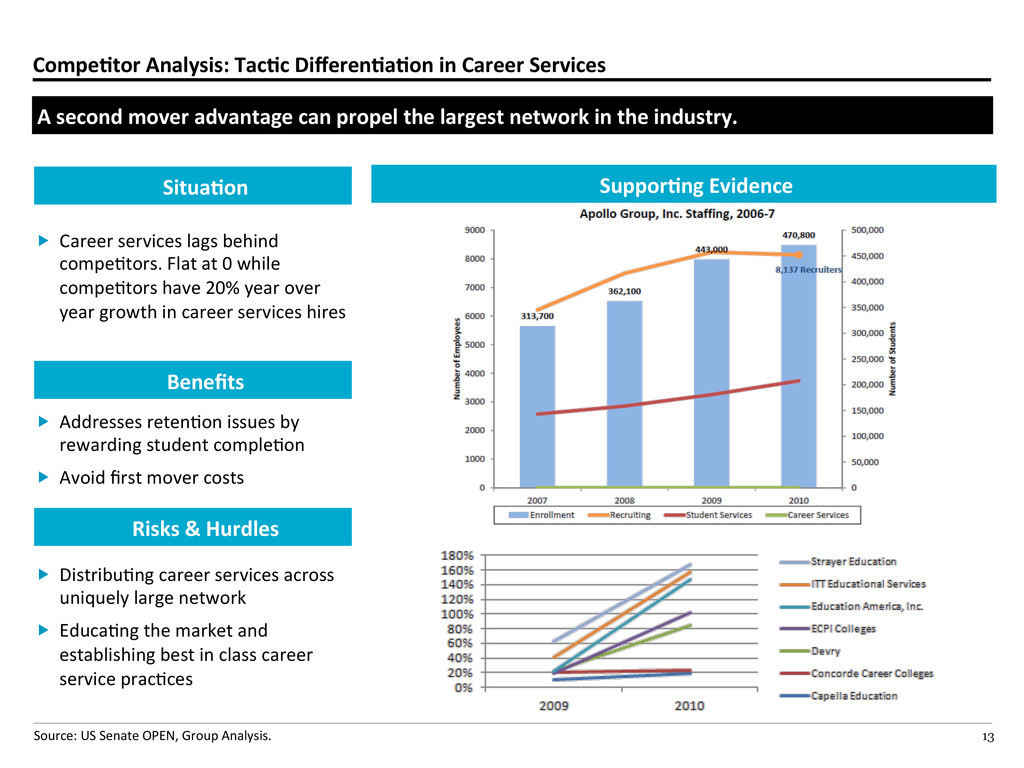
second mover advantage can propel the largest network in the industry. Source: US Senate OPEN, Group Analysis. SupporAng Evidence SituaAon Benefits Risks & Hurdles Career services lags behind compeBtors. Flat at 0 while compeBtors have 20% year over year growth in career services hires Addresses retenBon issues by rewarding student compleBon Avoid first mover costs DistribuBng career services across uniquely large network EducaBng the market and establishing best in class career service pracBces
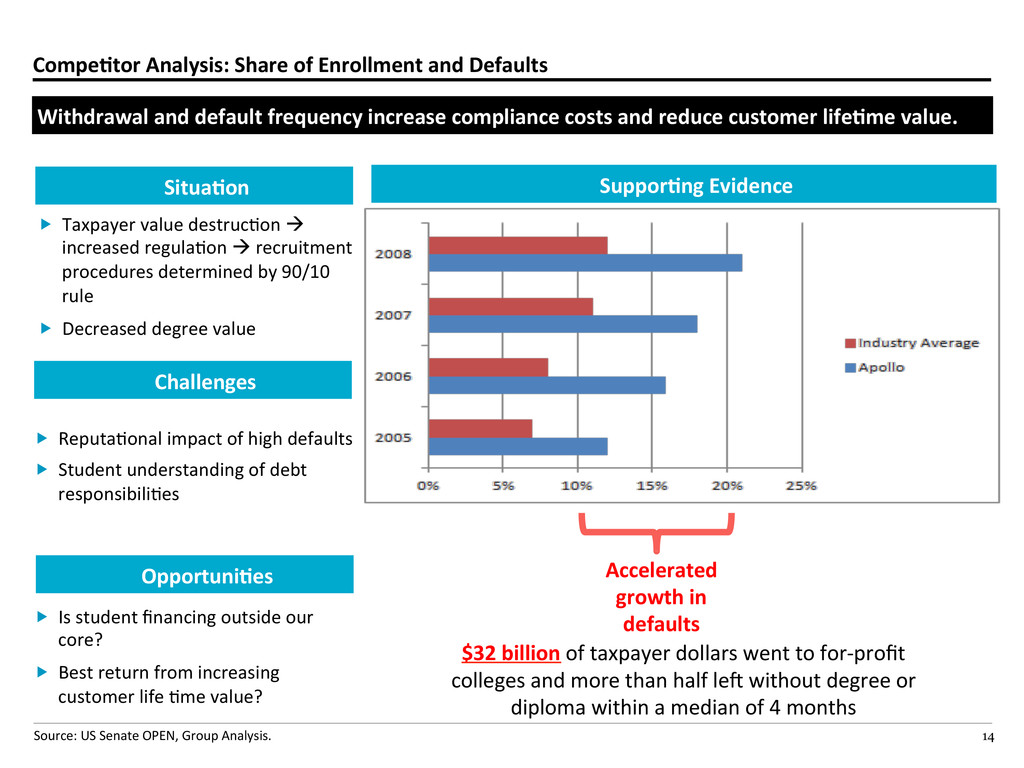
and default frequency increase compliance costs and reduce customer lifeAme value. Source: US Senate OPEN, Group Analysis. SupporAng Evidence SituaAon Challenges OpportuniAes Accelerated growth in defaults $32 billion of taxpayer dollars went to for-‐profit colleges and more than half lej without degree or diploma within a median of 4 months Taxpayer value destrucBon à increased regulaBon à recruitment procedures determined by 90/10 rule Decreased degree value ReputaBonal impact of high defaults Student understanding of debt responsibiliBes Is student financing outside our core? Best return from increasing customer life Bme value?
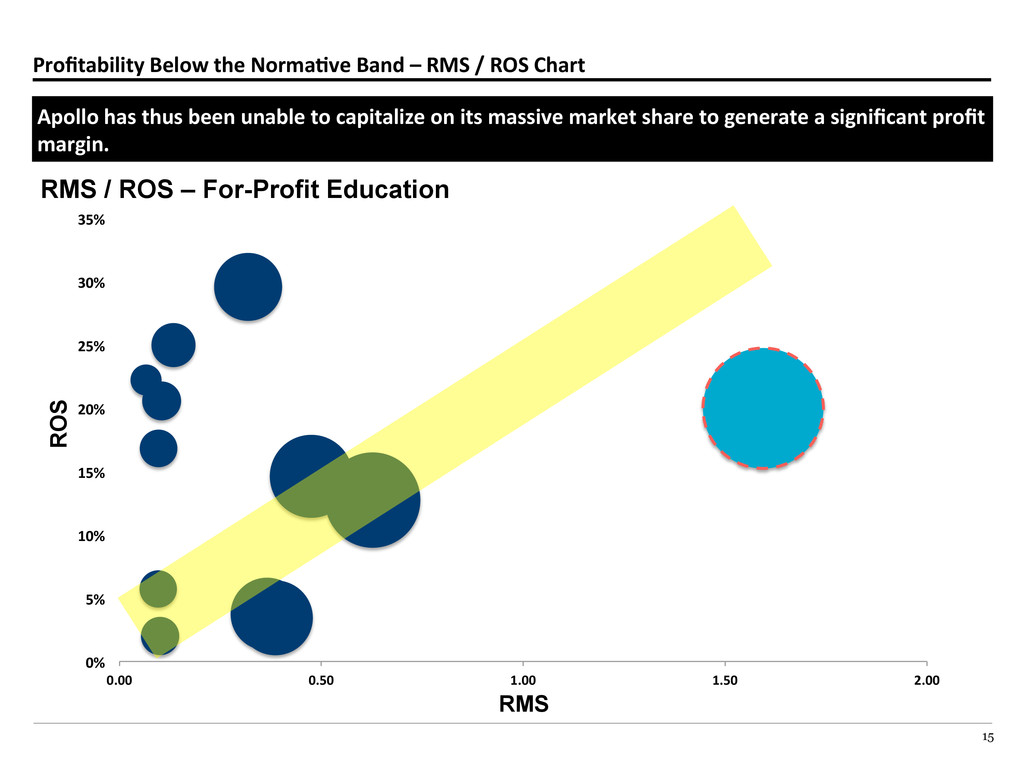
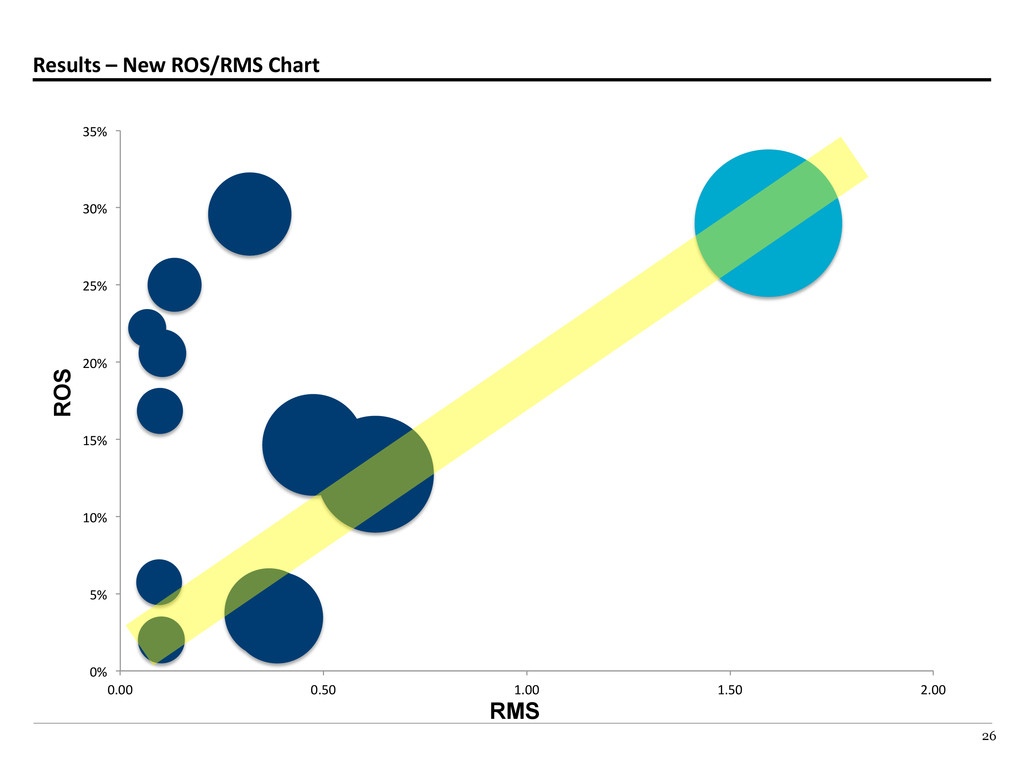
Chart Apollo has thus been unable to capitalize on its massive market share to generate a significant profit margin. 0% 5% 10% 15% 20% 25% 30% 35% 0.00 0.50 1.00 1.50 2.00 RMS / ROS – For-Profit Education ROS RMS
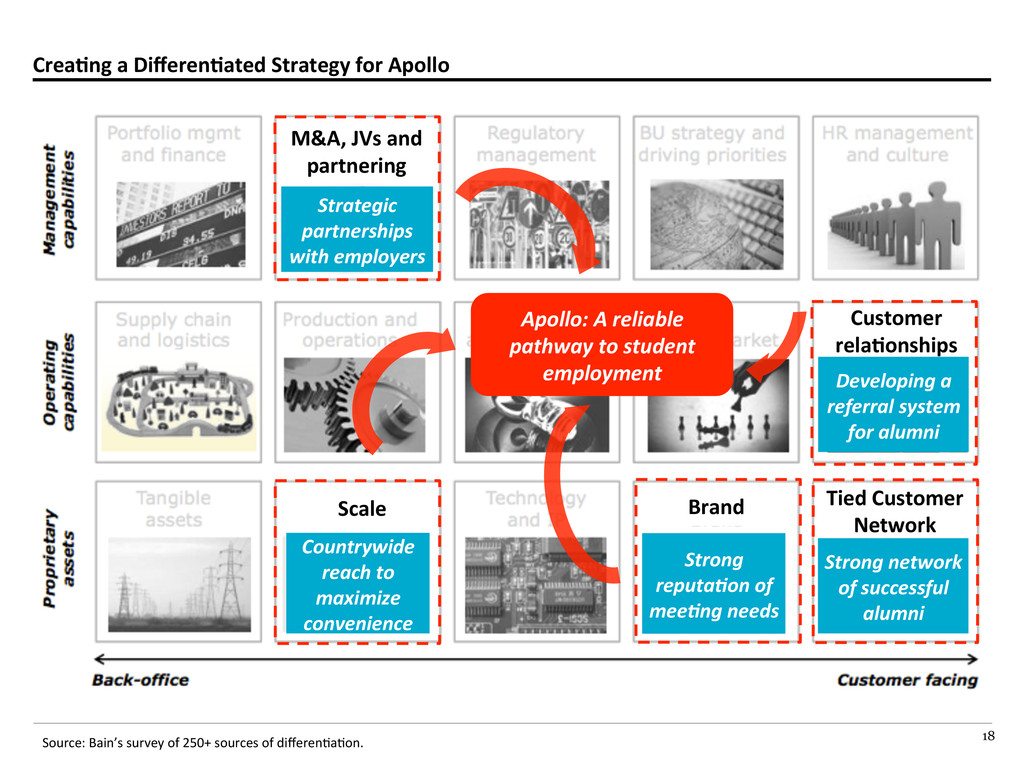
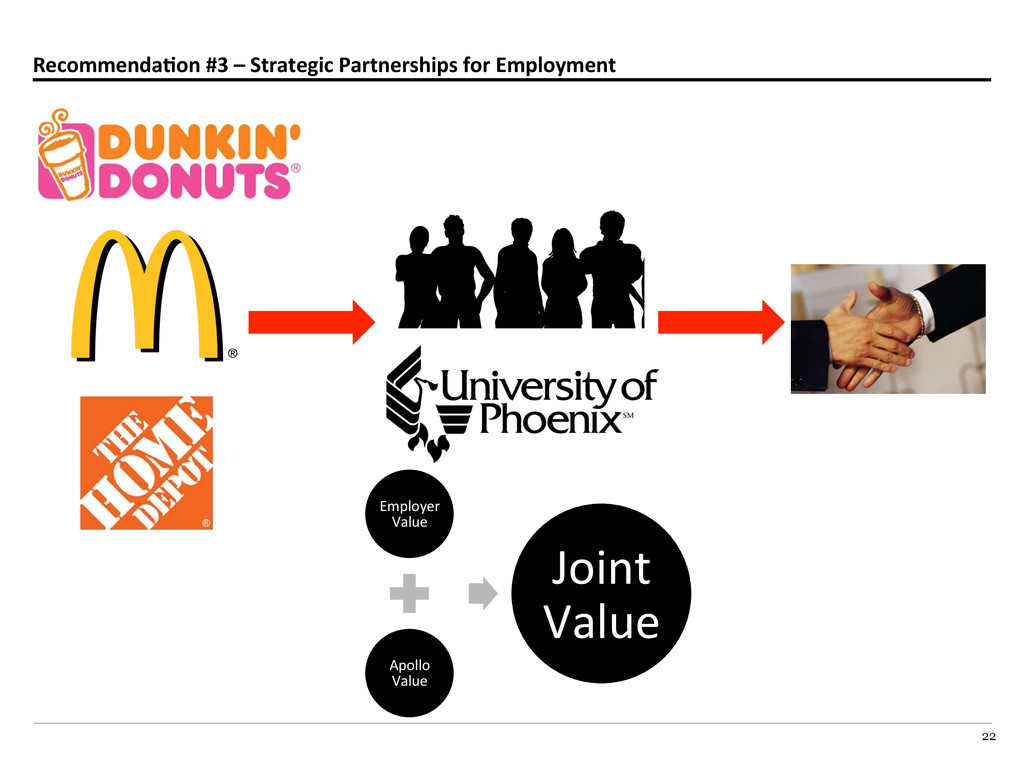
Bain’s survey of 250+ sources of differenBaBon. M&A, JVs and partnering Customer relaAonships Tied Customer Network Brand Scale Strategic partnerships with employers Developing a referral system for alumni Strong network of successful alumni Strong reputa1on of mee1ng needs Countrywide reach to maximize convenience Apollo: A reliable pathway to student employment
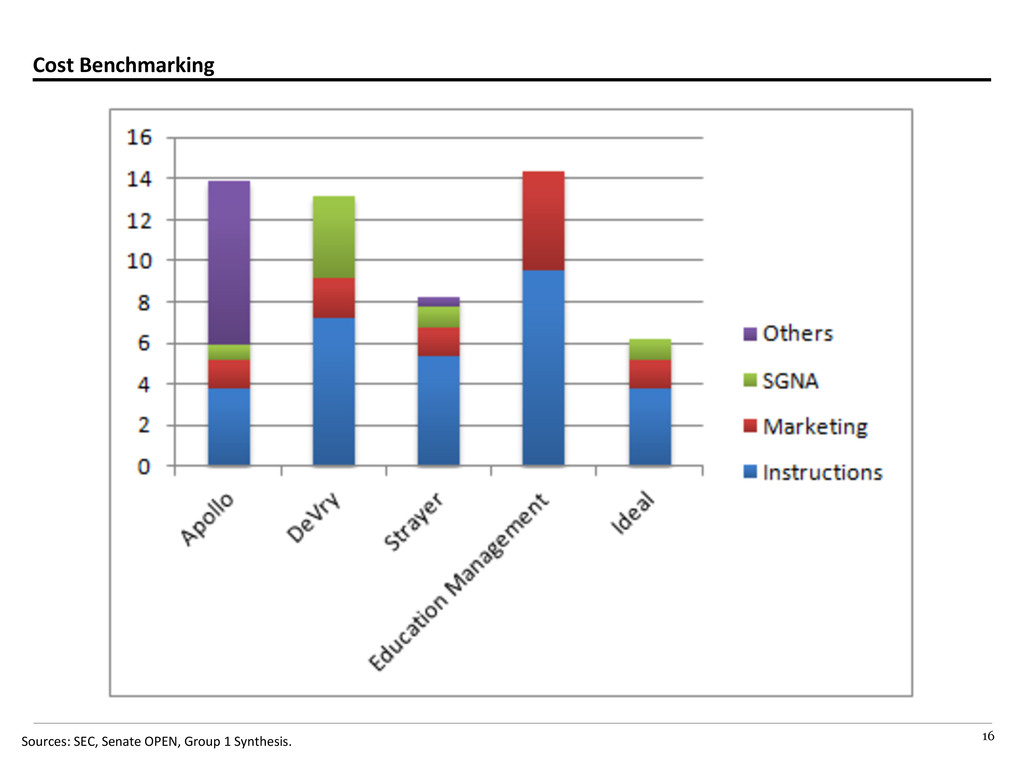
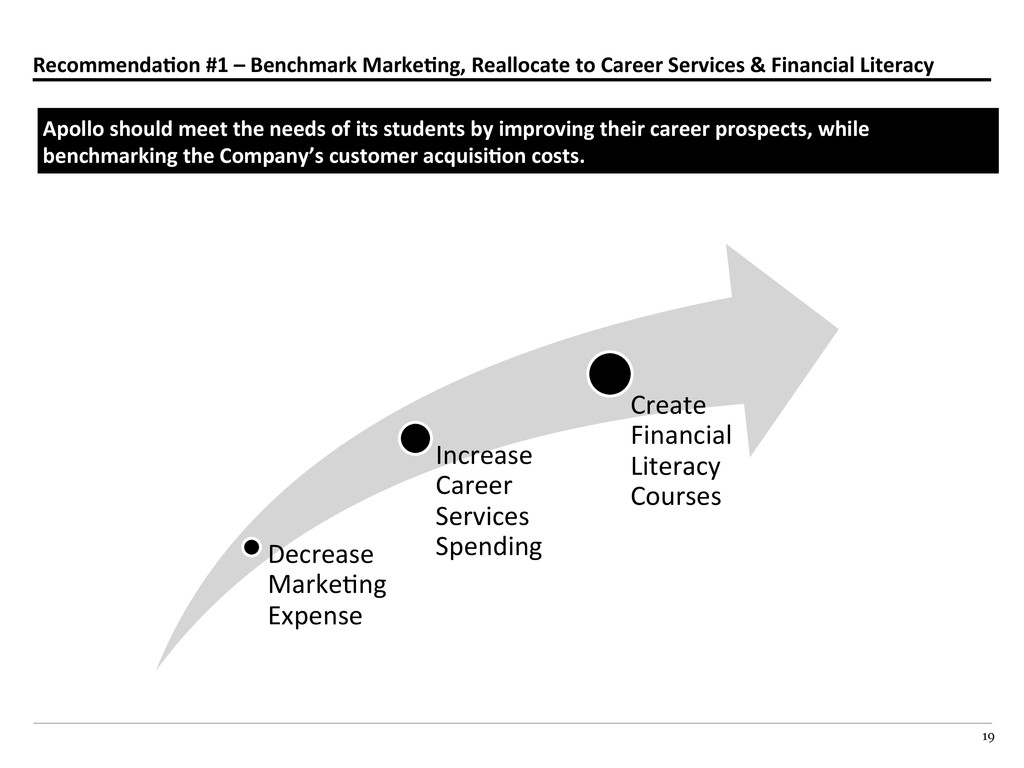
& Financial Literacy Decrease MarkeBng Expense Increase Career Services Spending Create Financial Literacy Courses Apollo should meet the needs of its students by improving their career prospects, while benchmarking the Company’s customer acquisiAon costs.
Raised GMAT, GPA and work threshold for incoming class Enrollment rates decreased markedly iniBally as fewer people met the new threshold Ajer a few years, the smaller, strengthened classes boosted average entrance staBsBcs and employment rates Emory’s MBA program improved in ranking and has aoracted more candidates Takeaway: Short-‐term dips in enrollment can be outweighed by long-‐term increases in the strength of a network Emory University’s MBA program followed a similar model.
Pre-‐Professional Program Grow the core and reduce customer turnover by offering joint degree programs similar to Emory’s 3-‐2 engineering program with Georgia Tech. Source: US Senate OPEN, Group 1 Analysis. • Taxpayer value destrucBon à increased regulaBon à recruitment procedures determined by 90/10 rule • Decreased degree value Structure SituaAon Benefits • FoundaBon courses with subsequent guaranteed enrollment in partner insBtuBons upon credit compleBon Risks and Hurdles • IniBal cost of establishing partnerships and programs • CannibalizaBon of associate degree investments • Increase student enrollment in Bachelor degree tracks • New rewards for track compleBon Pre-‐Engineering Pre-‐Law Pre-‐Dental Pre-‐Business 2 years Phoenix University B.S. or B.A. 1 year Partner TradiBonal InsBtuBon Masters 1 year Partner TradiBonal InsBtuBon
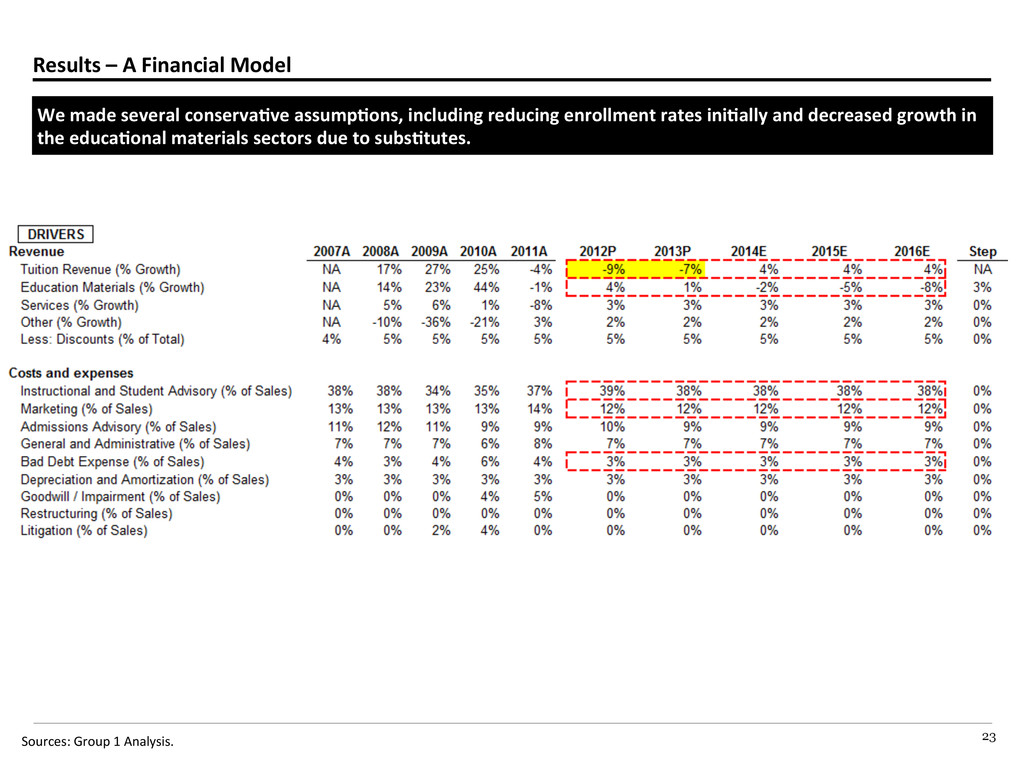
several conservaAve assumpAons, including reducing enrollment rates iniAally and decreased growth in the educaAonal materials sectors due to subsAtutes. Sources: Group 1 Analysis.
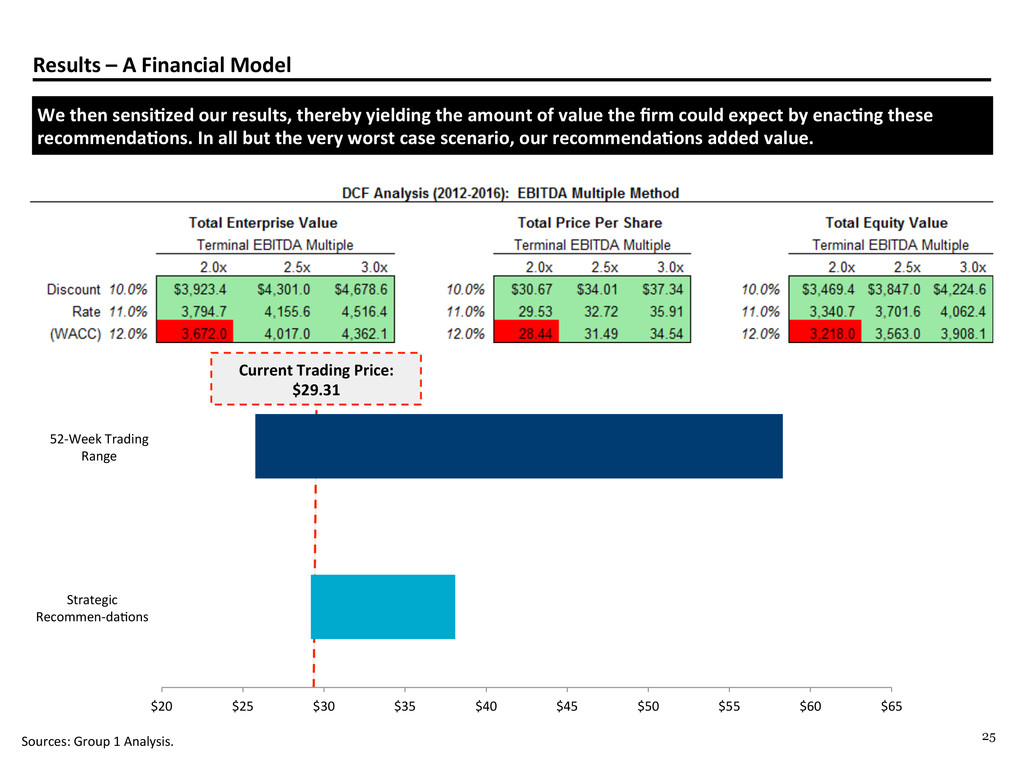
sensiAzed our results, thereby yielding the amount of value the firm could expect by enacAng these recommendaAons. In all but the very worst case scenario, our recommendaAons added value. $20 $25 $30 $35 $40 $45 $50 $55 $60 $65 Strategic Recommen-‐daBons 52-‐Week Trading Range Current Trading Price: $29.31 Sources: Group 1 Analysis.
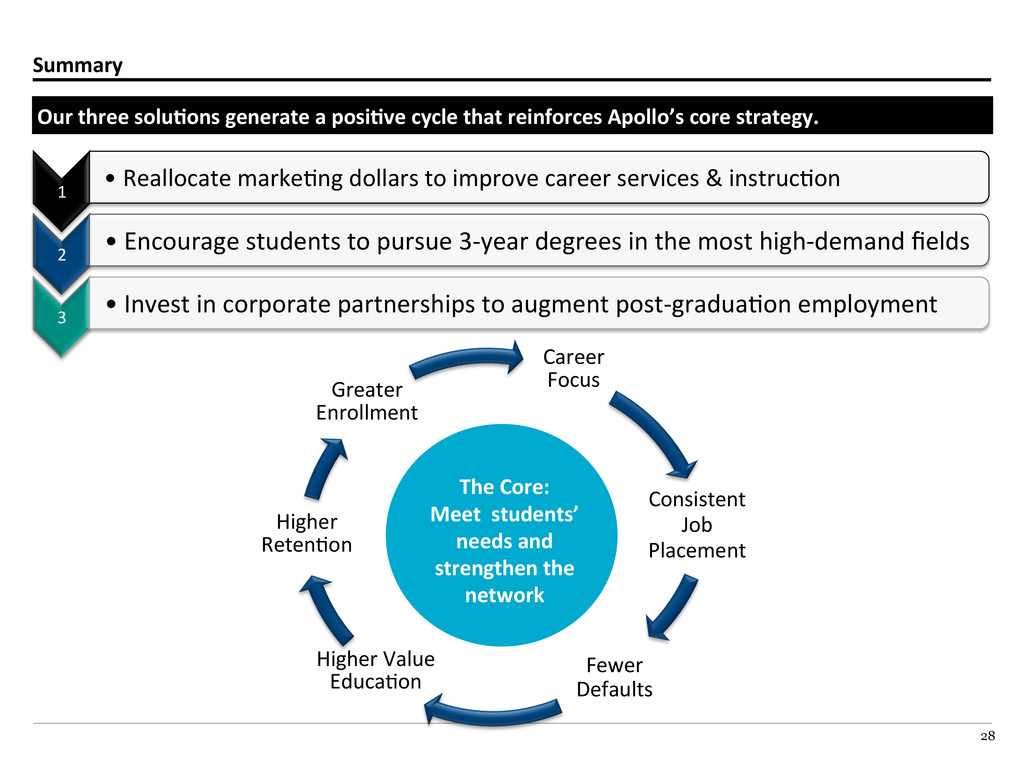
career services & instrucBon 2 • Encourage students to pursue 3-‐year degrees in the most high-‐demand fields 3 • Invest in corporate partnerships to augment post-‐graduaBon employment Our three soluAons generate a posiAve cycle that reinforces Apollo’s core strategy. Career Focus Consistent Job Placement Fewer Defaults Higher Value EducaBon Higher RetenBon Greater Enrollment The Core: Meet students’ needs and strengthen the network