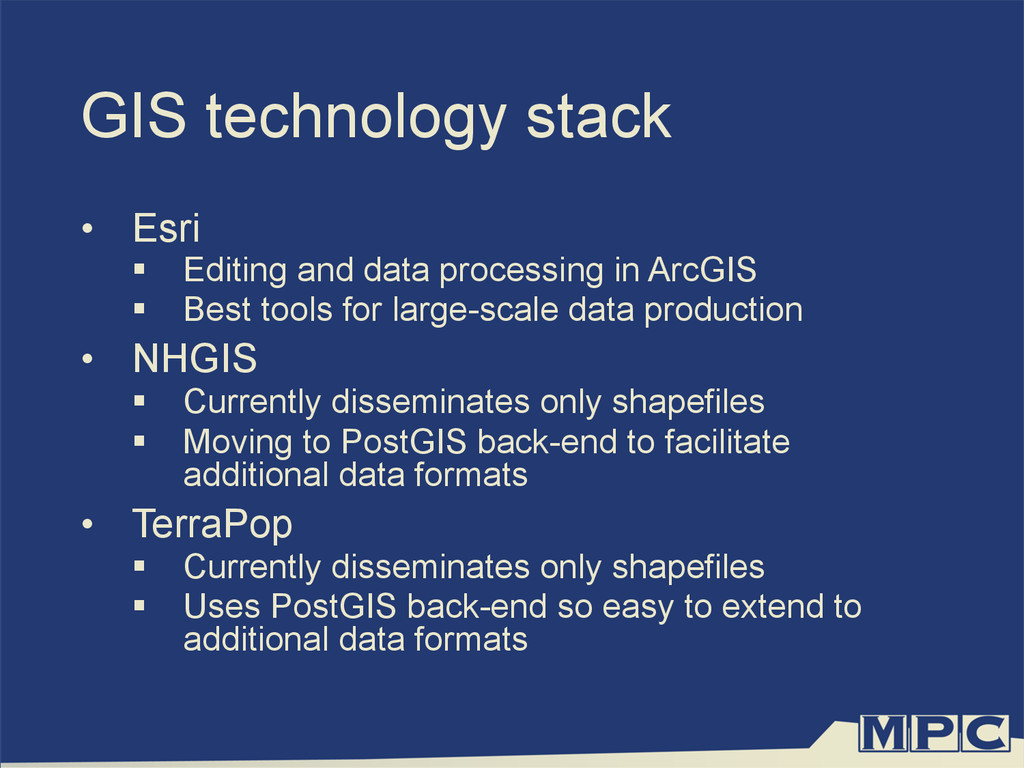
$30 off During Our Annual Pro Sale. View Details »

Creating and disseminating GIS data for the US and the World

Creating and disseminating GIS data for the US and the World

David Van Riper
Jonathan Schroeder
Tracy Kugler

#NACIS2015

Nathaniel V. KELSO

October 14, 2015
Tweet

More Decks by Nathaniel V. KELSO

Other Decks in Education

Transcript

  1. Creating and disseminating GIS
    data for the US and the World
    David Van Riper
    Jonathan Schroeder
    Tracy Kugler
    NACIS 2015

    View Slide

  2. View Slide

  3. View Slide

  4. GIS technology stack
    •  Esri
    §  Editing and data processing in ArcGIS
    §  Best tools for large-scale data production
    •  NHGIS
    §  Currently disseminates only shapefiles
    §  Moving to PostGIS back-end to facilitate
    additional data formats
    •  TerraPop
    §  Currently disseminates only shapefiles
    §  Uses PostGIS back-end so easy to extend to
    additional data formats

    View Slide

  5. NHGIS
    •  Started in 2001 with a major grant from 
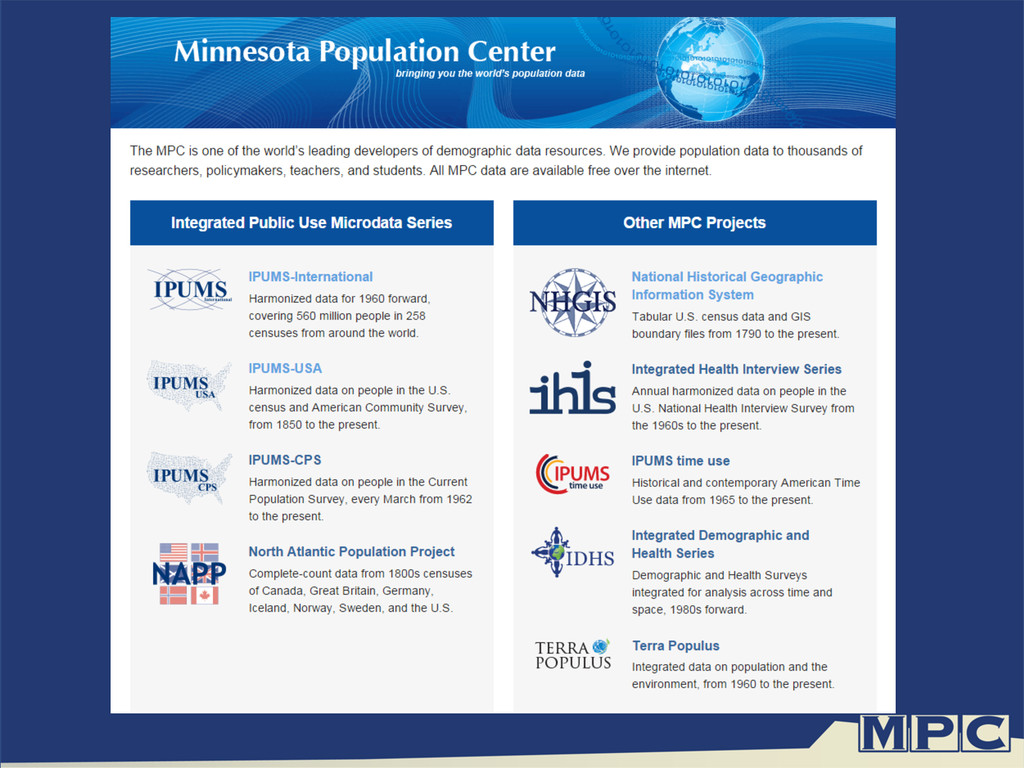
the
    National Science Foundation
    •  Received two additional NSF grants and two
    NICHD (NIH) grants
    •  First MPC project to create and disseminate
    GIS data
    •  NHGIS also disseminates aggregate census
    data to link with GIS data

    View Slide

  6. http://www2.census.gov/geo/pdfs/reference/geodiagram.pdf

    View Slide

  7. http://www2.census.gov/geo/pdfs/reference/geodiagram.pdf

    View Slide

  8. Initial GIS data
    •  Census tracts
    §  1910-2000
    §  Constructed 
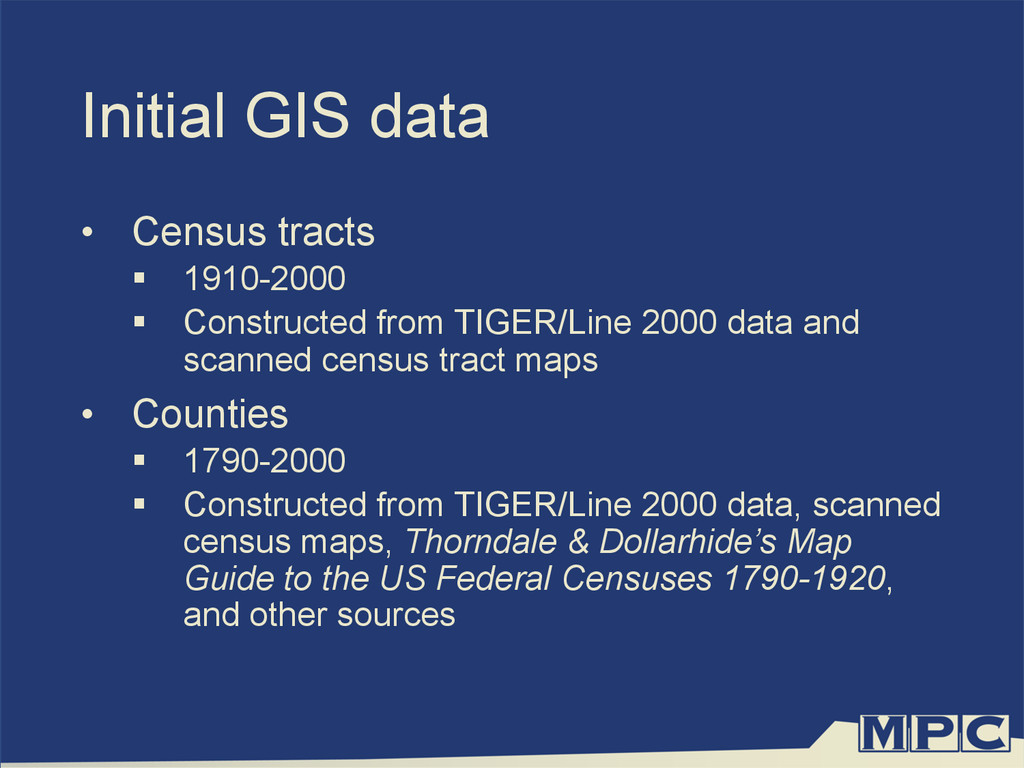
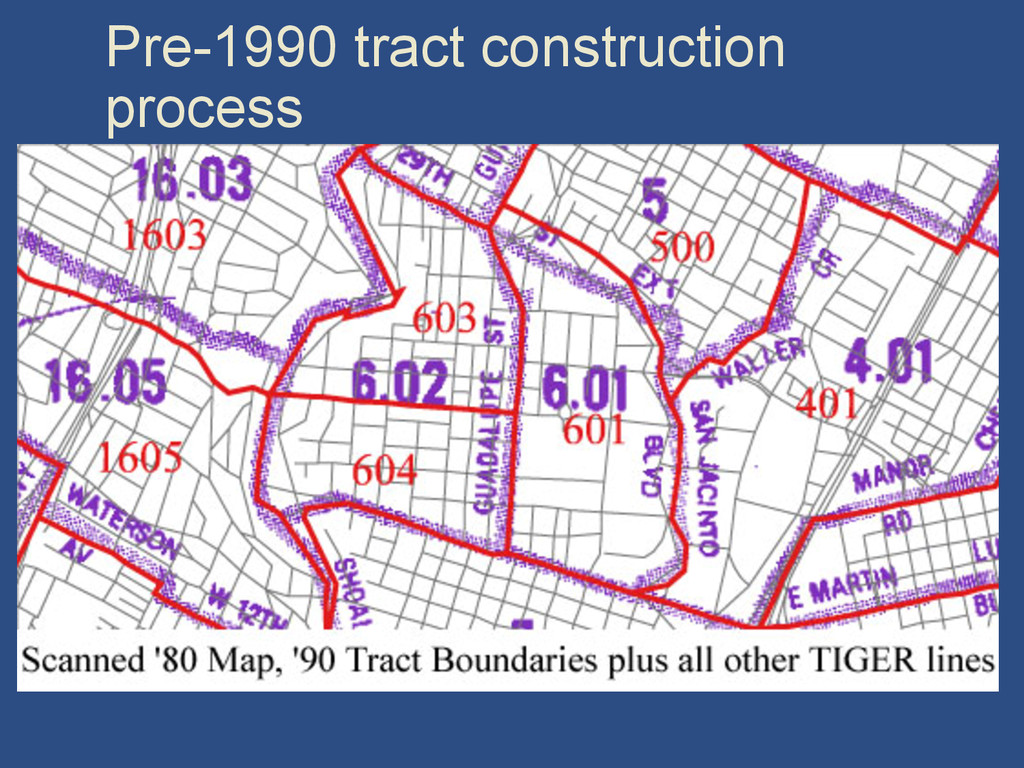
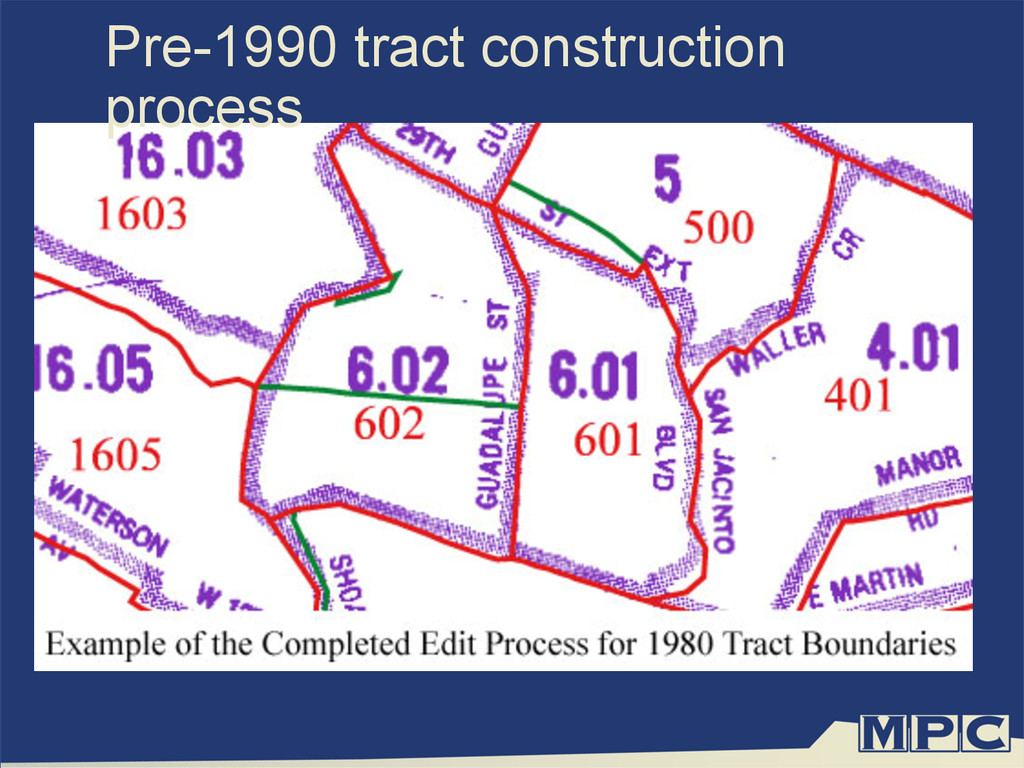
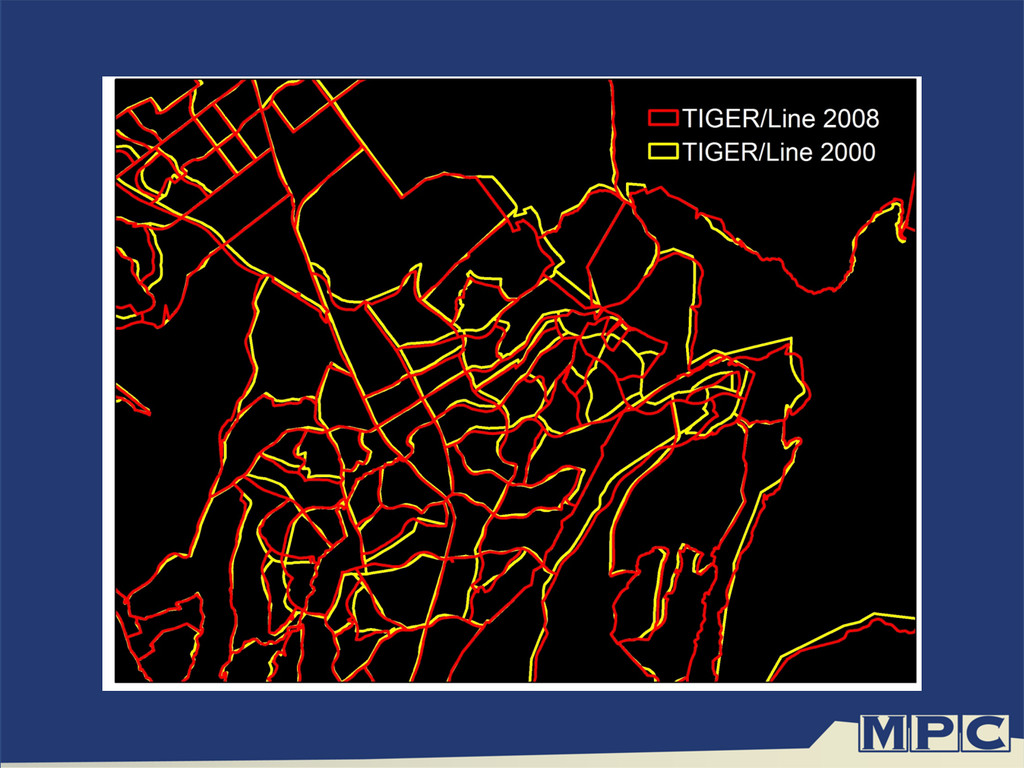
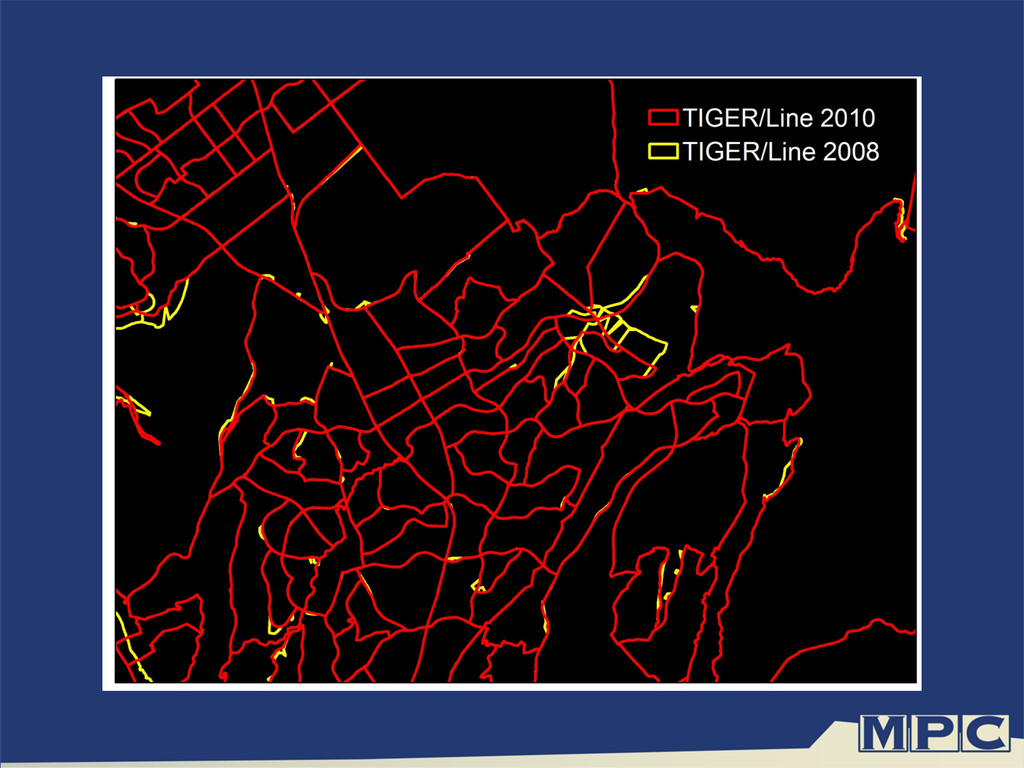
from TIGER/Line 2000 data and
    scanned census tract maps
    •  Counties
    §  1790-2000
    §  Constructed from TIGER/Line 2000 data, scanned
    census maps, Thorndale & Dollarhide’s Map
    Guide to the US Federal Censuses 1790-1920,
    and other sources
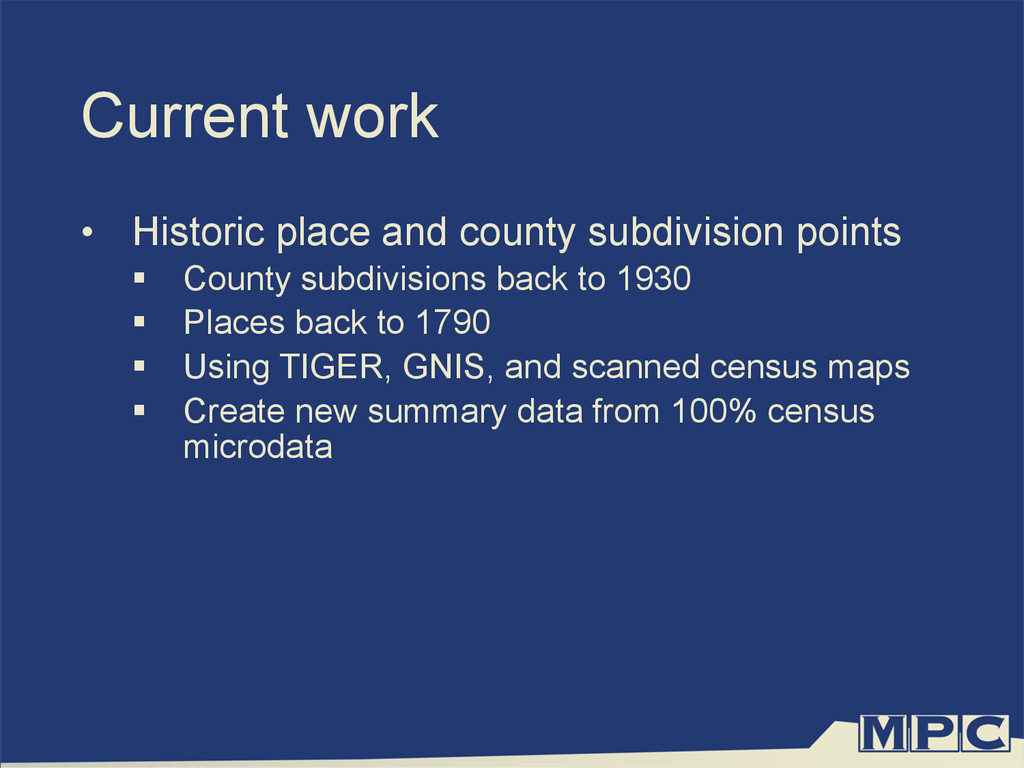
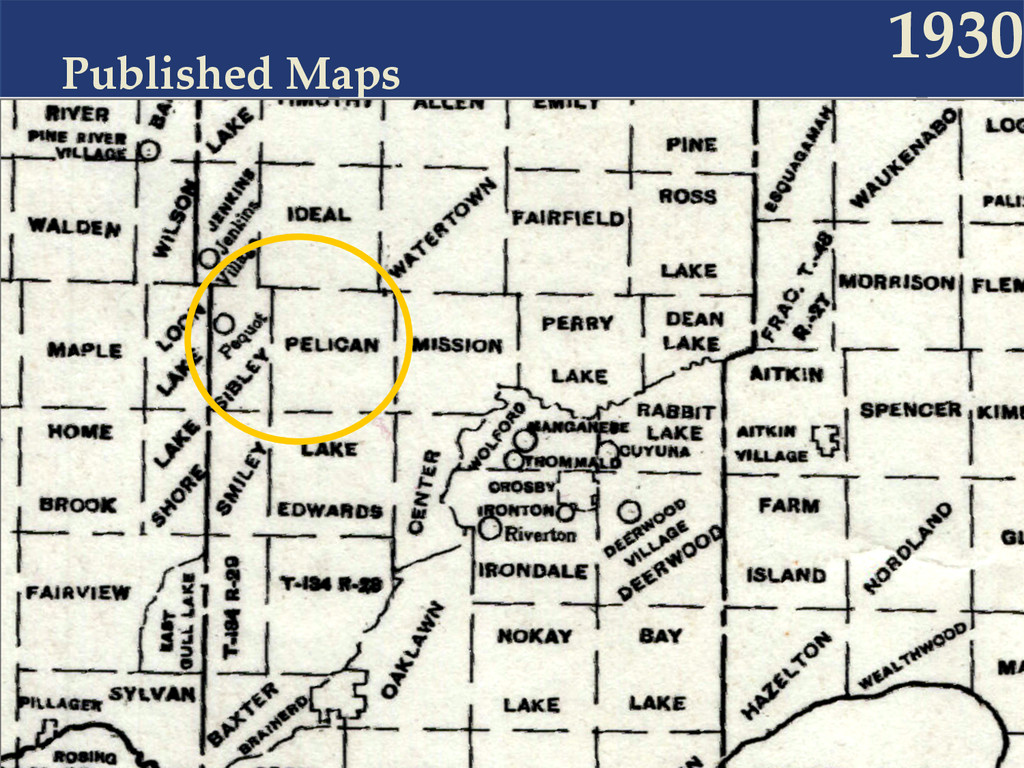
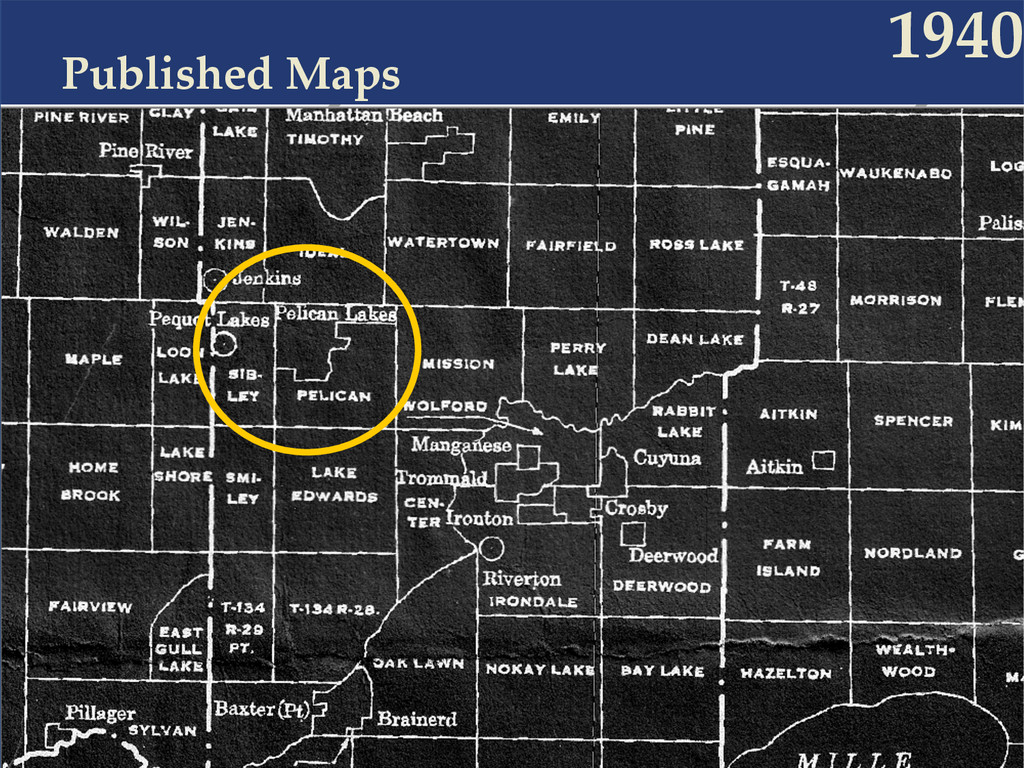
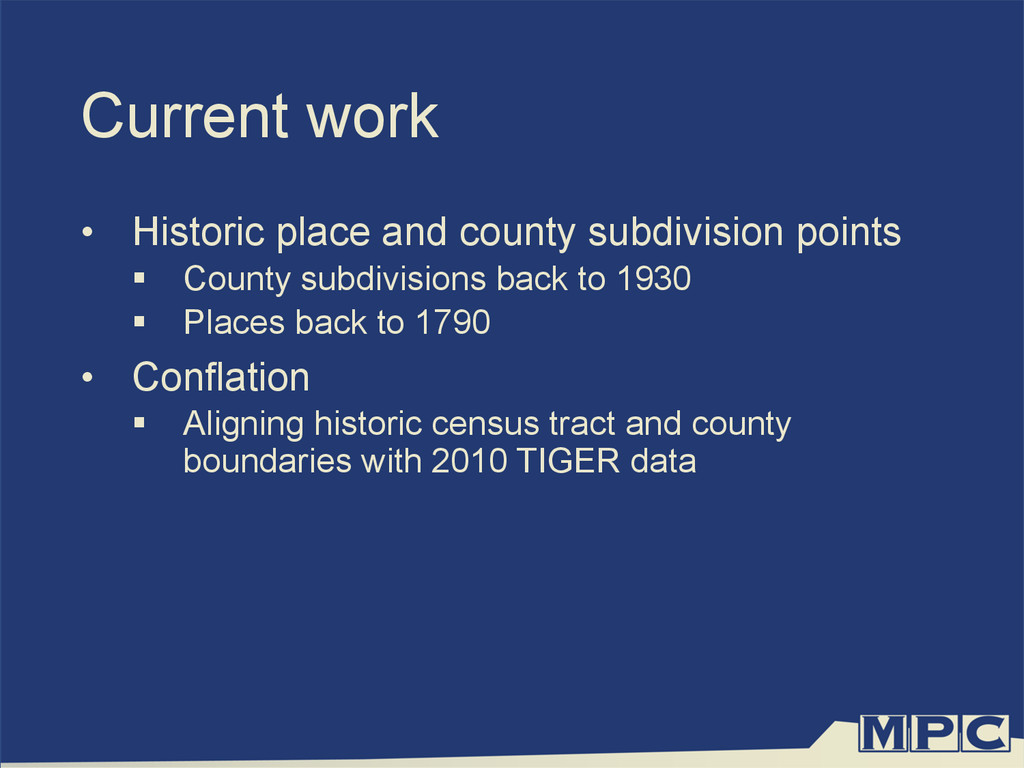
    View Slide

  9. Pre-1990 tract construction
    process

    View Slide

  10. Pre-1990 tract construction
    process

    View Slide

  11. Pre-1990 tract construction
    process

    View Slide

  12. 1910 Boston tract definitions

    View Slide

  13. Boston 1910

    View Slide

  14. http://www2.census.gov/geo/pdfs/reference/geodiagram.pdf

    View Slide

  15. http://www2.census.gov/geo/pdfs/reference/geodiagram.pdf

    View Slide

  16. http://www2.census.gov/geo/pdfs/reference/geodiagram.pdf

    View Slide

  17. http://www2.census.gov/geo/pdfs/reference/geodiagram.pdf

    View Slide

  18. http://www2.census.gov/geo/pdfs/reference/geodiagram.pdf

    View Slide

  19. Current work
    •  Historic place and county subdivision points
    §  County subdivisions back to 1930
    §  Places back to 1790
    §  Using TIGER, GNIS, and scanned census maps
    §  Create new summary data from 100% census
    microdata

    View Slide

  20. Published  Maps
    1930

    View Slide

  21. Published  Maps
    1940

    View Slide

  22. Current work
    •  Historic place and county subdivision points
    §  County subdivisions back to 1930
    §  Places back to 1790
    •  Conflation
    §  Aligning historic census tract and county
    boundaries with 2010 TIGER data

    View Slide

  23. View Slide

  24. View Slide

  25. IPUMS-USA
    Integrated – consistent codes, labels and docs
    Public – anonymized, downloadable
    Microdata – individual-level
    Series – pooled data over time and place

    View Slide

  26. Microdata
    •  Shows full range of individual responses
    •  Enables custom tables and sophisticated
    analyses
    •  BUT, suppression is an major issue

    View Slide

  27. Public Use Microdata Areas (PUMAs)
    •  Smallest geographic unit identified in
    microdata
    •  Minimum population = 100,000
    •  Delineated by states (not Census Bureau)
    after each decennial census

    View Slide

  28. https://usa.ipums.org/usa/volii/puma_mn5.shtml
    1990 PUMA composition

    View Slide

  29. https://usa.ipums.org/usa/volii/ctygrp_mn5.shtml
    1980 County Group
    Composition

    View Slide

  30. View Slide

  31. https://usa.ipums.org/usa/volii/2010PUMAS.shtml

    View Slide

  32. Limitations
    •  Delineation rules change = inconsistent
    boundaries over time
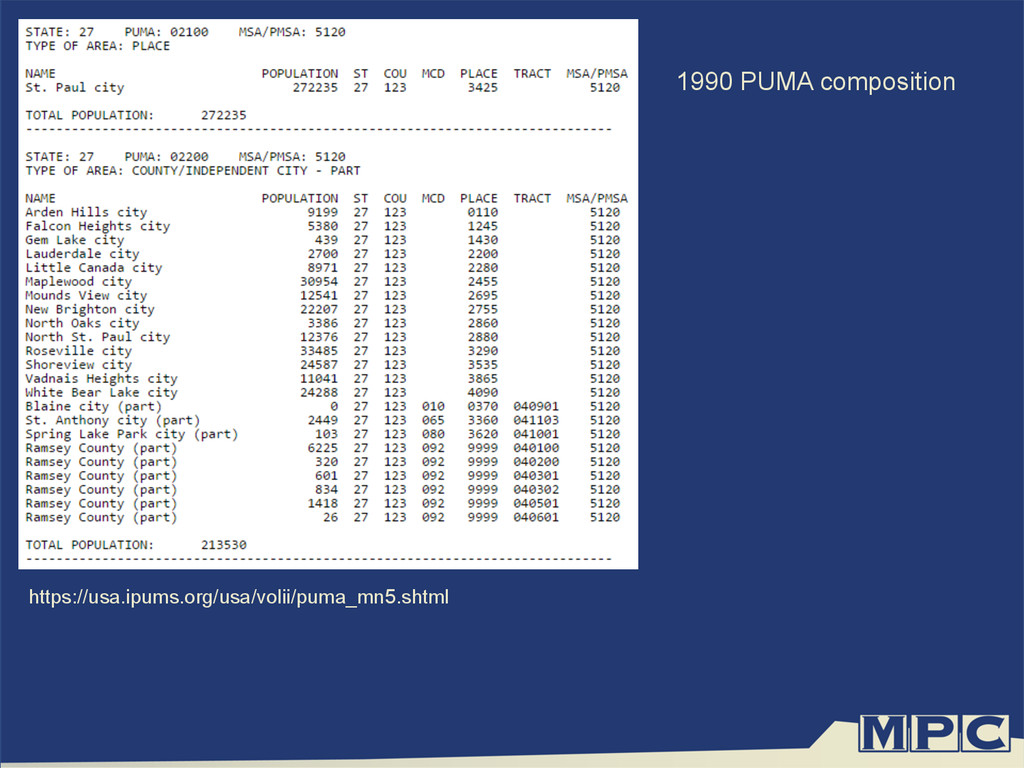
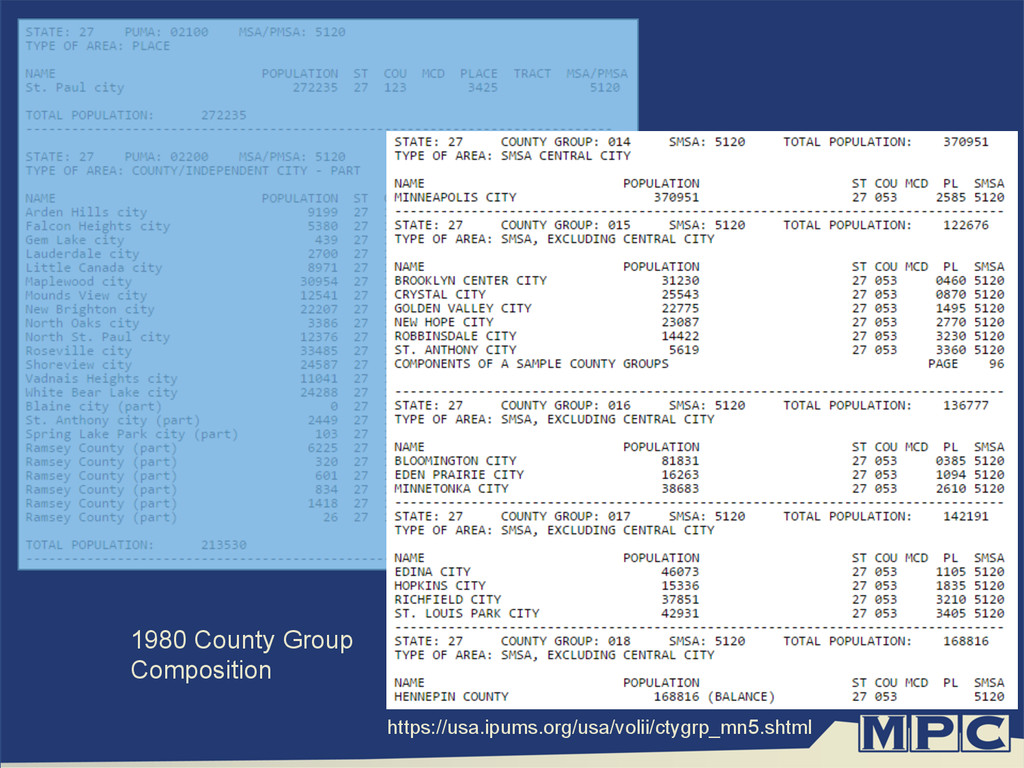
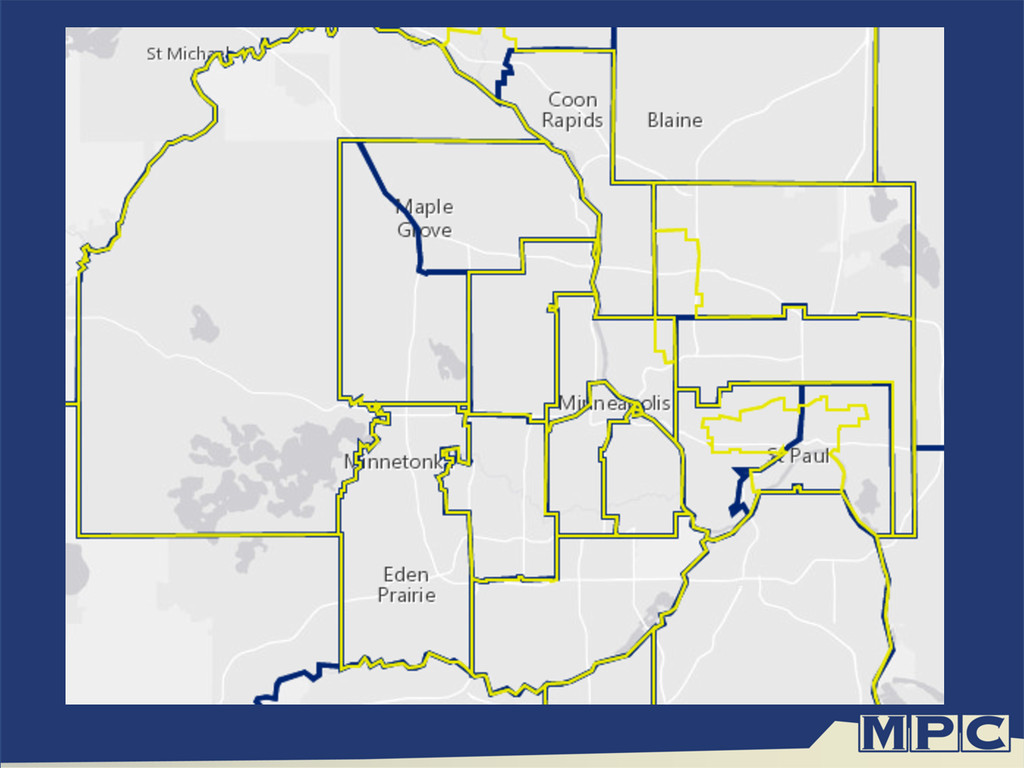
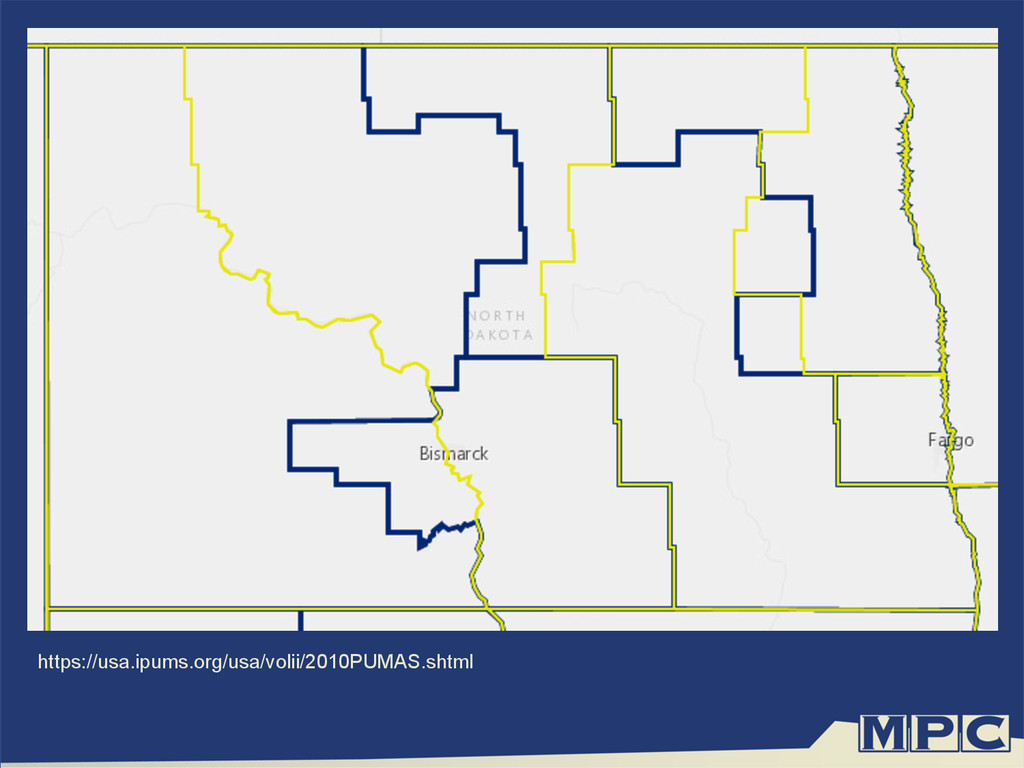
    •  We created consistent PUMAs covering the
    1980-2000 time period (through visual
    inspection) and the 2000-2010 time period
    (through an automated algorithm)

    View Slide

  33. View Slide

  34. Terra Populus Data Domains
    Environment
    Population
    Individuals
    and
    households
    Areal
    Data
    Land cover
    Land use
    Climate
    Microdata

    View Slide

  35. Location-Based Integration
    Summarized  
    environmental  
    and  popula1on  
    Microdata
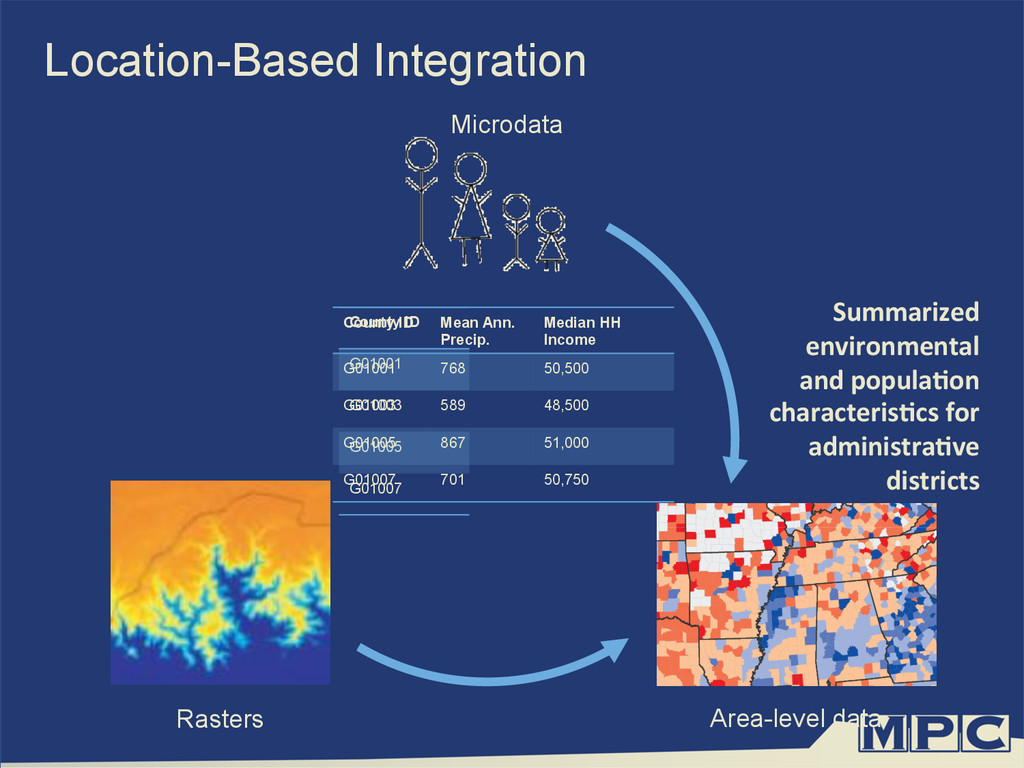
    Area-level data
    Rasters
    characteris1cs  for  
    administra1ve  
    districts  
    County ID
    G01001
    G01003
    G01005
    G01007
    County ID Mean Ann.
    Precip.
    Median HH
    Income
    G01001 768 50,500
    G01003 589 48,500
    G01005 867 51,000
    G01007 701 50,750
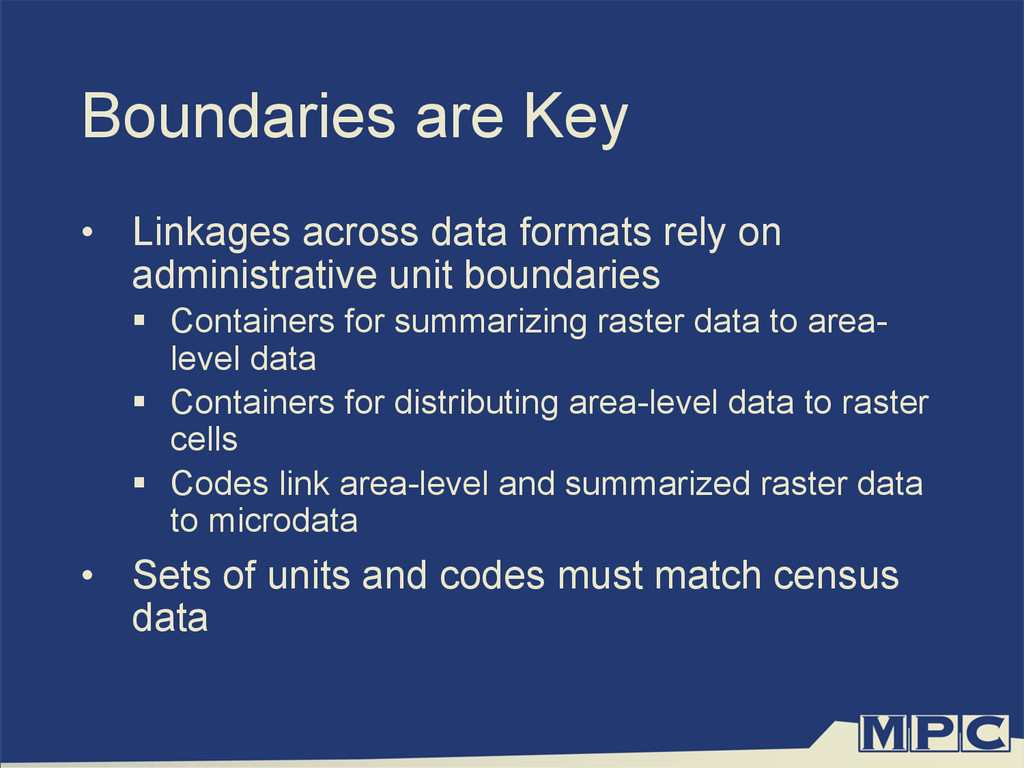
    View Slide

  36. Boundaries are Key
    •  Linkages across data formats rely on
    administrative unit boundaries
    §  Containers for summarizing raster data to area-
    level data
    §  Containers for distributing area-level data to raster
    cells
    §  Codes link area-level and summarized raster data
    to microdata
    •  Sets of units and codes must match census
    data

    View Slide

  37. Terra Populus – GIS data
    •  Create an ‘authoritative’ (as possible) set of
    first and second administrative level
    boundaries
    •  From most recent census back to ~1960s
    •  Disseminate freely

    View Slide

  38. View Slide

  39. View Slide

  40. View Slide

  41. View Slide

  42. View Slide

  43. GIS data – non-IPUMS countries
    Afghanistan  
    Bosnia  and  
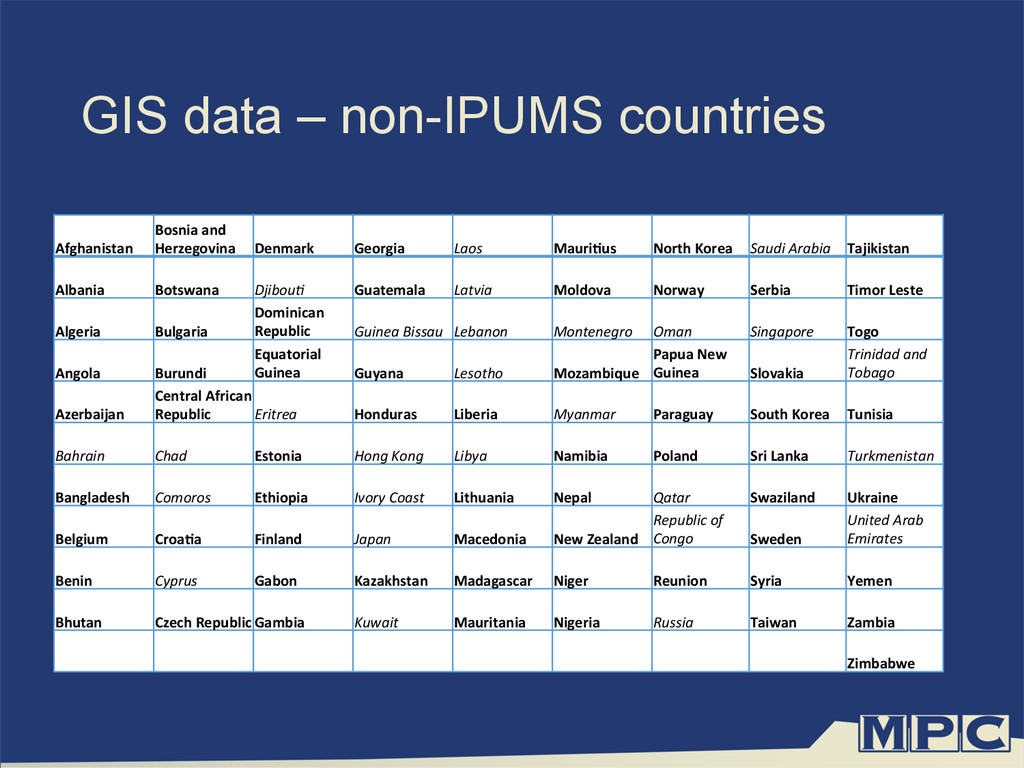
    Herzegovina   Denmark   Georgia   Laos   Mauri1us   North  Korea   Saudi  Arabia   Tajikistan  
    Albania   Botswana   Djibou/   Guatemala   Latvia   Moldova   Norway   Serbia   Timor  Leste  
    Algeria   Bulgaria  
    Dominican  
    Republic   Guinea  Bissau   Lebanon   Montenegro   Oman   Singapore   Togo  
    Angola   Burundi  
    Equatorial  
    Guinea   Guyana   Lesotho   Mozambique  
    Papua  New  
    Guinea   Slovakia  
    Trinidad  and  
    Tobago  
    Azerbaijan  
    Central  African  
    Republic   Eritrea   Honduras   Liberia   Myanmar   Paraguay   South  Korea   Tunisia  
    Bahrain   Chad   Estonia   Hong  Kong   Libya   Namibia   Poland   Sri  Lanka   Turkmenistan  
    Bangladesh   Comoros   Ethiopia   Ivory  Coast   Lithuania   Nepal   Qatar   Swaziland   Ukraine  
    Belgium   Croa1a   Finland   Japan   Macedonia   New  Zealand  
    Republic  of  
    Congo   Sweden  
    United  Arab  
    Emirates  
    Benin   Cyprus   Gabon   Kazakhstan   Madagascar   Niger   Reunion   Syria   Yemen  
    Bhutan   Czech  Republic  Gambia   Kuwait   Mauritania   Nigeria   Russia   Taiwan   Zambia  
    Zimbabwe  

    View Slide

  44. Where do you get our data?
    •  https://www.nhgis.org
    •  https://usa.ipums.org/usa/volii/tgeotools.shtml
    •  https://www.terrapop.org

    View Slide

  45. NSF and NIH
    All staff and graduate students who have
    worked on these projects
    All of our users

    View Slide