$30 off During Our Annual Pro Sale. View Details »

Workflow for the National Geographic World Atlas Mobile App

Workflow for the National Geographic World Atlas Mobile App

Rosemary Wardley, National Geographic Maps
Steve Gifford, Mousebird Mobile
#nacis2015

Nathaniel V. KELSO

October 16, 2015
Tweet

More Decks by Nathaniel V. KELSO

Other Decks in Education

Transcript

  1. Data Processing Workflow
    for the
    National Geographic
    World Atlas Mobile App
    Rosemary Wardley
    Steve Gifford

    View Slide

  2. Introduction
    World Atlas App
    Previous versions & Problems
    Goals for new app
    Data production
    Data processing
    Conclusions

    View Slide

  3. World Atlas App for iPhone/iPad
    Digital & Interactive Atlas
    Political basemaps
    Flags & Facts
    Search Index
    Statistical Overlays
    Distance Calculator

    View Slide

  4. How  it  was  done  before

    View Slide

  5. How  it  was  done  before

    View Slide

  6. How  it  was  done  before

    View Slide

  7. How  it  was  done  before

    View Slide

  8. How  it  was  done  before

    View Slide

  9. App  Design/UX  Flaws

    View Slide

  10. App  Design/UX  Flaws

    View Slide

  11. App  Design/UX  Flaws

    View Slide

  12. Goals  for  World  Atlas  v.4
    Tighter  control  over  the  data  
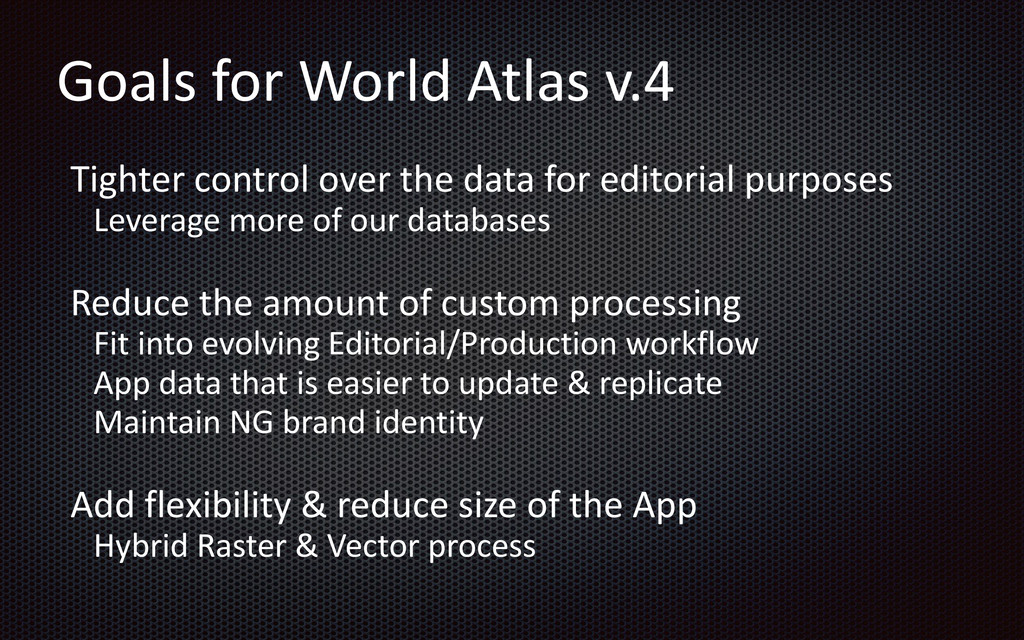
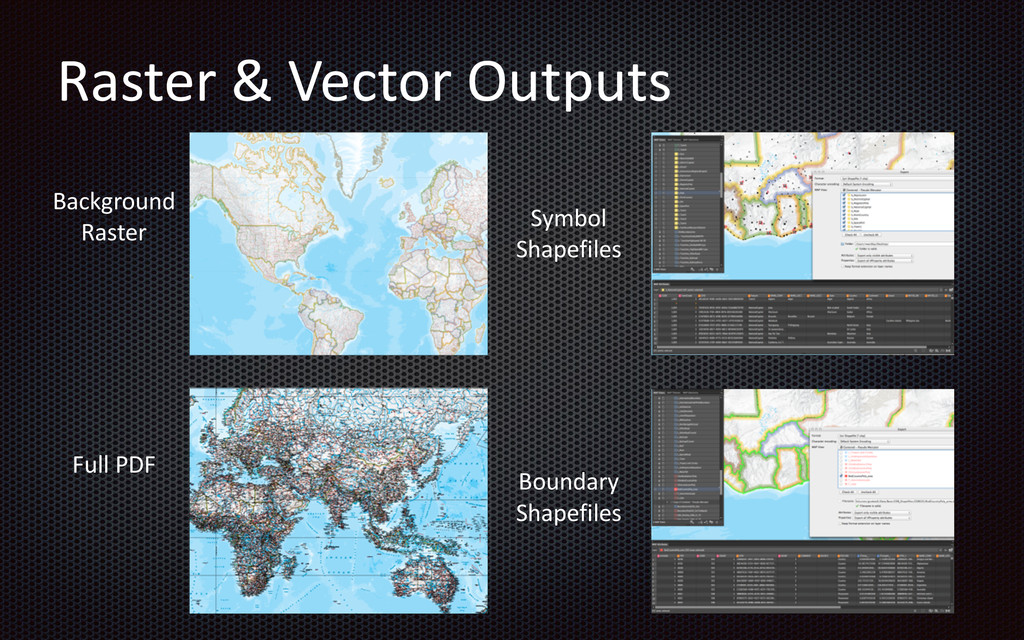
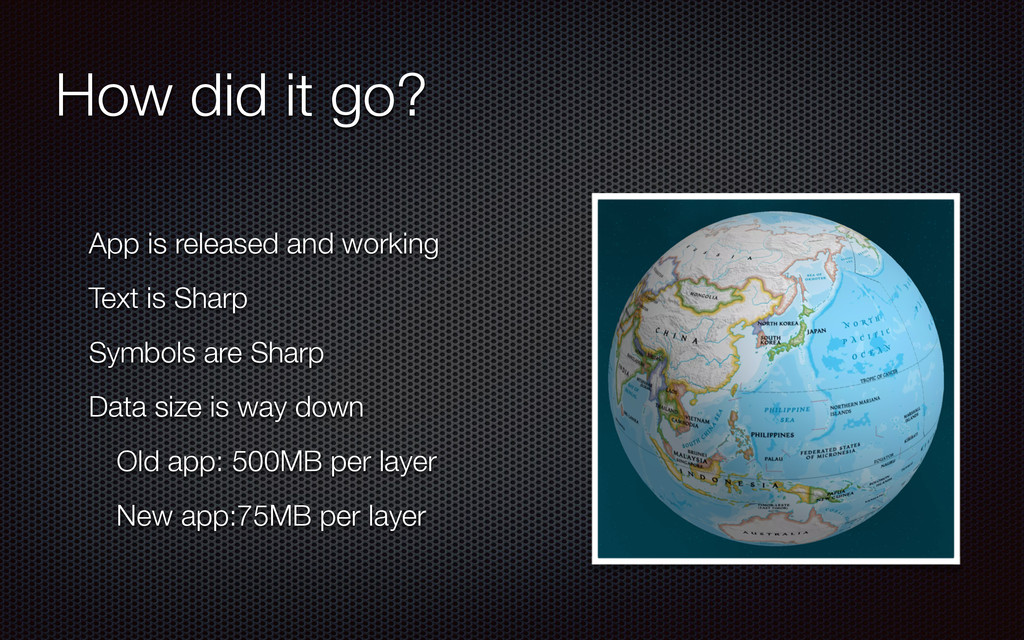
for  editorial  purposes  
    Leverage  more  of  our  databases  
    Reduce  the  amount  of  custom  processing  
    Fit  into  evolving  Editorial/Production  workflow  
    App  data  that  is  easier  to  update  &  replicate  
    Maintain  NG  brand  identity    
    Add  flexibility  &  reduce  size  of  the  App  
    Hybrid  Raster  &  Vector  process

    View Slide

  13. Full  Workflow

    View Slide

  14. Data  Production

    View Slide

  15. Inputs:  Standard  Carto  Datasets
    75  Million  
    Zooms  0-­‐2
    40  Million  
    Zooms  2-­‐4
    20  Million  
    Zooms  5-­‐6
    10  Million  
    Zooms  7-­‐8

    View Slide

  16. Editorial  &  Production  Steps

    View Slide

  17. GFID  match

    View Slide

  18. Flags  &  Facts

    View Slide

  19. Search  Index  Creation

    View Slide

  20. GIS  Database  Steps

    View Slide

  21. Final  Product

    View Slide

  22. Raster  &  Vector  Outputs
    Background  
    Raster
    Full  PDF
    Symbol  
    Shapefiles
    Boundary  
    Shapefiles

    View Slide

  23. Data  Processing

    View Slide

  24. Why Vectors?
    Image Artifacts
    Blurry text & symbols
    Tile edge discontinuities
    Size
    Images are big
    Vectors are small
    Selection Data
    Tapping logic simpler

    View Slide

  25. Vector Processing
    Symbols
    Points from GIS database
    Both visual and selection
    Text
    Extracted from PDF
    Purely visual
    Boundaries
    Areals from GIS database
    Invisible, just for selection

    View Slide

  26. Background Raster
    Including
    Roads, Rivers
    Fills, stipples
    Etc (lots of etc)
    Excluding
    Symbols
    Text

    View Slide

  27. Text Extraction
    Parse the PDF
    Need for each character
    Location
    Rotation
    Size
    Font
    Output to Shapefile

    View Slide

  28. Uploading to Mapbox
    Images basemaps
    Low res everything
    High res blanks
    Vectors
    Symbols
    Text
    Boundaries

    View Slide

  29. Anatomy of a Tile

    View Slide

  30. How did it go?
    App is released and working
    Text is Sharp
    Symbols are Sharp
    Data size is way down
    Old app: 500MB per layer
    New app:75MB per layer

    View Slide

  31. Conclusions:  Data  Update  Process

    View Slide

  32. Conclusions:  Software  Used
    Mapbox Studio

    View Slide

  33. View Slide

  34. Wrapup & Contact
    Rosemary Wardley
    [email protected]
    nationalgeographic.com
    Steve Gifford
    [email protected]
    mousebird.github.io/WhirlyGlobe/

    View Slide