to developers and organizations – SIRI Vehicle Monitoring • JSON, XML over HTTP – GTFS • ASCII files in ZIP archive, downloadable with browser – GTFS-RT Vehicle Positions • JSON over HTTP and Google Protocol Buffers (binary, downloadable by browser)
to know – How much data our server was delivering to our clients – Which data was mostly used • In addition, we were interested in – Who was using our data (broad strokes) – Were there any usage patterns • We didn't want to pay much. =)
implement custom statistics logic: use a database, record requests as they arrive etc. • However: – All our data was on top of HTTP – We were anyways using Apache to handle or proxy all our requests – Apache logs every request that comes in, so why not use that? • We ended up using AWStats
use • Reads Apache web server logs, and produces reports based on those. Has a report interface, too. – Overall request statistics – Breakdowns by time (year, month etc..), URL and countries – And a lot more • We set that up, and put it where everyone can see it. =) • http://data.itsfactory.fi/statistics/awstats.pl
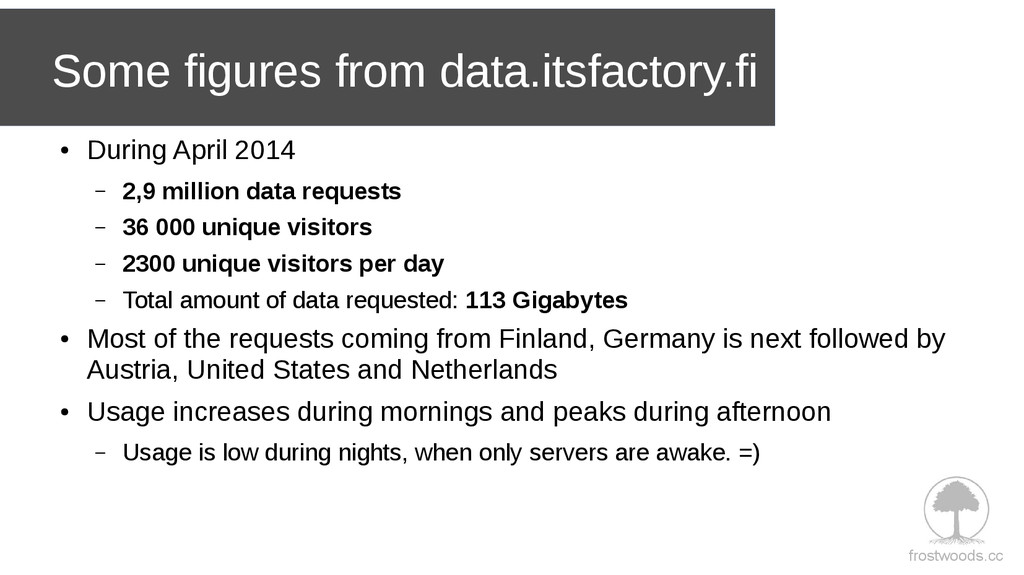
2,9 million data requests – 36 000 unique visitors – 2300 unique visitors per day – Total amount of data requested: 113 Gigabytes • Most of the requests coming from Finland, Germany is next followed by Austria, United States and Netherlands • Usage increases during mornings and peaks during afternoon – Usage is low during nights, when only servers are awake. =)


 opendatatre
 pfn
pfn
 ykanoh
 kentarofujii
 satomasahiro2005
 kizawa2020
 yut0naga1_fa
 terapyon
 daidaidai
 teamlab
 yamanoku
 tokuty
 raspython3
 mayatellez
 addyosmani
 tanoku
 andyhume
 speakerdeck
 irinanazarova
 techseoconnect
 uxyall
 lcolladotor
 tamaranovitovic
 katarinadahlin

![frostwoods.cc Thank you! [email protected]](https://files.speakerdeck.com/presentations/20884f90d2d101311e317a88ebacabb8/slide_6.jpg)