Upgrade to Pro — share decks privately, control downloads, hide ads and more …

[Kubecon Europe 2023] Ingesting 6.5 Tb of Telemetry Data Daily Through Open Telemetry Protocol and Collectors

[Kubecon Europe 2023] Ingesting 6.5 Tb of Telemetry Data Daily Through Open Telemetry Protocol and Collectors

Presentation video: https://www.youtube.com/watch?v=aDysORX1zIs

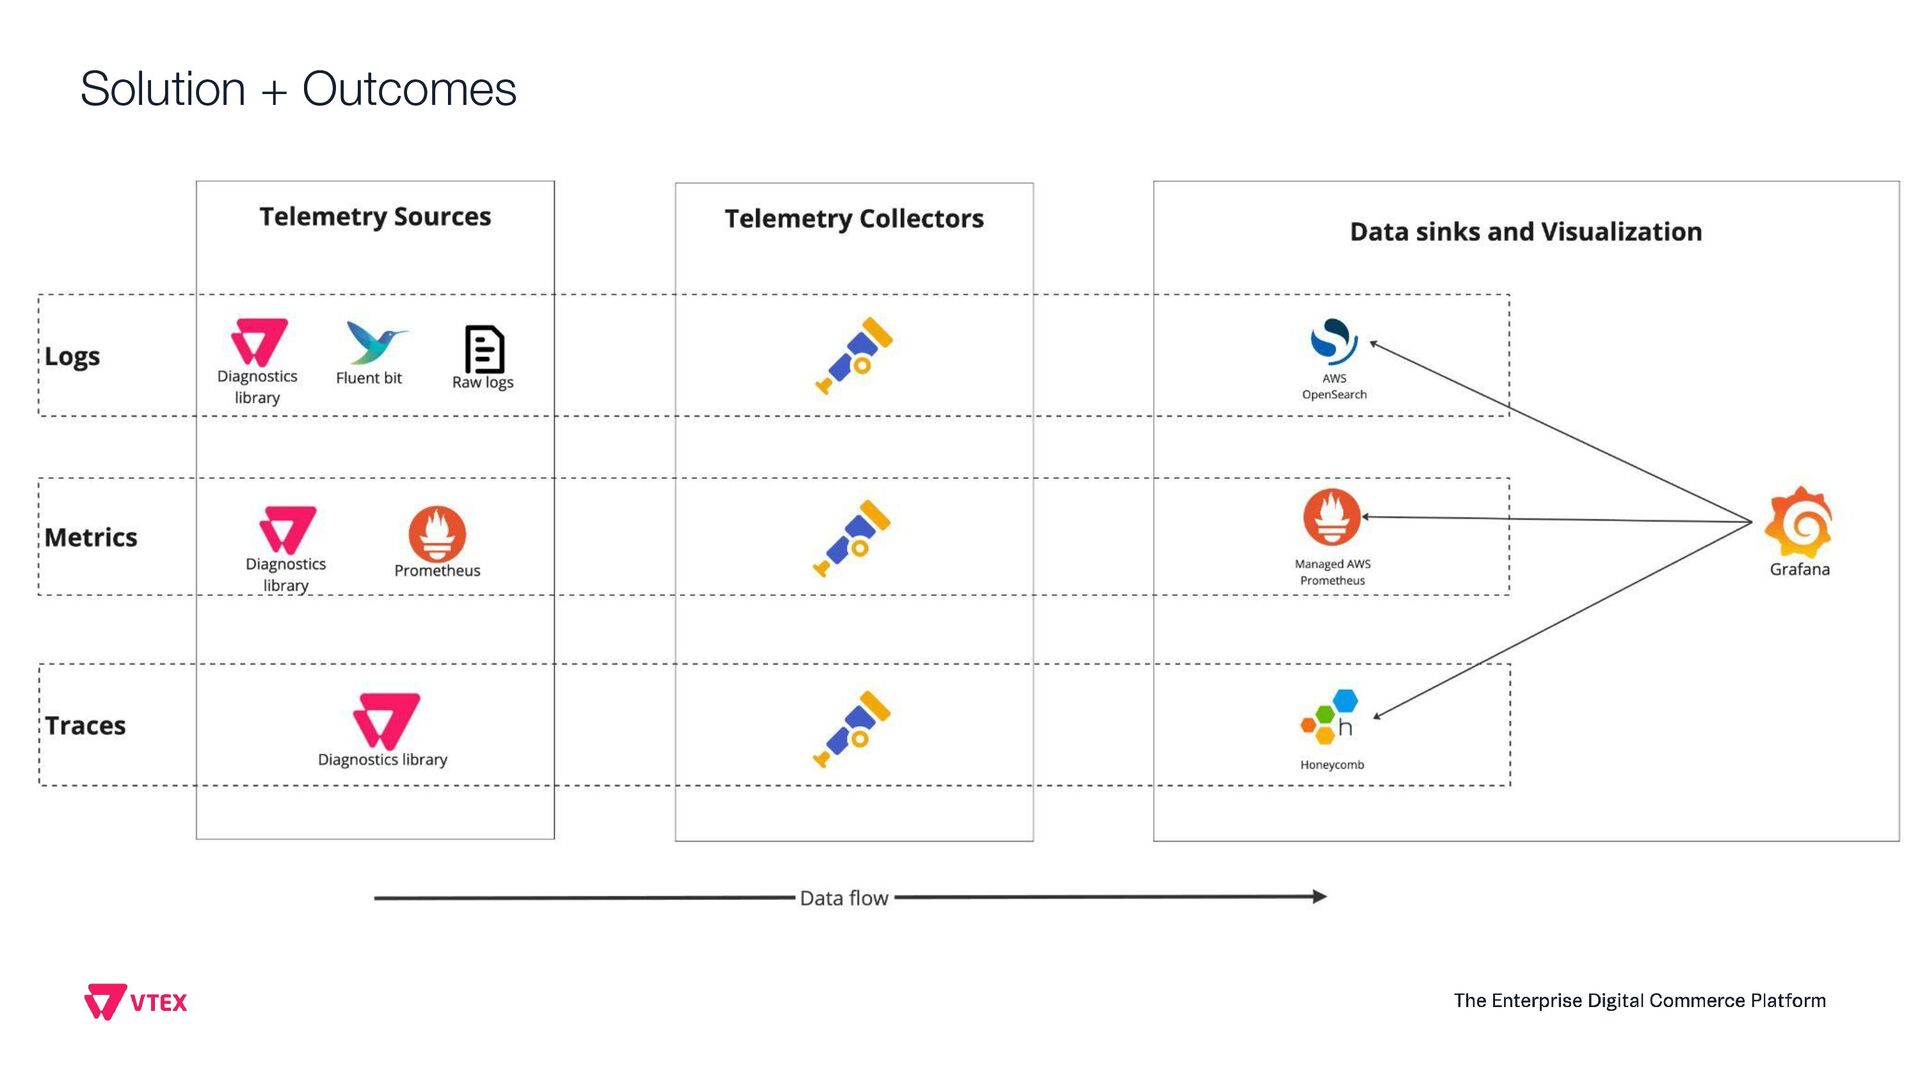
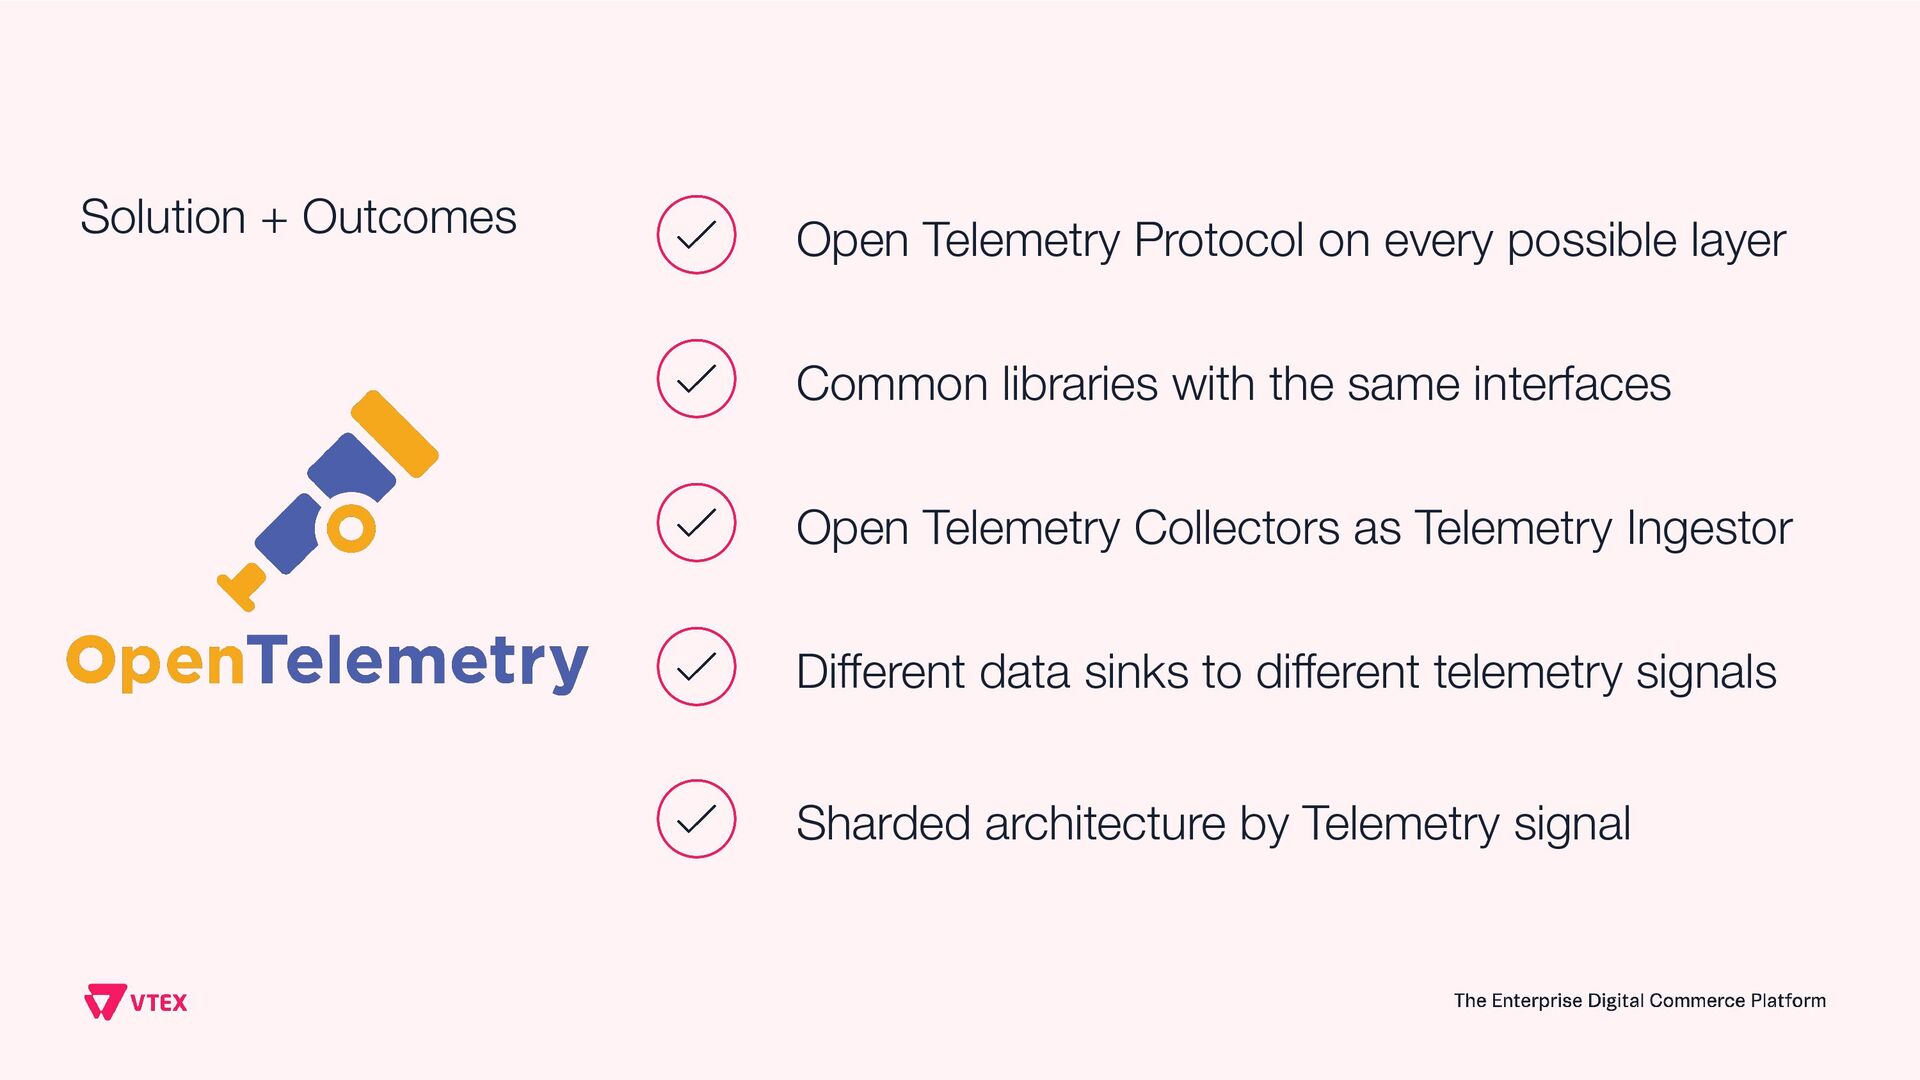
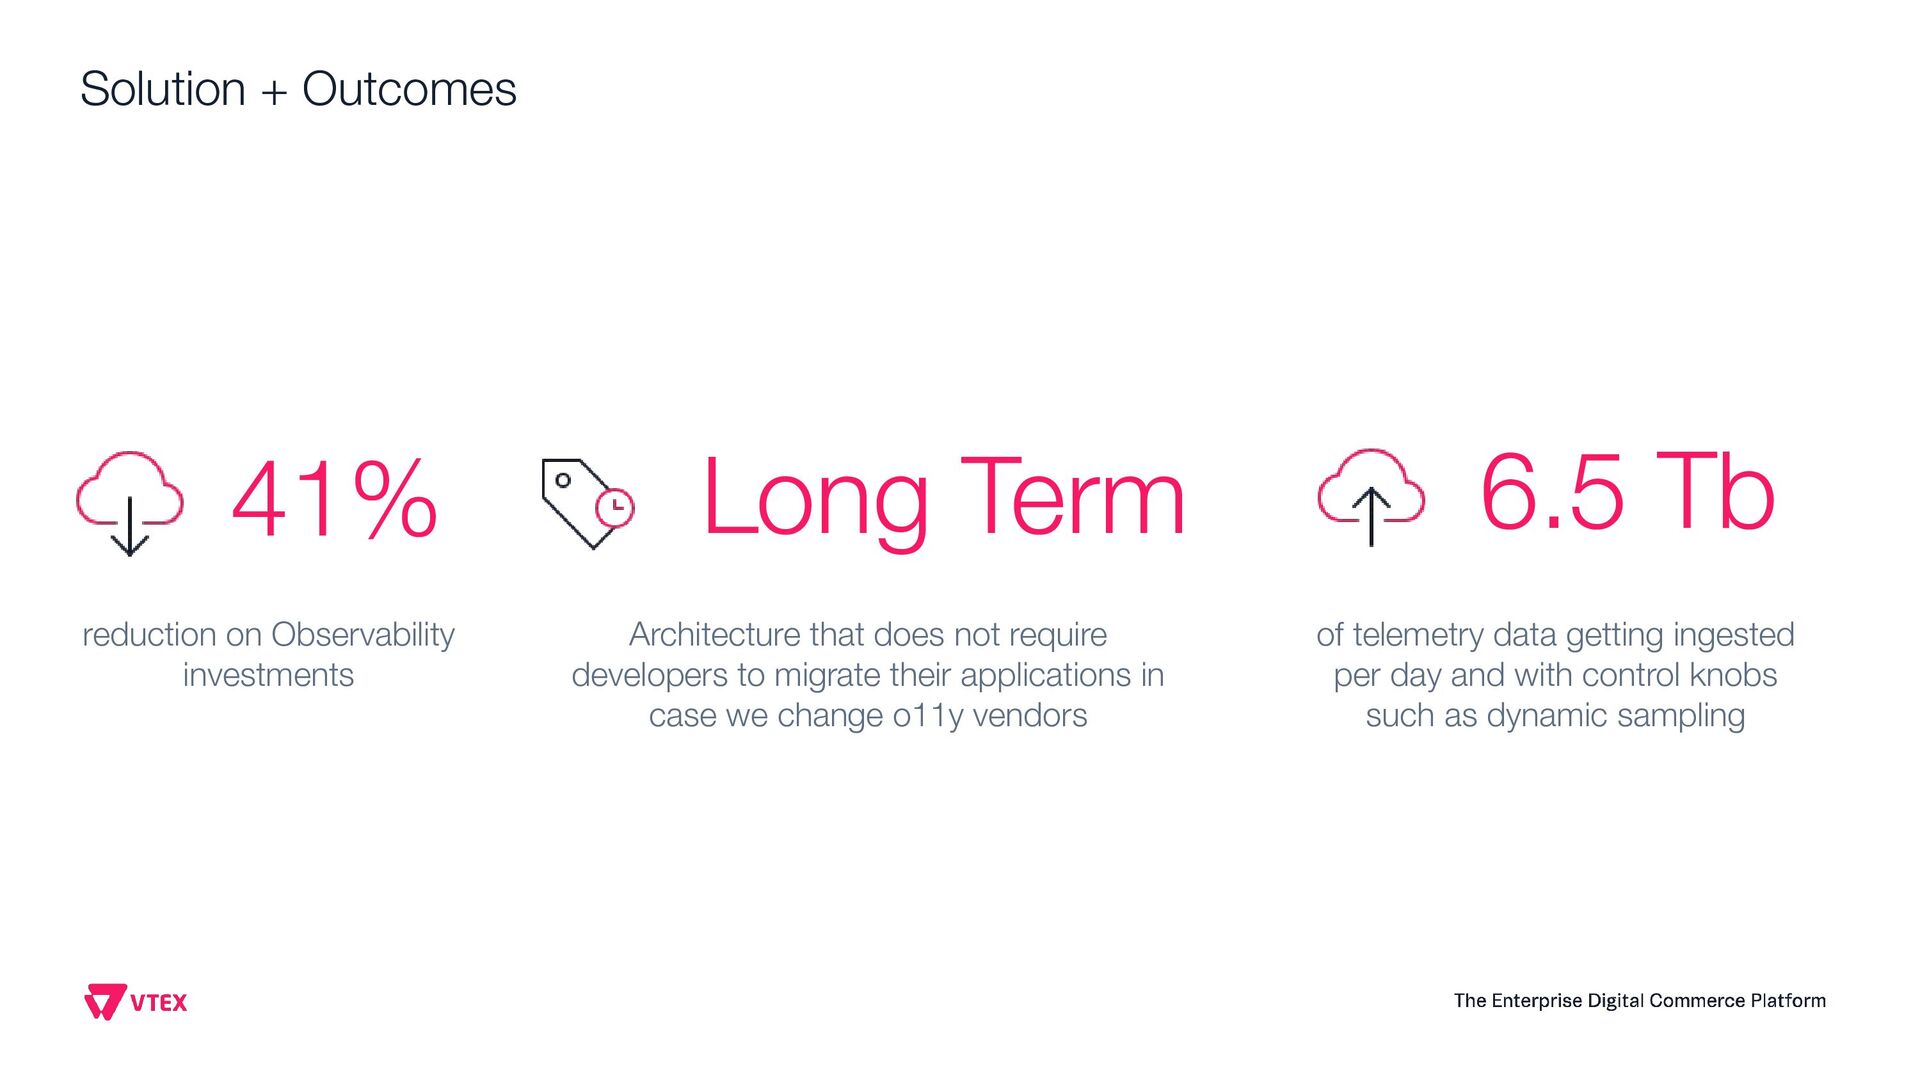
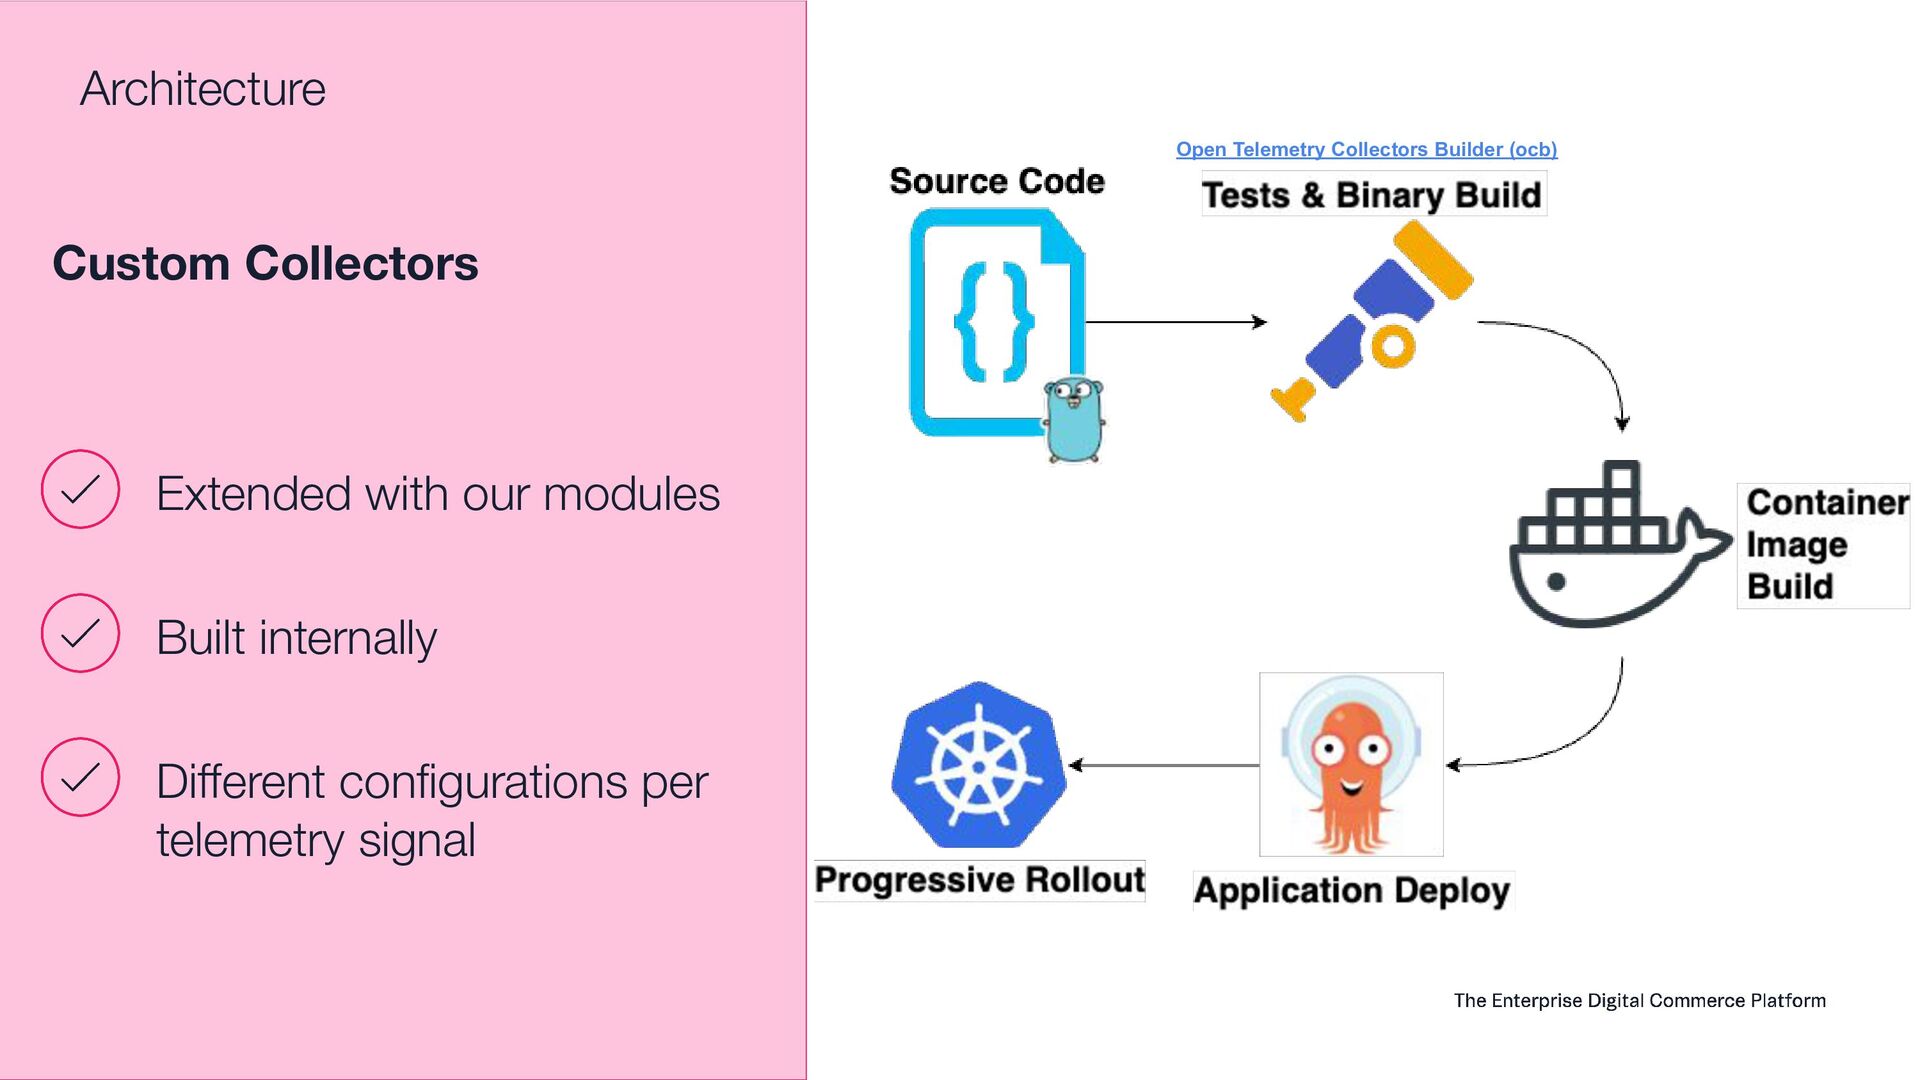
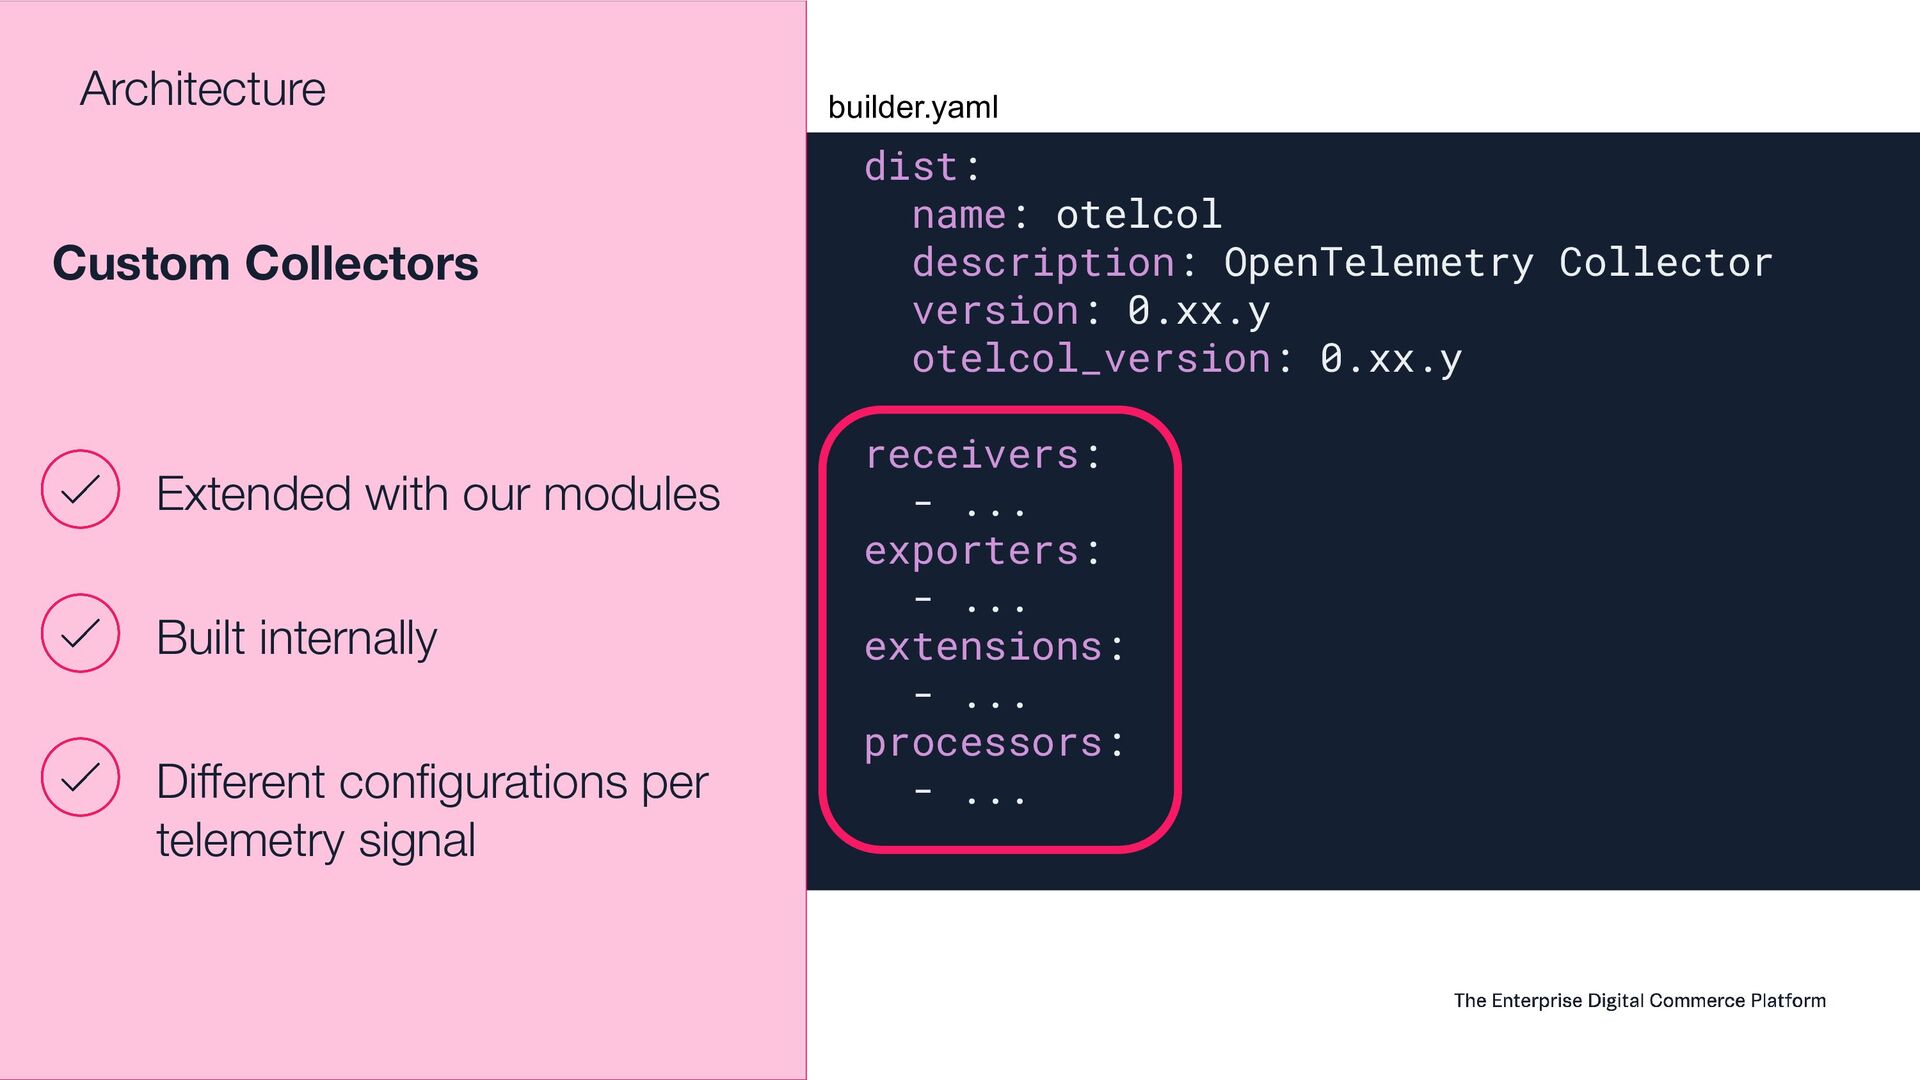
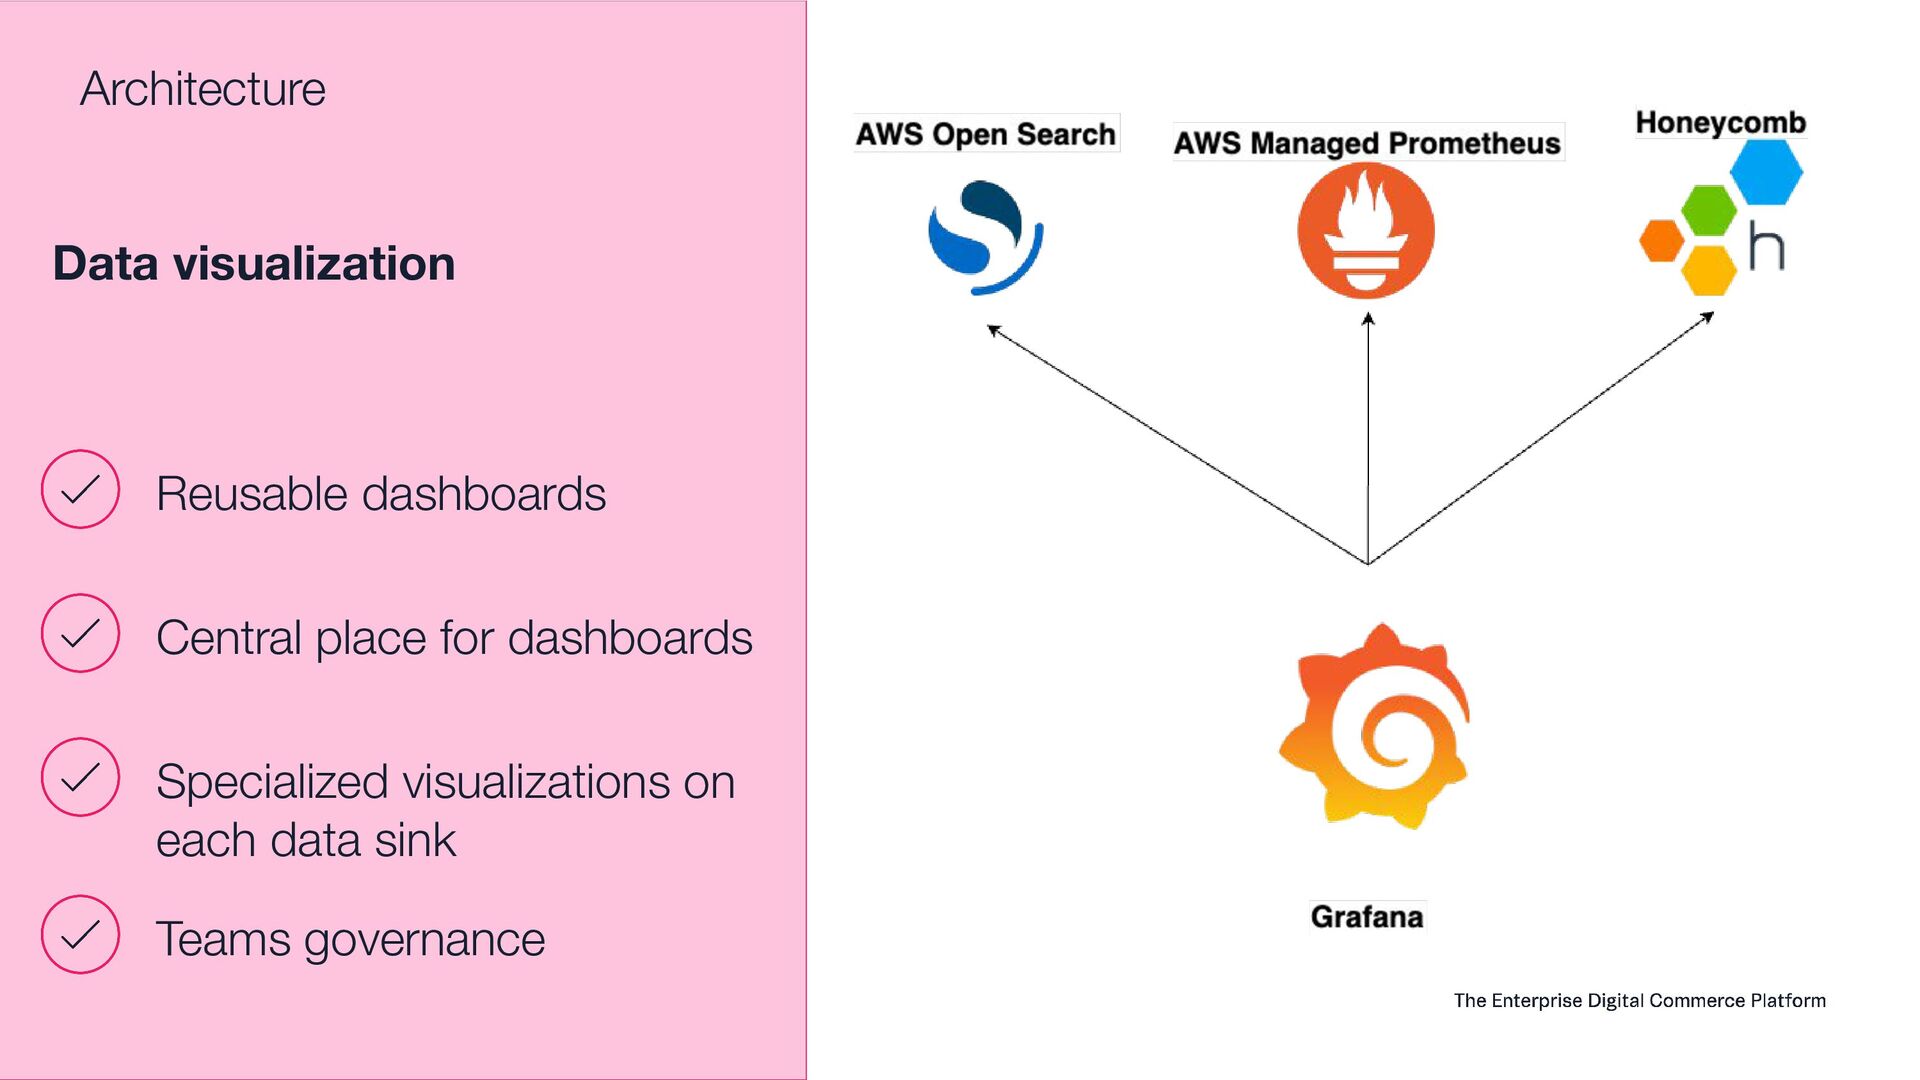
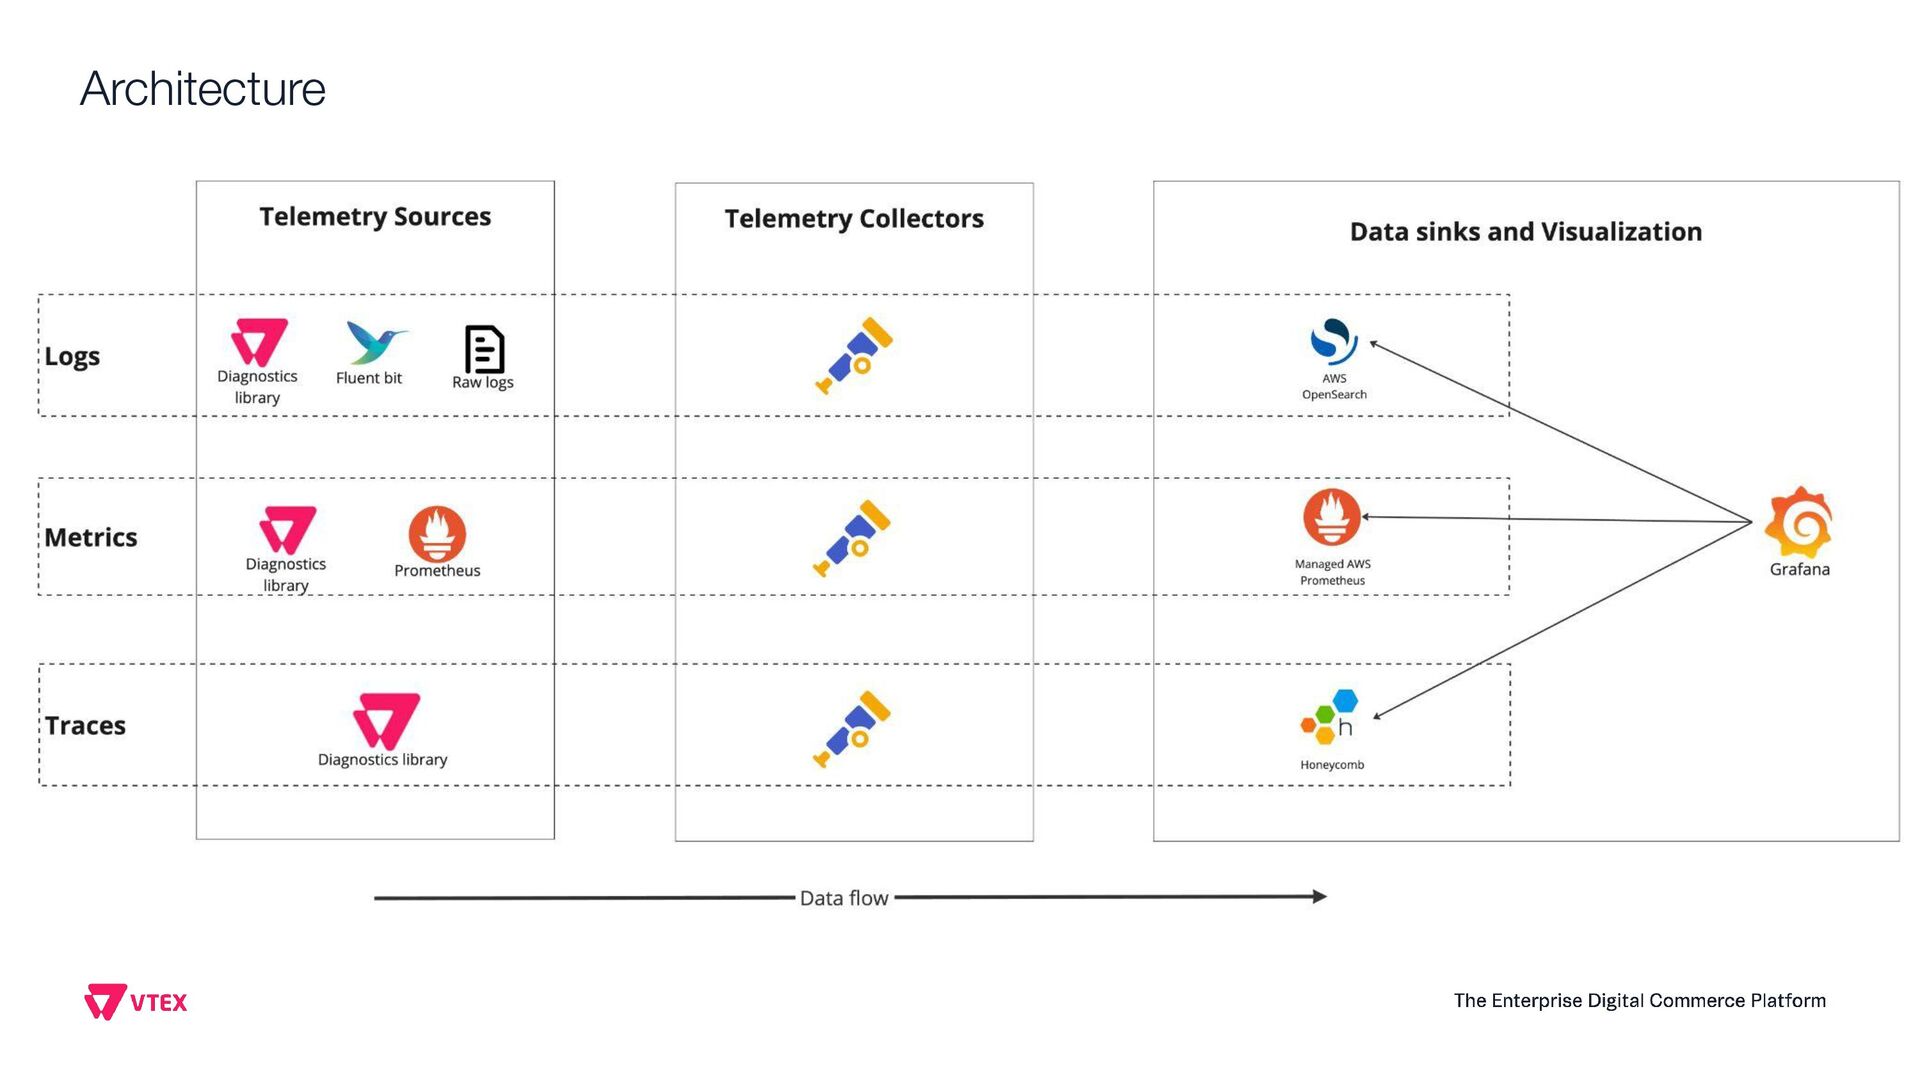
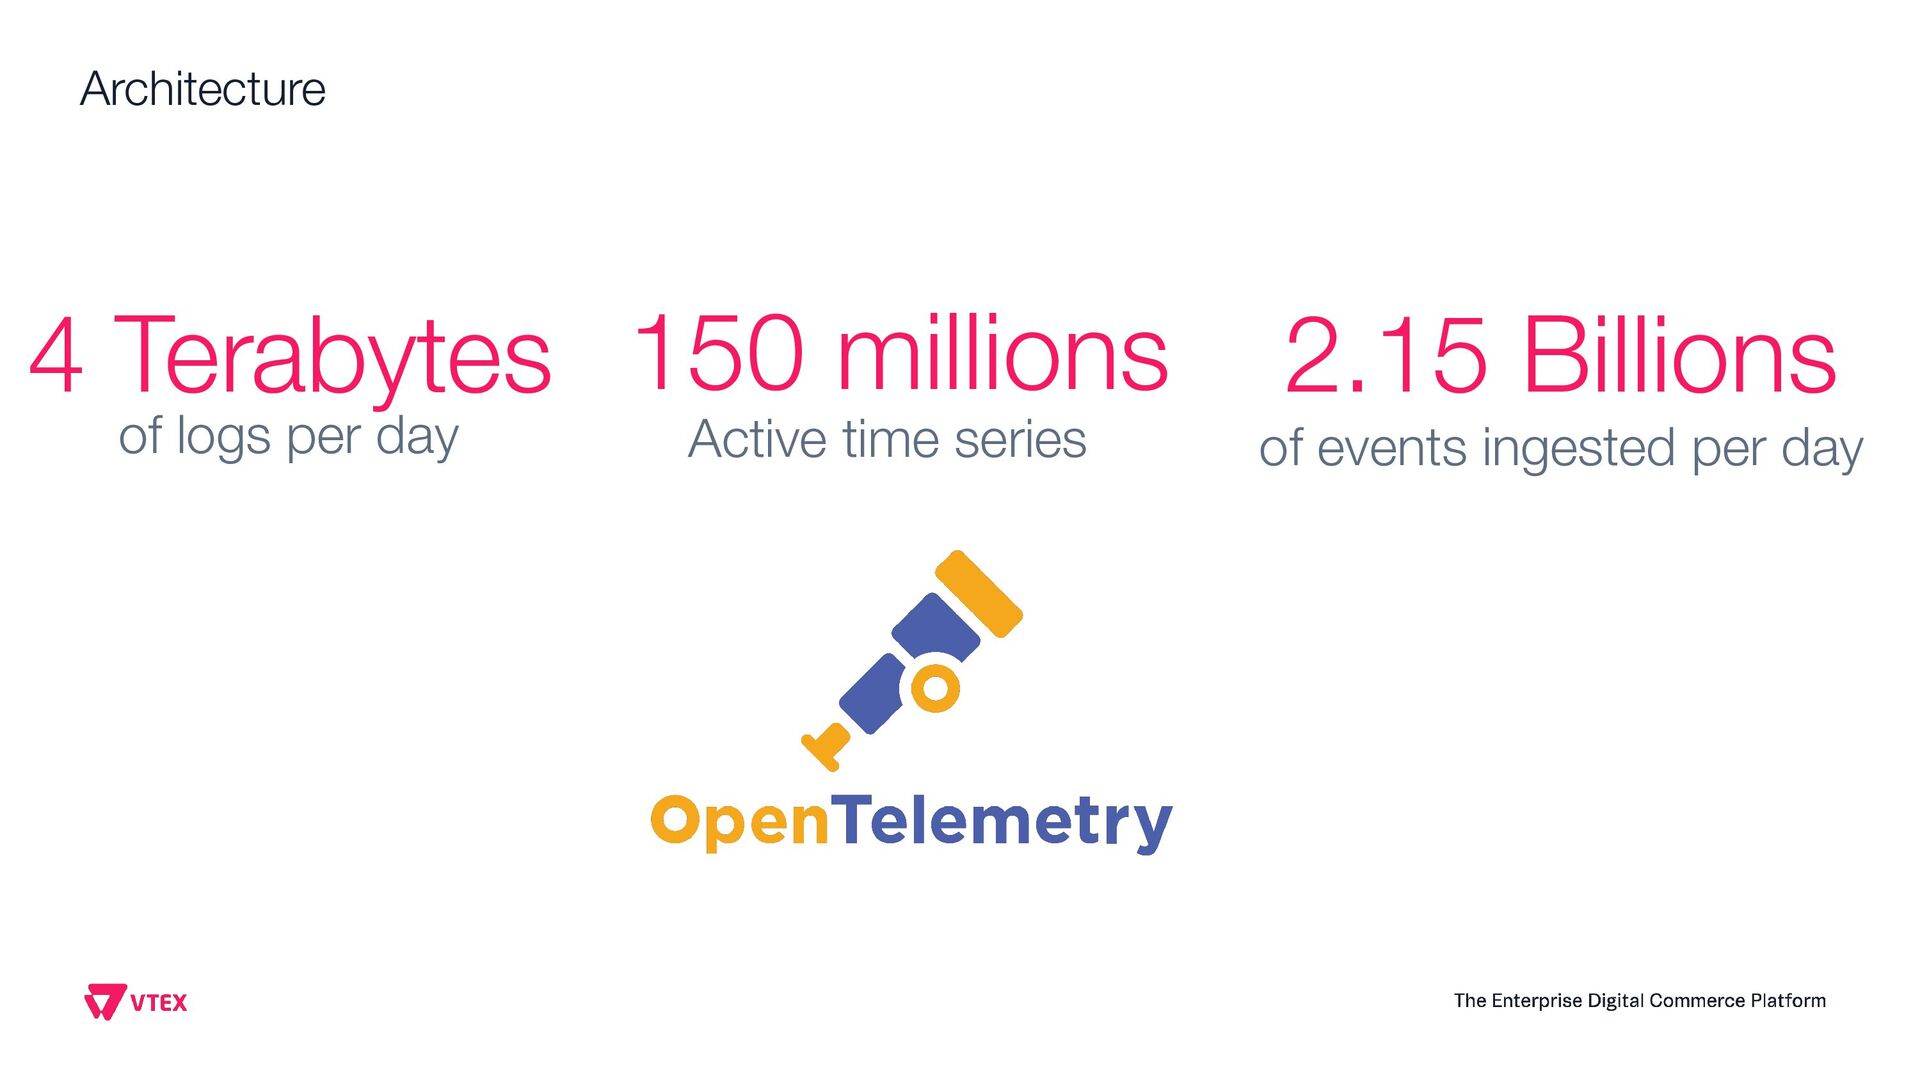
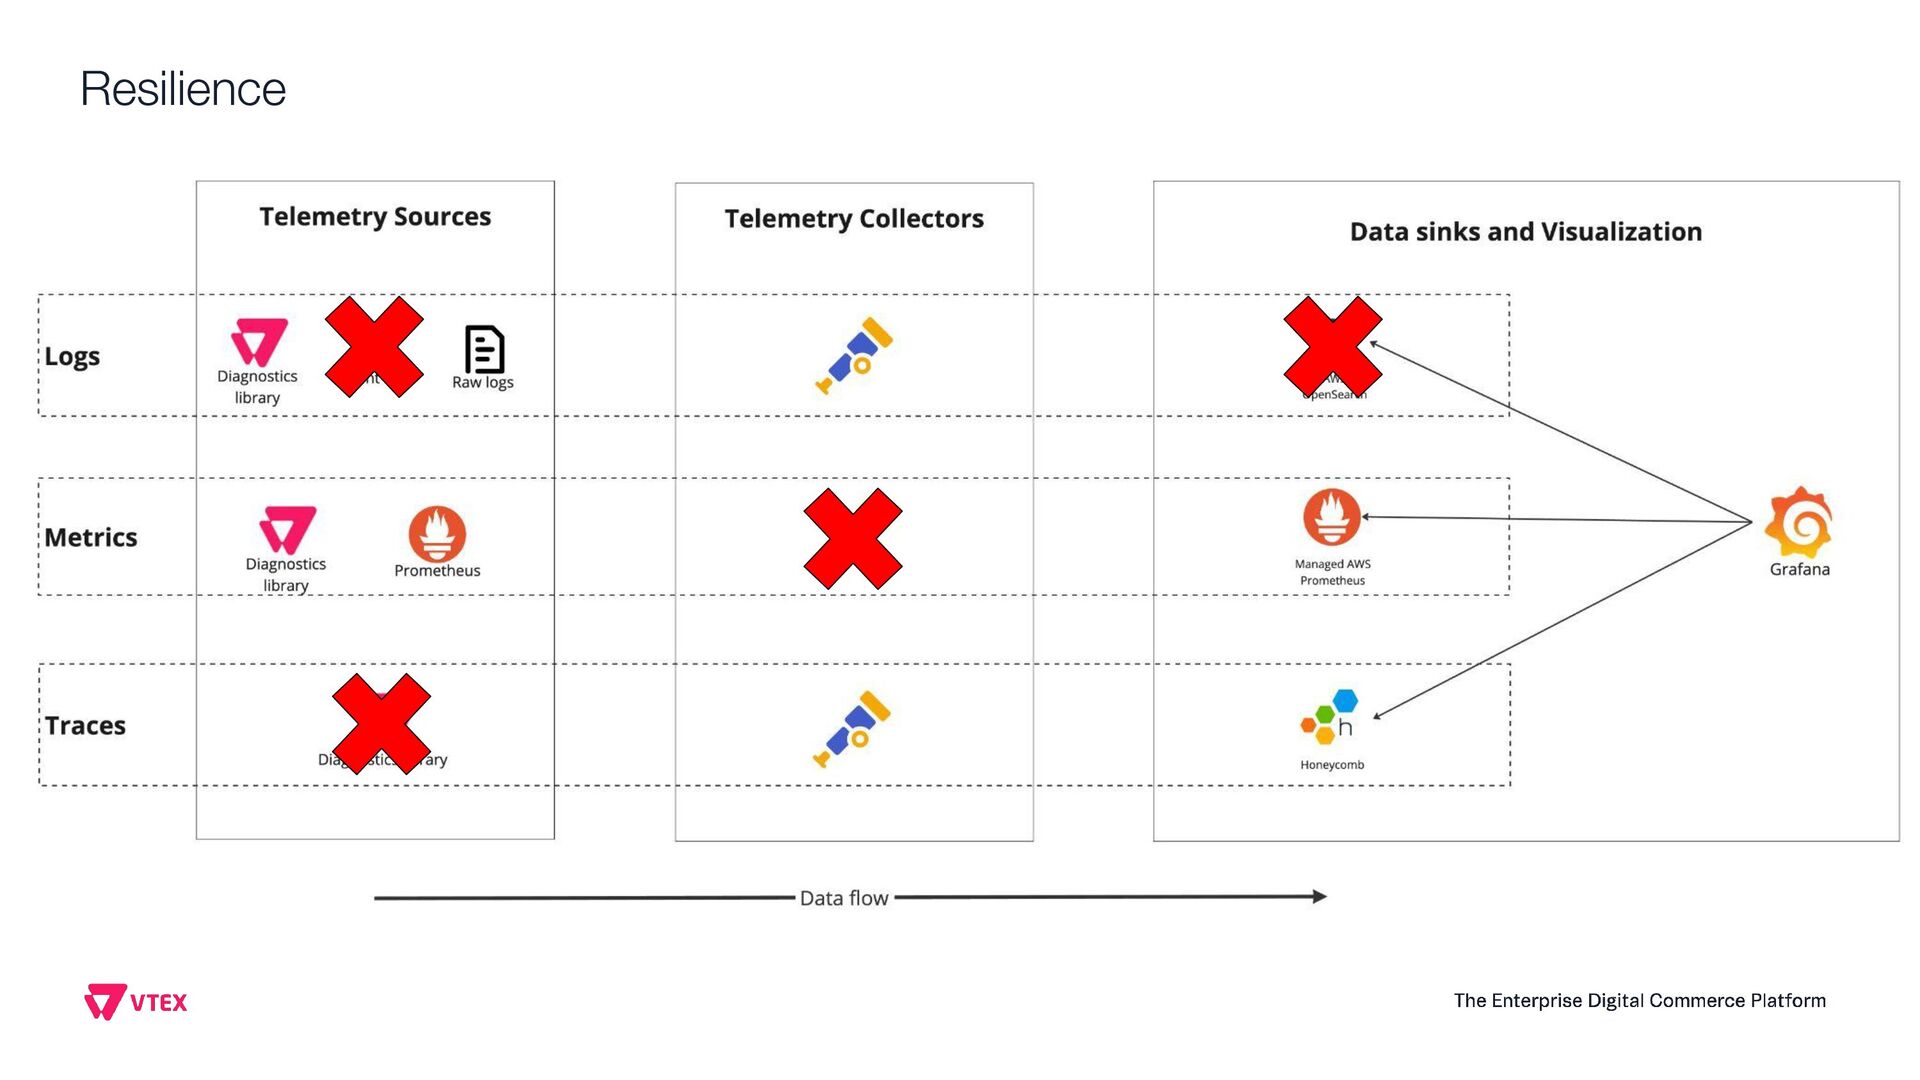
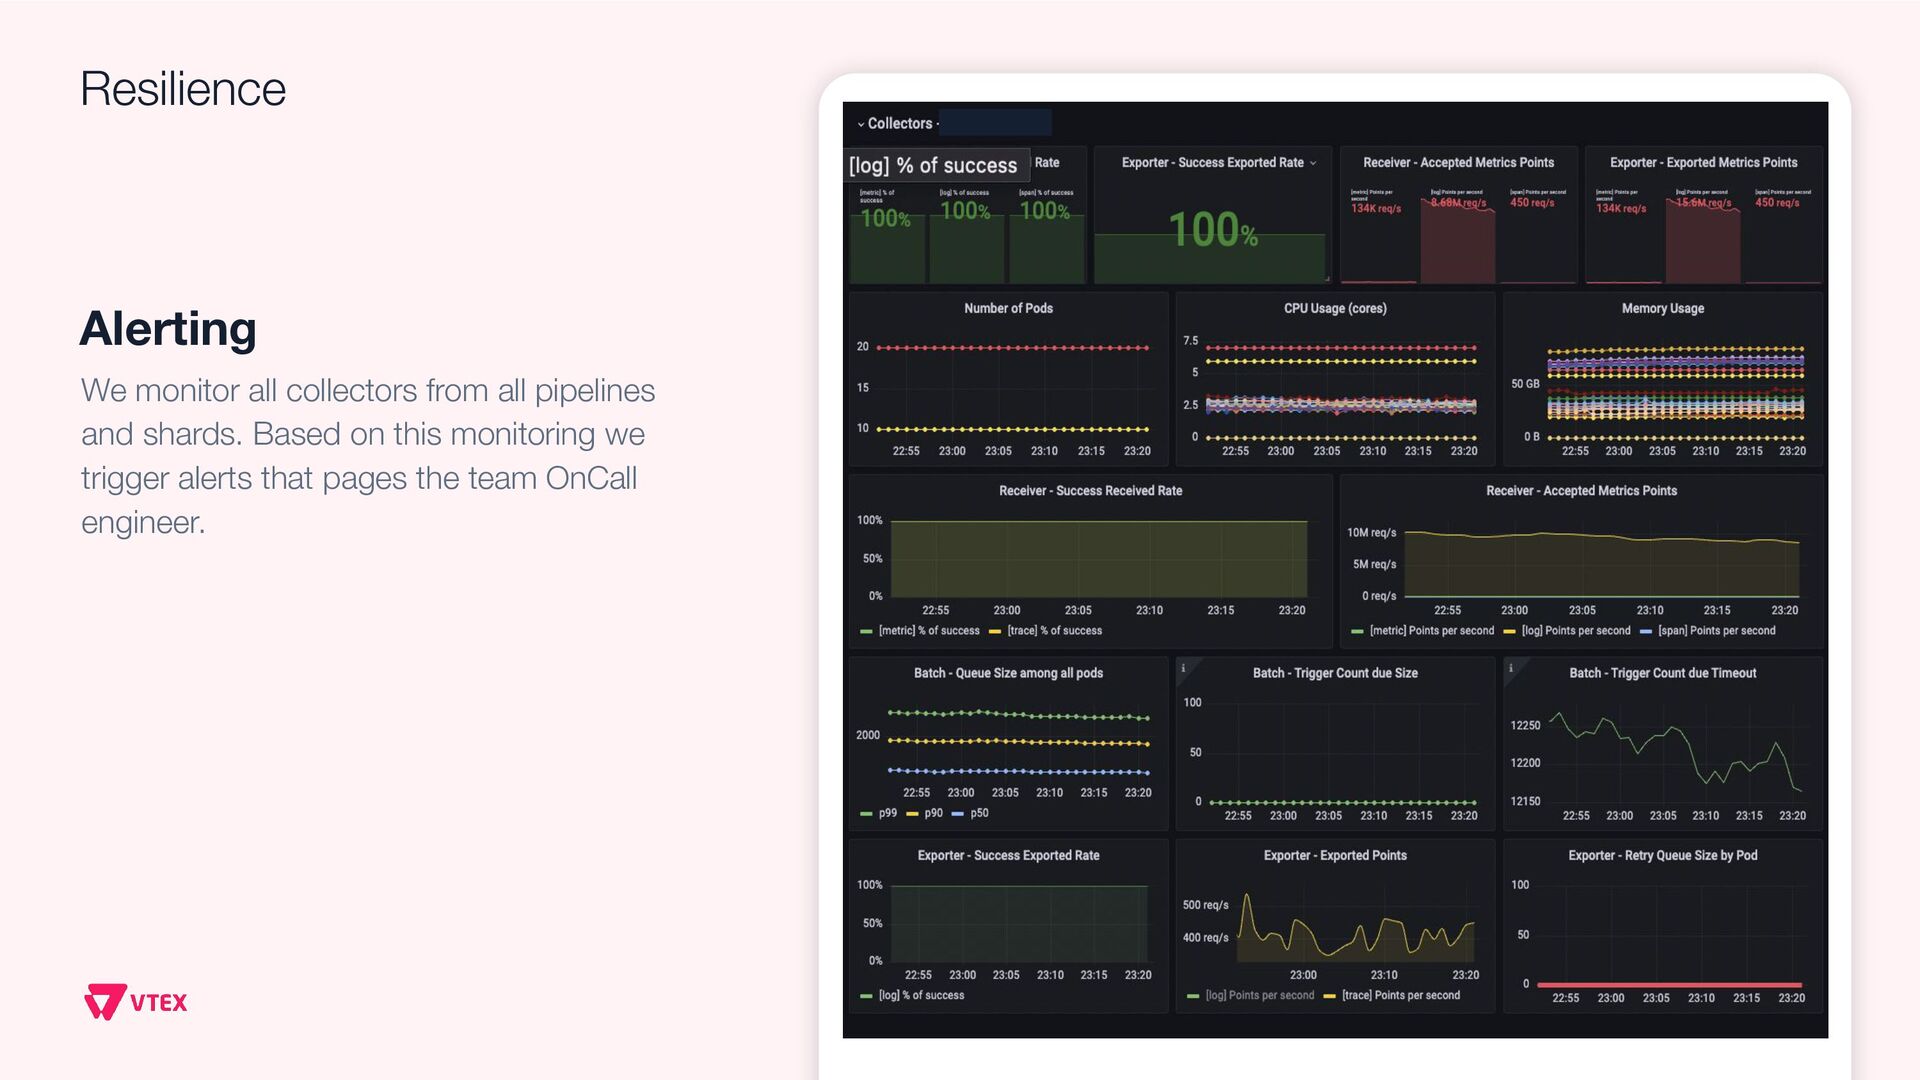
This presentation aims to share how VTEX observability team moved from a single vendor to a full Open Telemetry protocol solution that handles 6.5 terabytes of telemetry data per day (logs, system metrics, business metrics, traces and audit logs). Thinking on the CNCF community, this talk will show the entire architecture, the tradeoffs, how to instrument every application inside the company, how to manage OTEL Collectors at scale, how to centralize visualization, how to extend collectors code and how to guarantee resiliency. Open Telemetry allowed VTEX to completely modernize its Observability stack looking to a horizon of at least 5 years ahead without requiring any sort of migrations on the VTEX's applications. With the architecture this talk presents, VTEX can switch backend vendors without impacting instrumented code. Thus, allow engineering organization to move faster. Last but not least, this solution made VTEX reduce 40% of its Observability costs while enabling a modern, safer and efficient way to engineers to observe their applications at scale. If these topics are interesting to you, please come to this presentation. The idea is to give back to CNCF community what they gave to us: knowledge and cutting edge solutions.

kubecon europe 2023
Tuesday April 18, 2023 11:55 - 12:20 CEST
Hall 7, Room E | Ground Floor | Europe Complex
Observability Day, Project-specific: Observability + Prometheus + OpenMetrics + OpenTelemetry +Fluentbit

Gustavo Pantuza

April 18, 2023
Tweet

More Decks by Gustavo Pantuza

Other Decks in Programming

Transcript

  1. Ingesting 6.5 Tb of Telemetry
    Data Daily Through Open
    Telemetry Protocol and
    Collectors
    Gustavo Pantuza

    View Slide

  2. View Slide

  3. About me
    Personal blog on Computer Science [pt-BR]
    https://blog.pantuza.com
    @gpantuza pantuza

    View Slide

  4. About VTEX platform Problem Solution + Outcomes Architecture
    Agenda
    Resilience

    View Slide

  5. About
    VTEX What kind of system
    are we observing?
    01

    View Slide

  6. Build, manage, and deliver
    profitable ecommerce
    businesses with more agility
    and less risk.
    The Enterprise
    Digital Commerce
    Platform
    VTEX context

    View Slide

  7. VTEX at a
    glance
    3.200+
    Active online stores
    38
    Countries with active customers
    Public-listed
    company

    View Slide

  8. • LONDON

    BARCELONA
    • BUCUREȘTI
    WHERE WE ARE
    Locations across
    the globe
    18
    Global Platform
    • BUENOS AIRES
    SANTIAGO •
    BOGOTÁ •
    • CIUDAD DE MÉXICO
    • NEW YORK
    • JOÃO PESSOA
    • MEDELLÍN
    MILAN •
    • RIO DE JANEIRO
    SÃO PAULO •
    LIMA •
    LISBON •
    • SINGAPORE
    Employees
    1.3 k • RECIFE
    As of Q2/21 ended on June 30th, 2021
    PARIS •

    View Slide

  9. Problem
    Where is the
    problem within this
    context?
    01

    View Slide

  10. Problem

    View Slide

  11. Inefficient ingestion control
    HTTP 1.1 with no encryption
    Unstructured telemetry data
    No common fields by design
    Problem
    Too many library implementations
    Telemetry data governance
    Inefficient way to store KPIs
    Single vendor for different telemetry
    signals

    View Slide

  12. Problem
    How to evolve to a long-term
    o11y stack without vendor lock-in
    while improving o11y efficiency?

    View Slide

  13. Solution +
    Outcomes How did we solve the
    problem and what are
    the outcomes?
    01

    View Slide

  14. Solution + Outcomes

    View Slide

  15. Solution + Outcomes Open Telemetry Protocol on every possible layer
    Common libraries with the same interfaces
    Open Telemetry Collectors as Telemetry Ingestor
    Different data sinks to different telemetry signals
    Sharded architecture by Telemetry signal

    View Slide

  16. 41%
    reduction on Observability
    investments
    Long Term
    Architecture that does not require
    developers to migrate their applications in
    case we change o11y vendors
    6.5 Tb
    of telemetry data getting ingested
    per day and with control knobs
    such as dynamic sampling
    Solution + Outcomes

    View Slide

  17. Architecture
    What is the
    project design?
    01

    View Slide

  18. Architecture
    Resiliency control
    Asynchronous requests
    Head based sampling
    Shared library (Diagnostics)
    Facilitates the migration

    View Slide

  19. Architecture
    gRPC communication
    Encryption
    Common methods interface
    Shared library (Diagnostics)
    /**
    * VTEX's Telemetry methods
    */
    service Telemetry {
    /* Logs related methods */
    rpc Info(LogRequest) returns (google.protobuf.Empty);
    rpc Warn(LogRequest) returns (google.protobuf.Empty);
    rpc Error(LogRequest) returns (google.protobuf.Empty);
    rpc Debug(LogRequest) returns (google.protobuf.Empty);
    /* Metrics related methods */
    rpc SystemMetric(Metric) returns (google.protobuf.Empty);
    rpc BusinessMetric(Metric) returns (google.protobuf.Empty);
    /* Traces related methods */
    rpc Trace(Trace) returns (google.protobuf.Empty);
    }

    View Slide

  20. Architecture
    Structured logs by design
    Common fields
    Shared library (Diagnostics)
    /**
    * Common Fields on telemetry data
    */
    message Common {
    ...
    /* Name of the service that is sending telemetry data */
    string service_name = 1;
    /* Instance hostname */
    string instance_id = 2;
    /* Instance Availability zone */
    string az = 3;
    /* Instance region */
    string region = 4;
    /* Optional hash table allowing users to send extra fields */
    map extra_fields = 5;
    ...
    }
    Instrumented with Open
    Telemetry official libraries

    View Slide

  21. Architecture
    Single telemetry signal architecture

    View Slide

  22. Architecture
    Extended with our modules
    Built internally
    Different configurations per
    telemetry signal
    Custom Collectors
    Open Telemetry Collectors Builder (ocb)

    View Slide

  23. dist:
    name: otelcol
    description: OpenTelemetry Collector
    version: 0.xx.y
    otelcol_version: 0.xx.y
    receivers:
    - ...
    exporters:
    - ...
    extensions:
    - ...
    processors:
    - ...
    Architecture
    Extended with our modules
    Built internally
    Different configurations per
    telemetry signal
    Custom Collectors
    builder.yaml

    View Slide

  24. Architecture
    Telemetry data flow

    View Slide

  25. Architecture
    Reusable dashboards
    Central place for dashboards
    Specialized visualizations on
    each data sink
    Data visualization
    Teams governance

    View Slide

  26. Architecture

    View Slide

  27. 4 Terabytes
    of logs per day
    150 millions
    Active time series
    2.15 Billions
    of events ingested per day
    Architecture

    View Slide

  28. Resilience
    How do we keep this
    system up and
    running?
    01

    View Slide

  29. “Fail locally,
    not globally”
    Resilience

    View Slide

  30. Resilience

    View Slide

  31. Horizontal Pod auto-scaling
    Burst requests on a single deployment
    can increase significantly collectors
    load
    autoscaling:
    enabled: true
    minReplicas: 10
    maxReplicas: 20
    targetMemoryUtilizationPercentage: 90
    targetCPUUtilizationPercentage: 60
    One Example of single Deployment
    Resilience

    View Slide

  32. Sharding strategy
    Sharded
    environments by
    business criteria such
    as core systems vs
    internal services
    Shard 0 Shard 1 Shard 2 Shard 3
    Logs
    Metrics
    Traces
    Resilience

    View Slide

  33. settings:
    default_sampling_percentage: 25
    skip_sampling_field: debug
    services_config:
    sampling:
    - name: service_0
    index: service_0
    percentage: 75
    - name: service_1
    index: service_1
    percentage: 0
    Default sampling
    Sampling % per service
    Skip sampling
    Real time Sampling
    (tail based sampling)
    Resilience
    Custom Open Telemetry Collector Processor

    View Slide

  34. wal:
    s3_region: some-aws-region
    s3_bucket: "wal-bucket-name"
    flush:
    bytes: 10000000
    interval: 120
    cluster: shard0
    Data Backfill
    one week data expiration
    AWS S3 + Lambda functions
    Write Ahead Log (WAL)
    Resilience
    Custom Open Search exporter

    View Slide

  35. We monitor all collectors from all pipelines
    and shards. Based on this monitoring we
    trigger alerts that pages the team OnCall
    engineer.
    Resilience
    Alerting

    View Slide

  36. Migration tips RFC like process to engage engineering teams
    C levels buy-in on the project
    Understand your client (speak to your teams)
    Engage your vendors on the resiliency plan
    Find early adopters. One step at a time

    View Slide

  37. VTEX Context
    We saw the multi-tenant
    architecture
    Problem
    We understood the
    problem of using a
    single vendor for
    different telemetry data
    Solution + Outcomes
    Before jumping on details
    we saw the overall
    approach and direct
    outcomes
    Architecture
    Then we jumped into
    details of the long term
    architecture and system
    design
    Recap
    Resilience
    Finally we discussed
    strategies to avoid global
    outages and how to
    monitor the entire
    architecture

    View Slide

  38. Open Telemetry
    ecosystem enabled
    VTEX to innovate fast
    and efficiently

    View Slide

  39. Personal blog on Computer Science [pt-BR]
    https://blog.pantuza.com
    @gpantuza pantuza

    View Slide