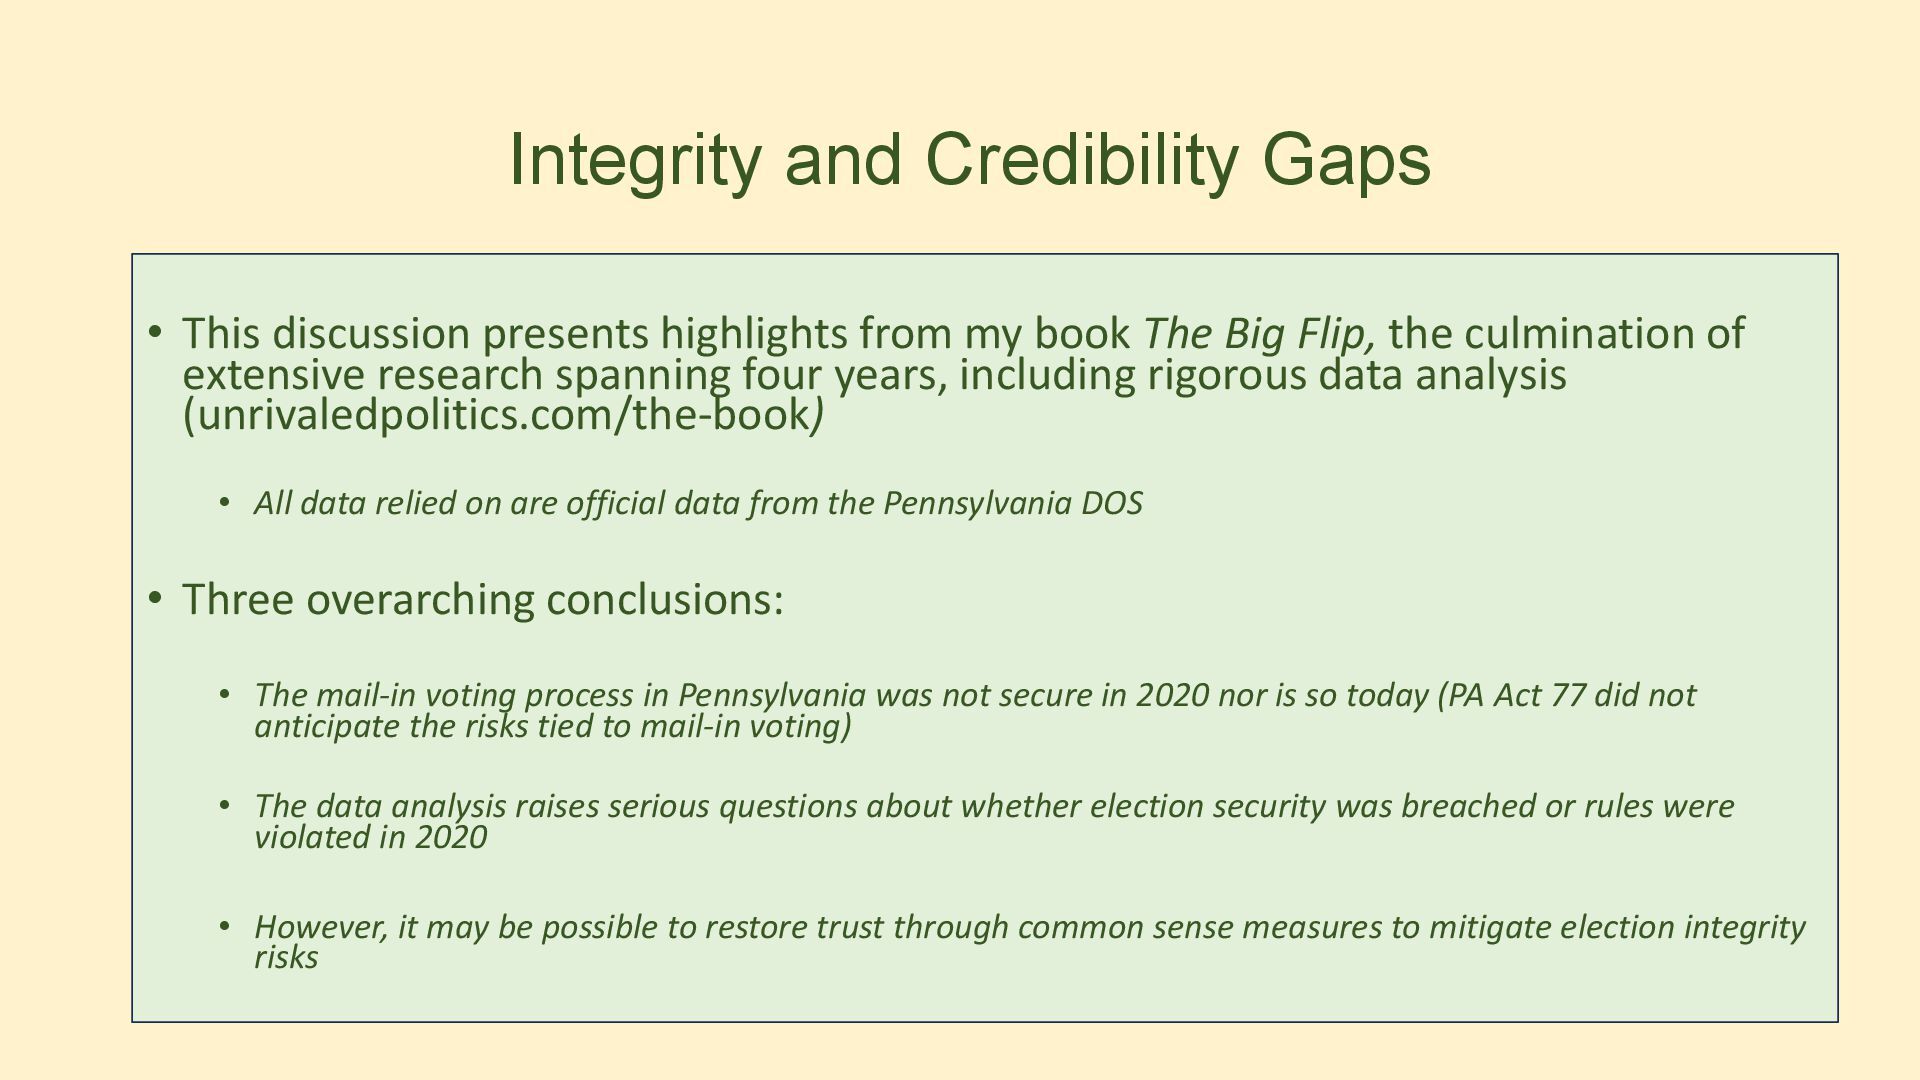
my book The Big Flip, the culmination of extensive research spanning four years, including rigorous data analysis (unrivaledpolitics.com/the-book) • All data relied on are official data from the Pennsylvania DOS • Three overarching conclusions: • The mail-in voting process in Pennsylvania was not secure in 2020 nor is so today (PA Act 77 did not anticipate the risks tied to mail-in voting) • The data analysis raises serious questions about whether election security was breached or rules were violated in 2020 • However, it may be possible to restore trust through common sense measures to mitigate election integrity risks
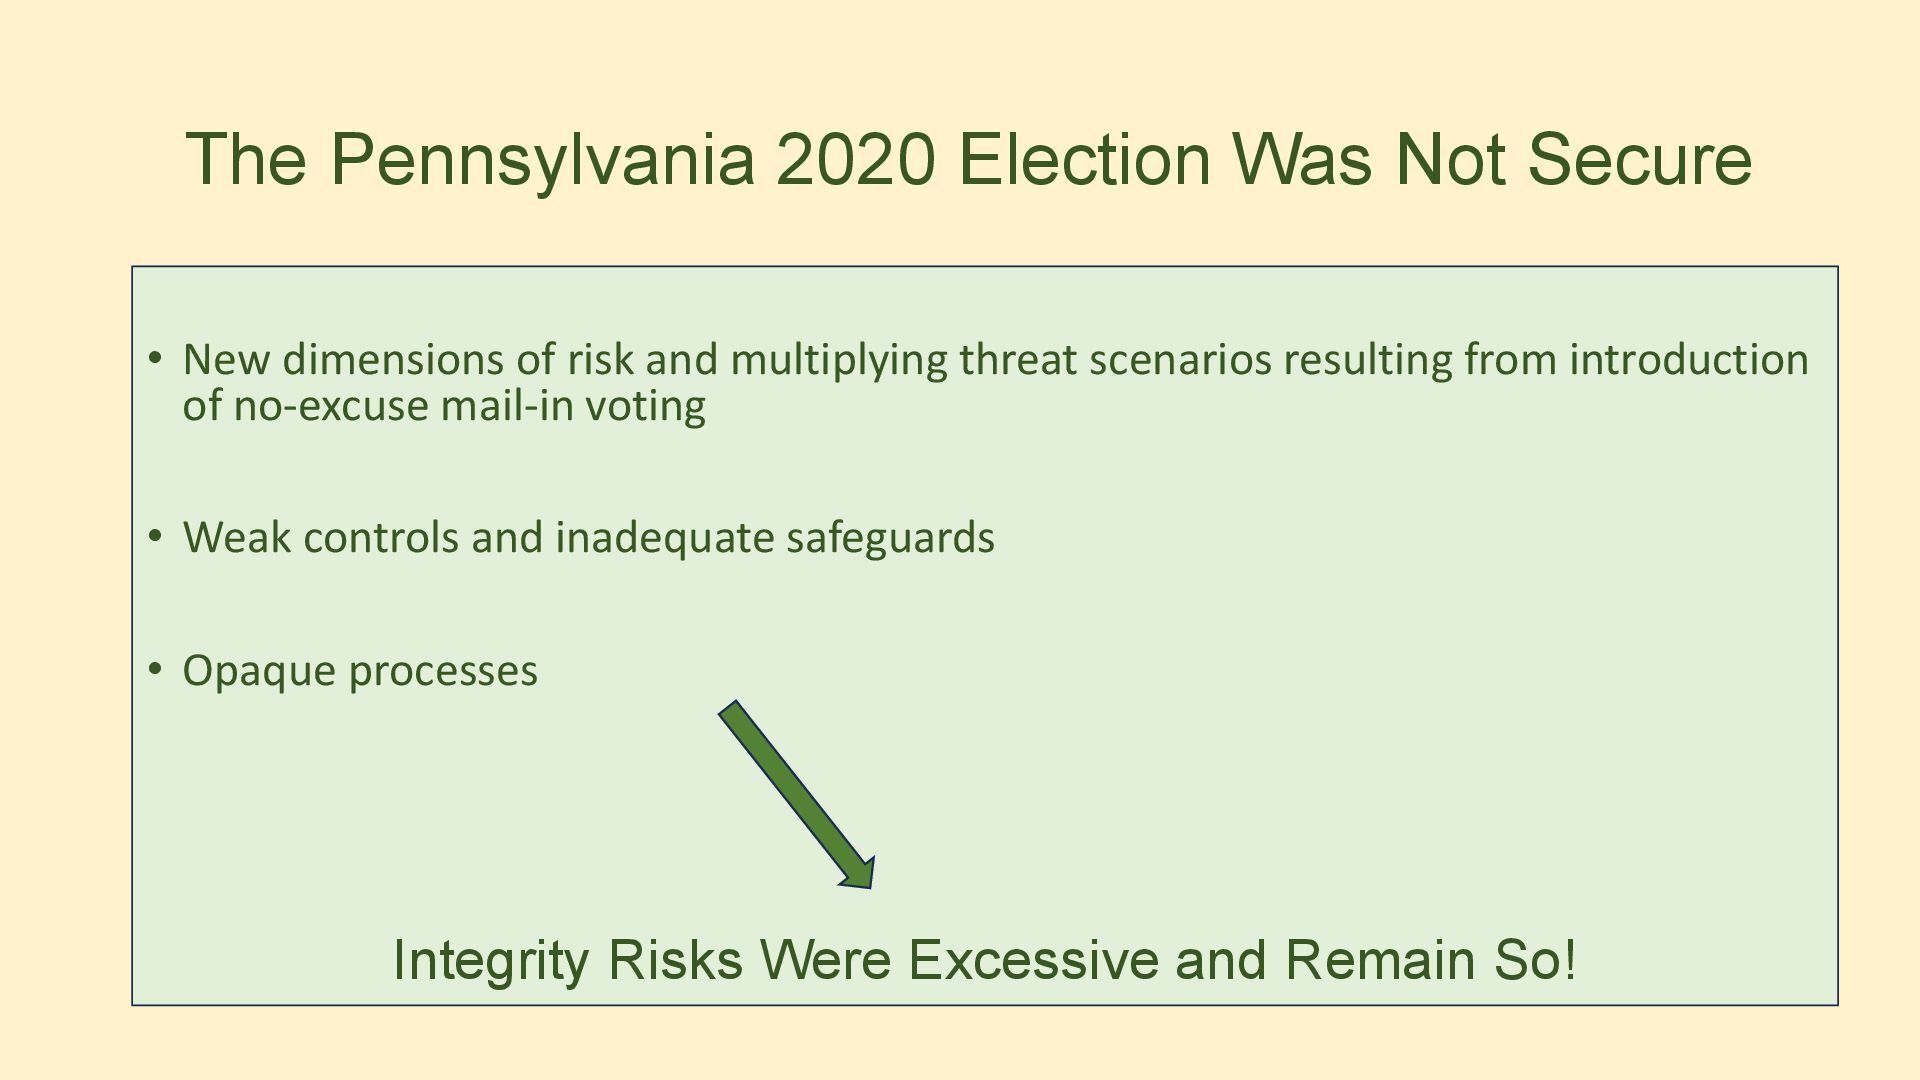
of risk and multiplying threat scenarios resulting from introduction of no-excuse mail-in voting • Weak controls and inadequate safeguards • Opaque processes Integrity Risks Were Excessive and Remain So!
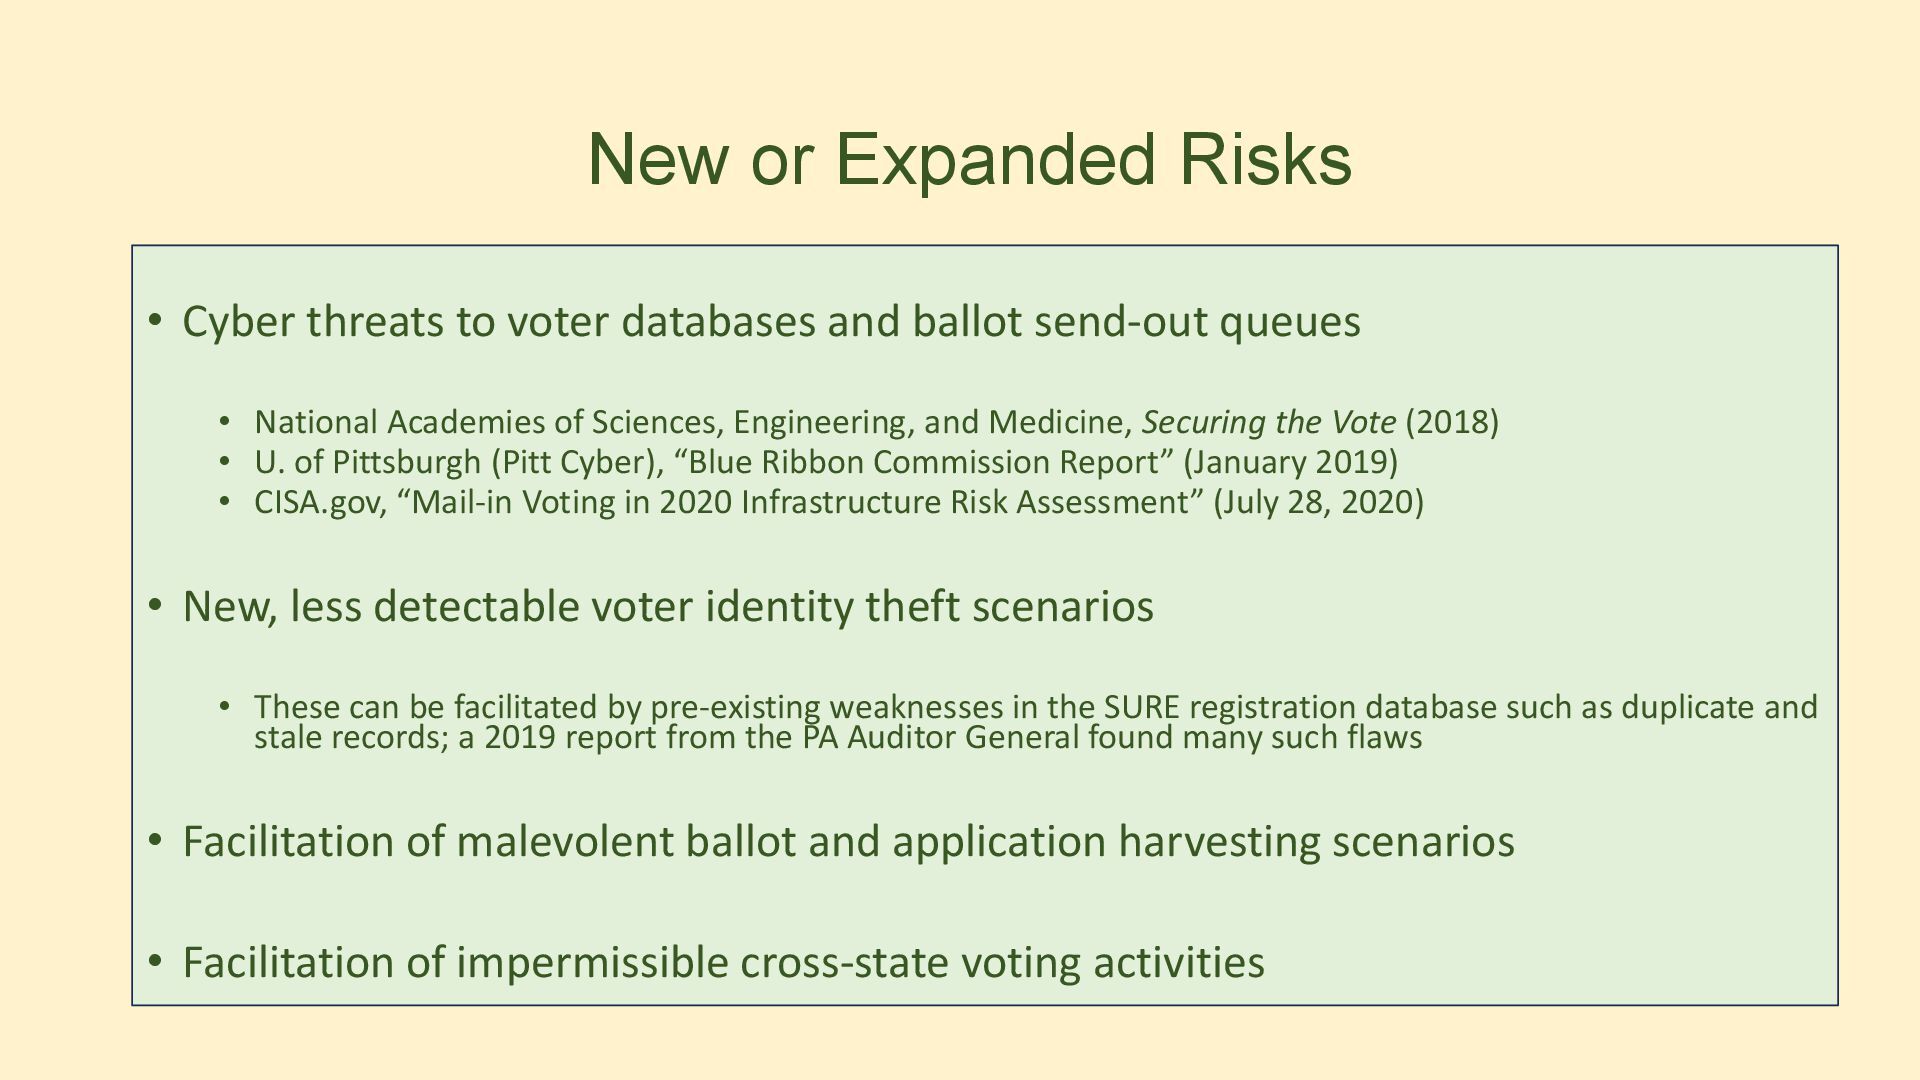
and ballot send-out queues • National Academies of Sciences, Engineering, and Medicine, Securing the Vote (2018) • U. of Pittsburgh (Pitt Cyber), “Blue Ribbon Commission Report” (January 2019) • CISA.gov, “Mail-in Voting in 2020 Infrastructure Risk Assessment” (July 28, 2020) • New, less detectable voter identity theft scenarios • These can be facilitated by pre-existing weaknesses in the SURE registration database such as duplicate and stale records; a 2019 report from the PA Auditor General found many such flaws • Facilitation of malevolent ballot and application harvesting scenarios • Facilitation of impermissible cross-state voting activities
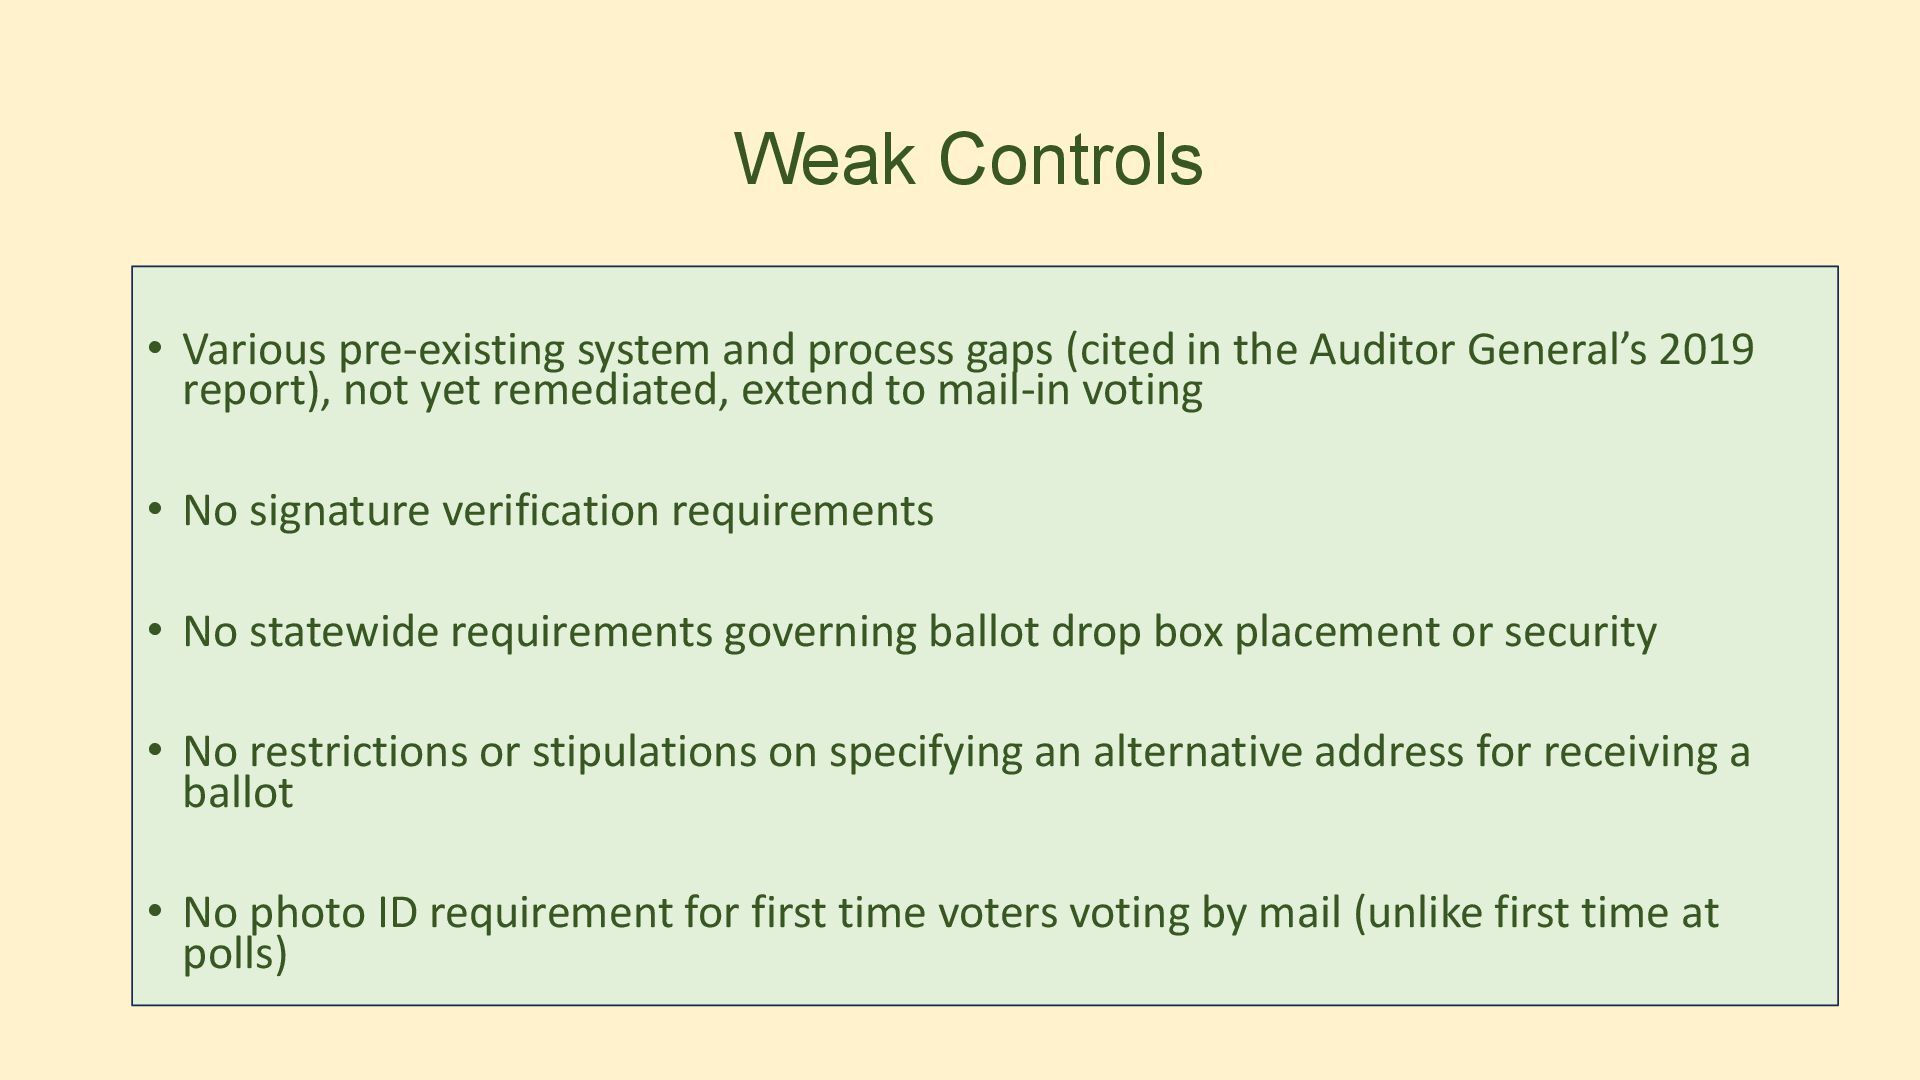
in the Auditor General’s 2019 report), not yet remediated, extend to mail-in voting • No signature verification requirements • No statewide requirements governing ballot drop box placement or security • No restrictions or stipulations on specifying an alternative address for receiving a ballot • No photo ID requirement for first time voters voting by mail (unlike first time at polls)
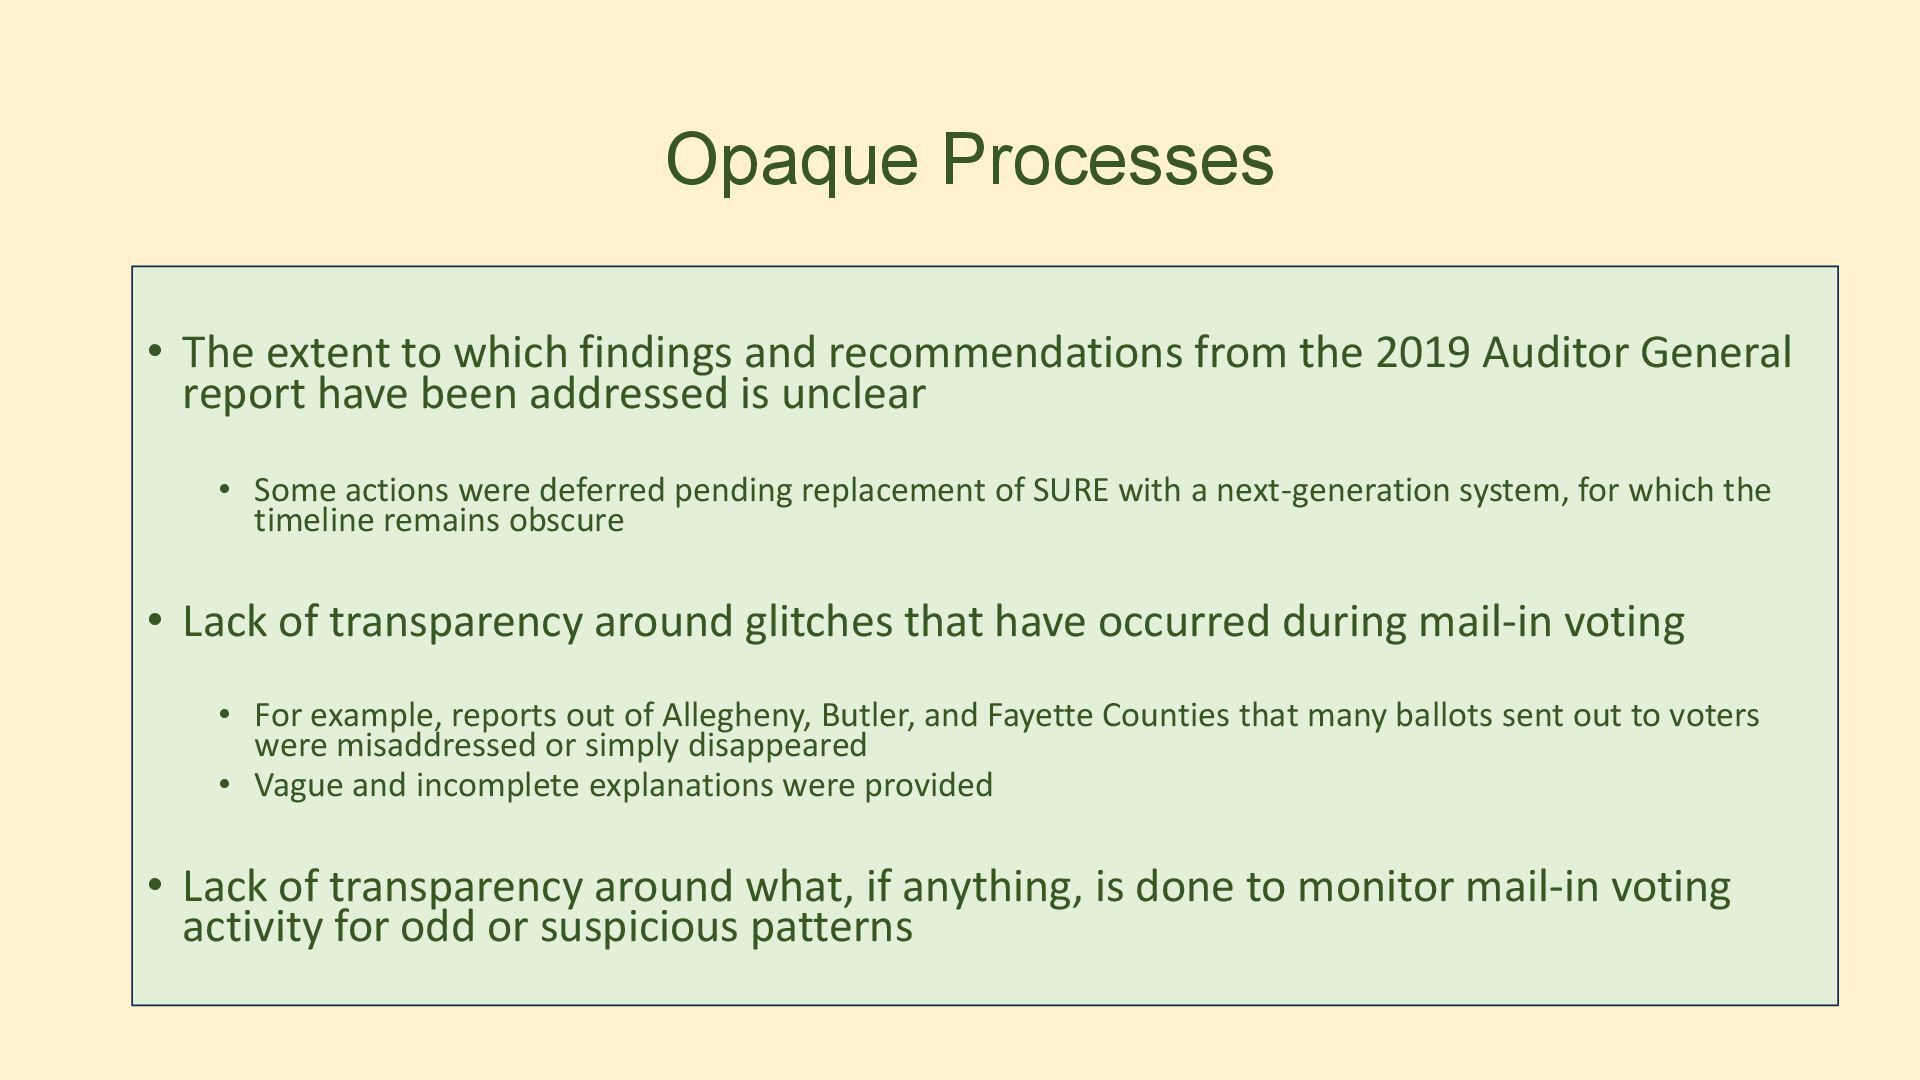
from the 2019 Auditor General report have been addressed is unclear • Some actions were deferred pending replacement of SURE with a next-generation system, for which the timeline remains obscure • Lack of transparency around glitches that have occurred during mail-in voting • For example, reports out of Allegheny, Butler, and Fayette Counties that many ballots sent out to voters were misaddressed or simply disappeared • Vague and incomplete explanations were provided • Lack of transparency around what, if anything, is done to monitor mail-in voting activity for odd or suspicious patterns
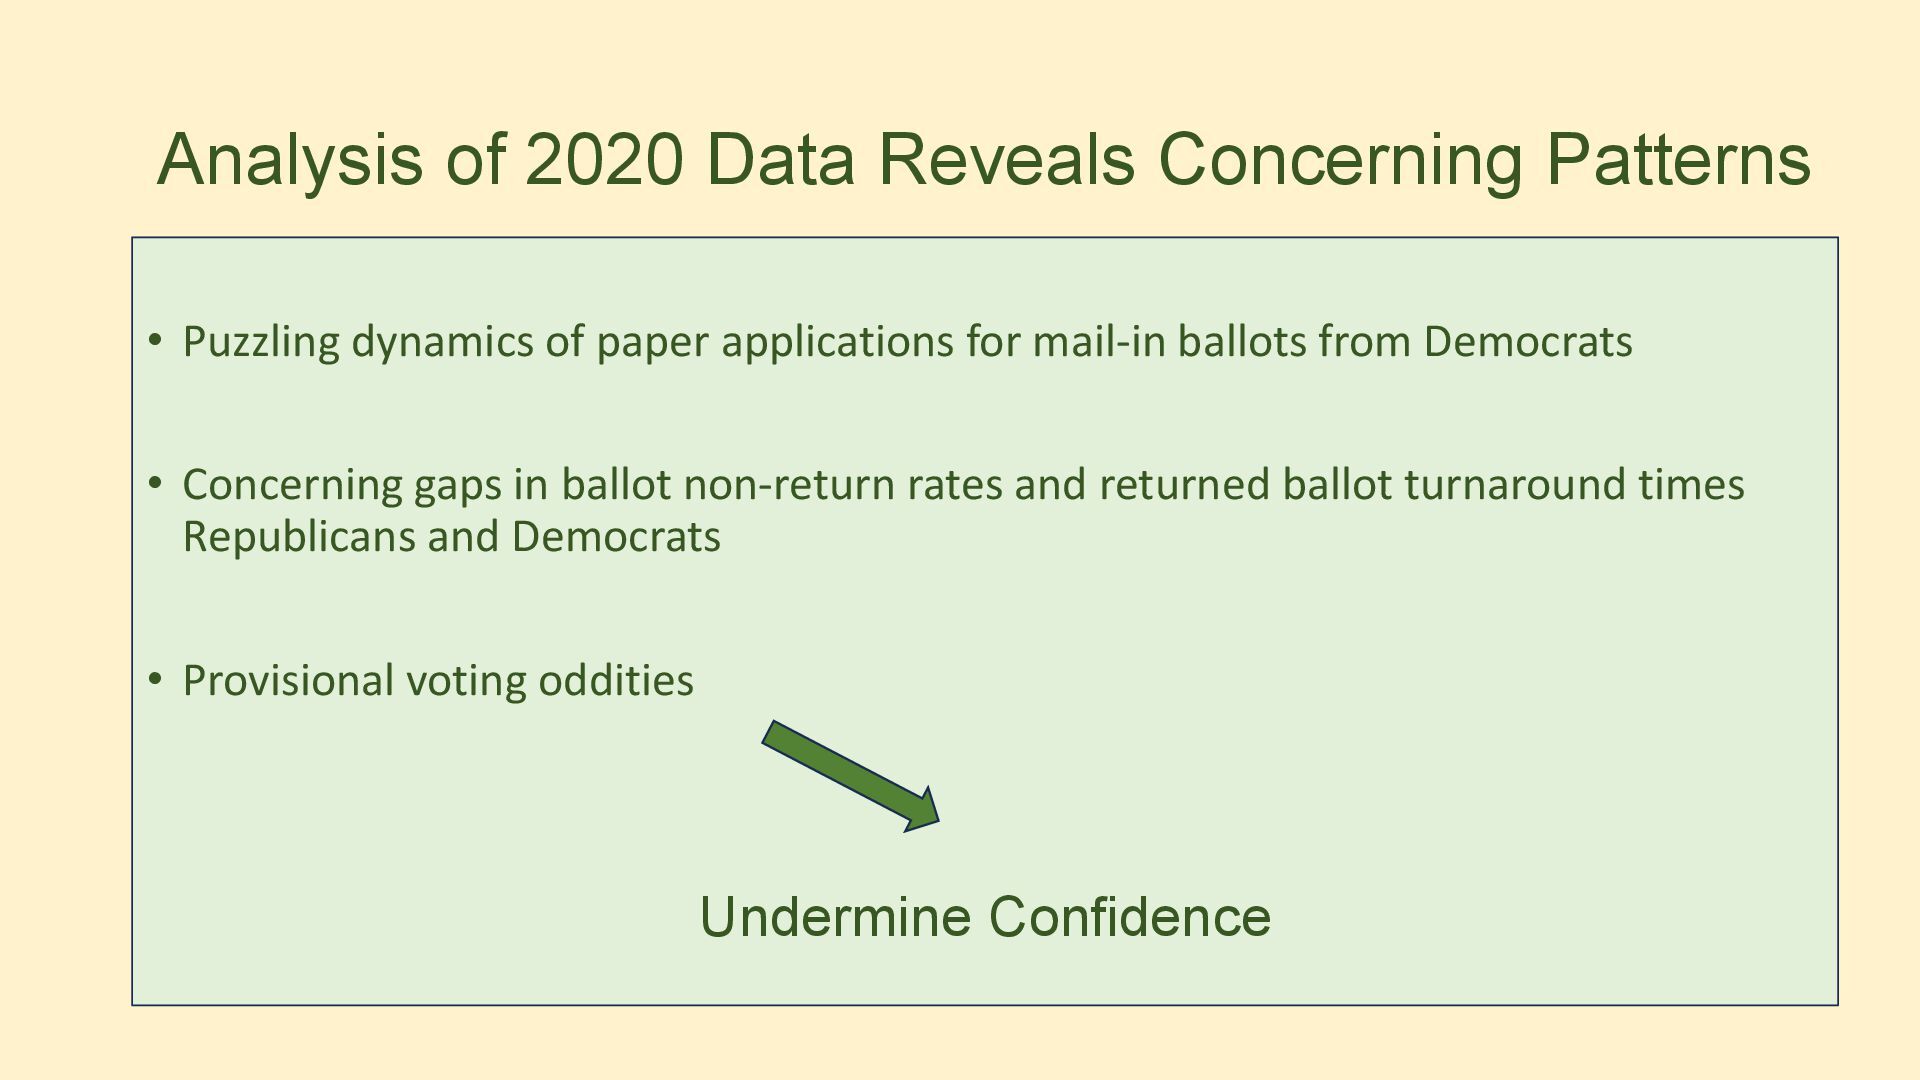
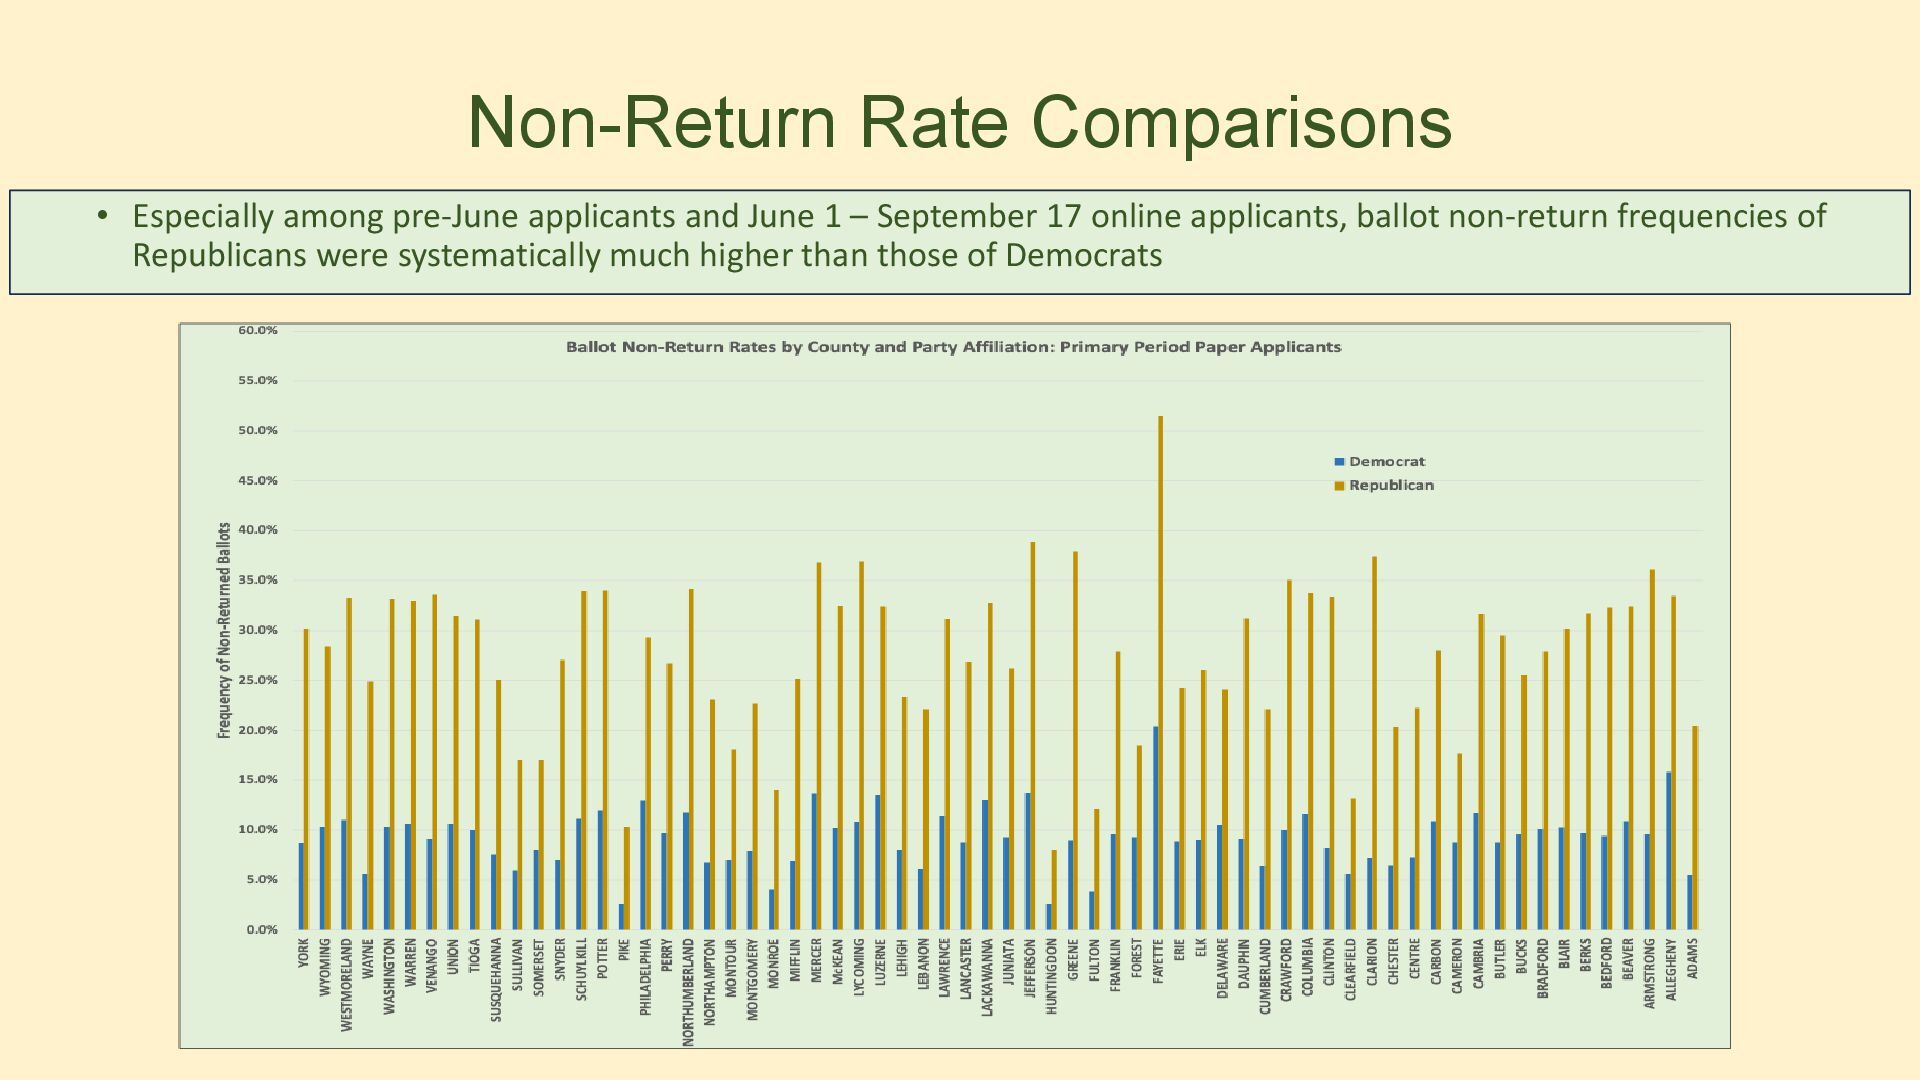
of paper applications for mail-in ballots from Democrats • Concerning gaps in ballot non-return rates and returned ballot turnaround times Republicans and Democrats • Provisional voting oddities Undermine Confidence
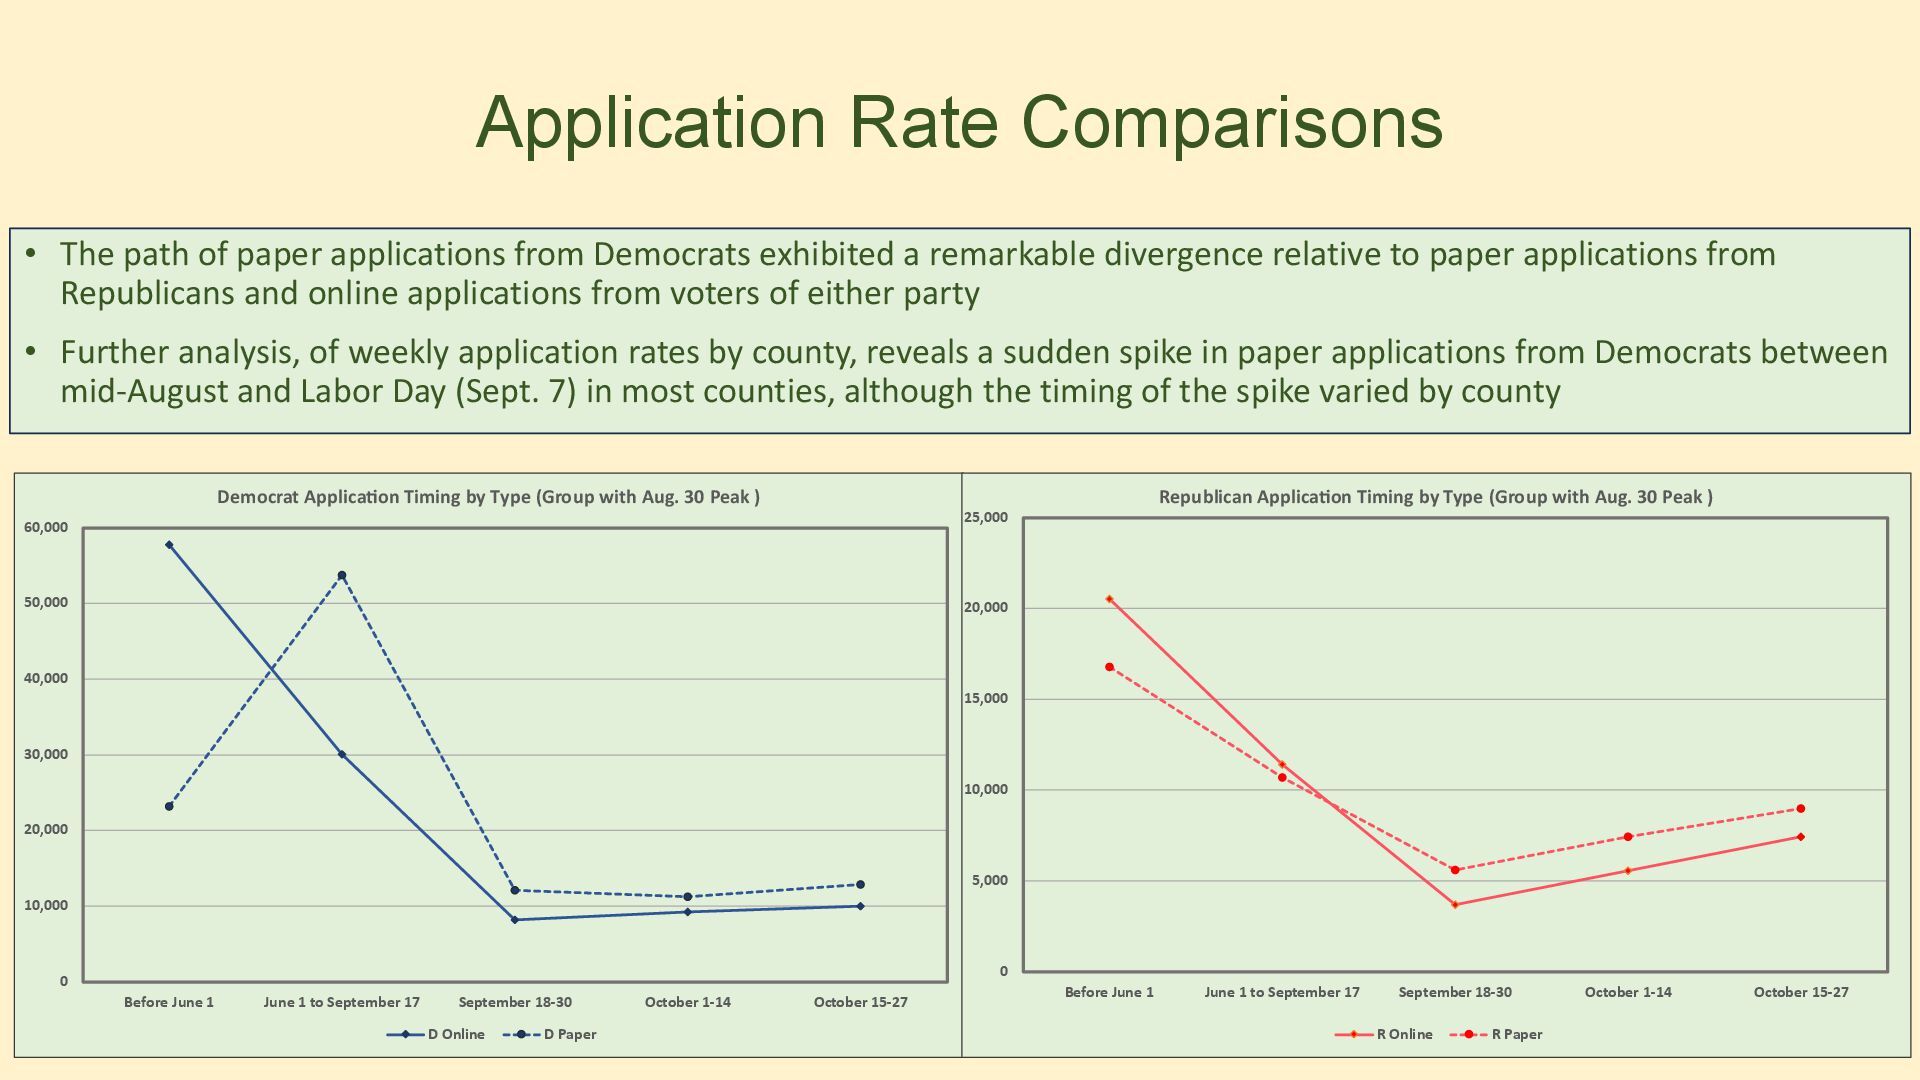
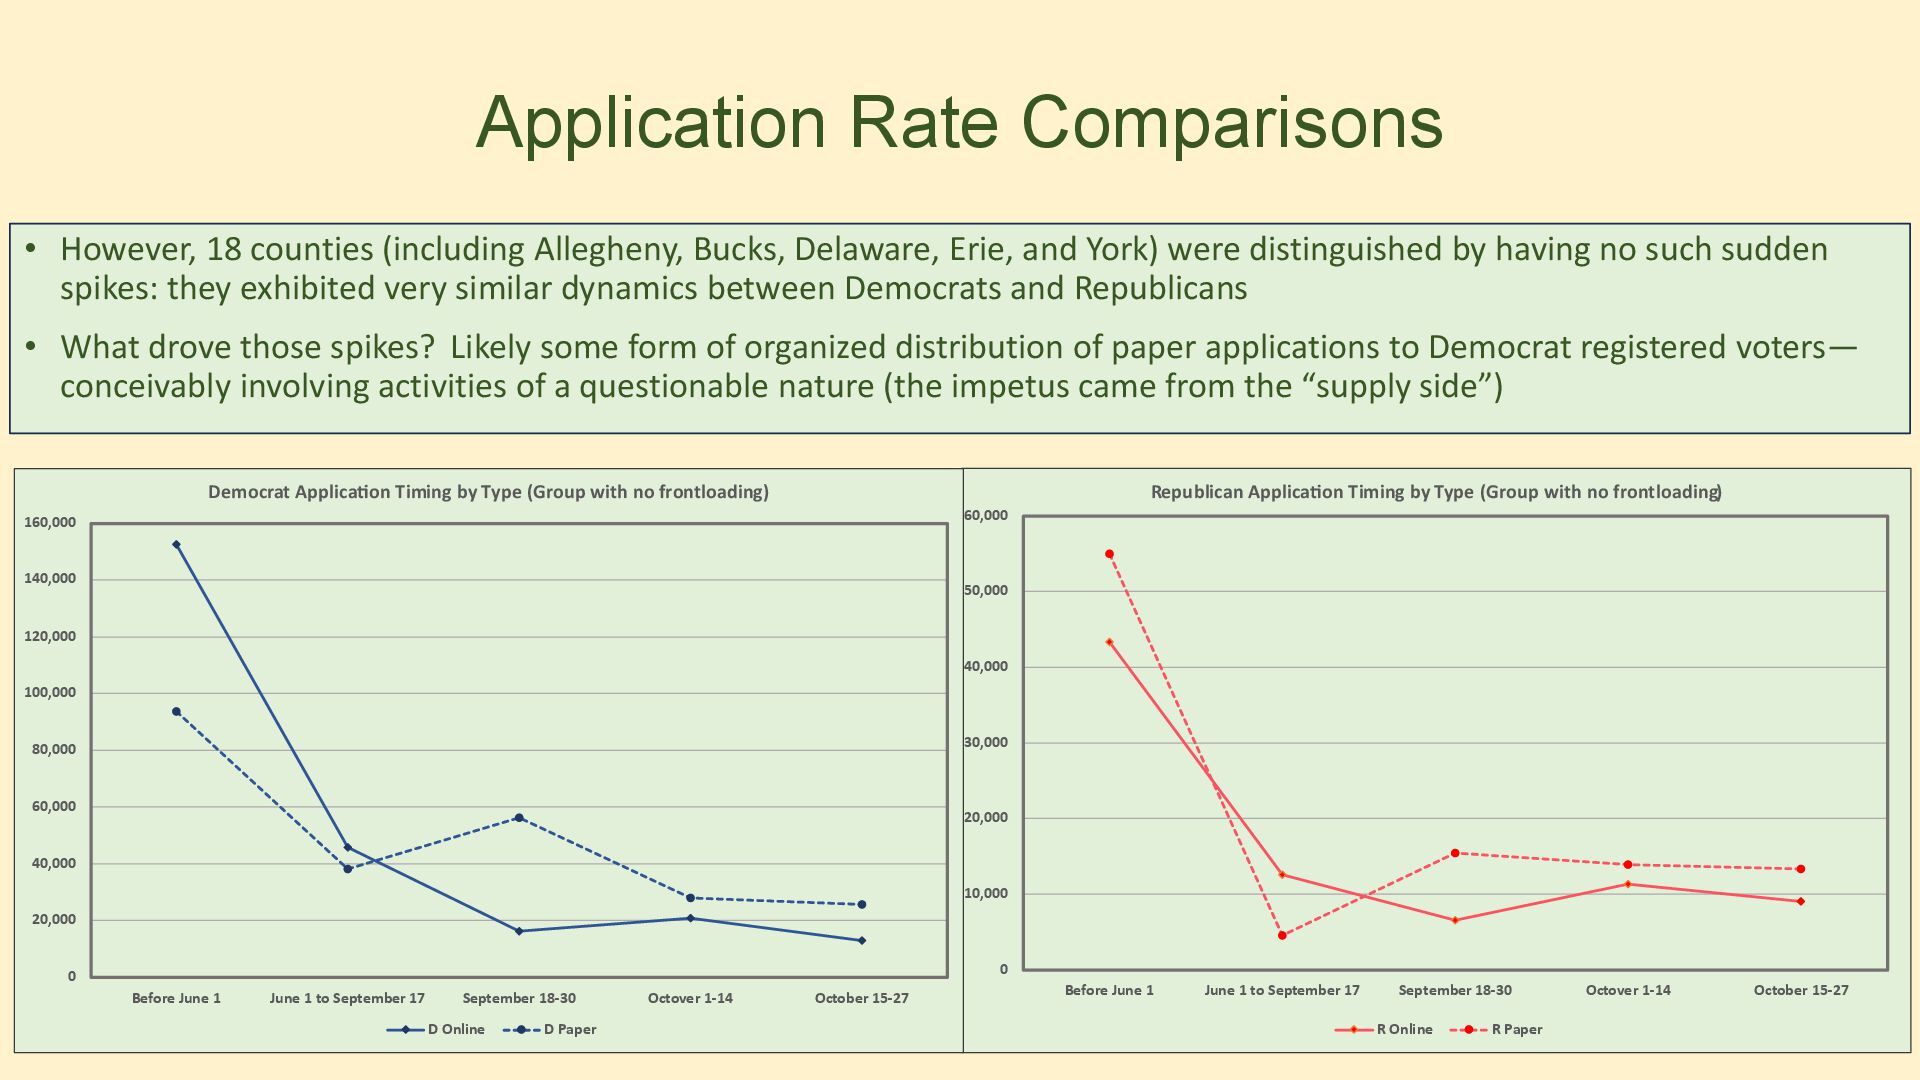
Democrats exhibited a remarkable divergence relative to paper applications from Republicans and online applications from voters of either party • Further analysis, of weekly application rates by county, reveals a sudden spike in paper applications from Democrats between mid-August and Labor Day (Sept. 7) in most counties, although the timing of the spike varied by county
Delaware, Erie, and York) were distinguished by having no such sudden spikes: they exhibited very similar dynamics between Democrats and Republicans • What drove those spikes? Likely some form of organized distribution of paper applications to Democrat registered voters— conceivably involving activities of a questionable nature (the impetus came from the “supply side”)
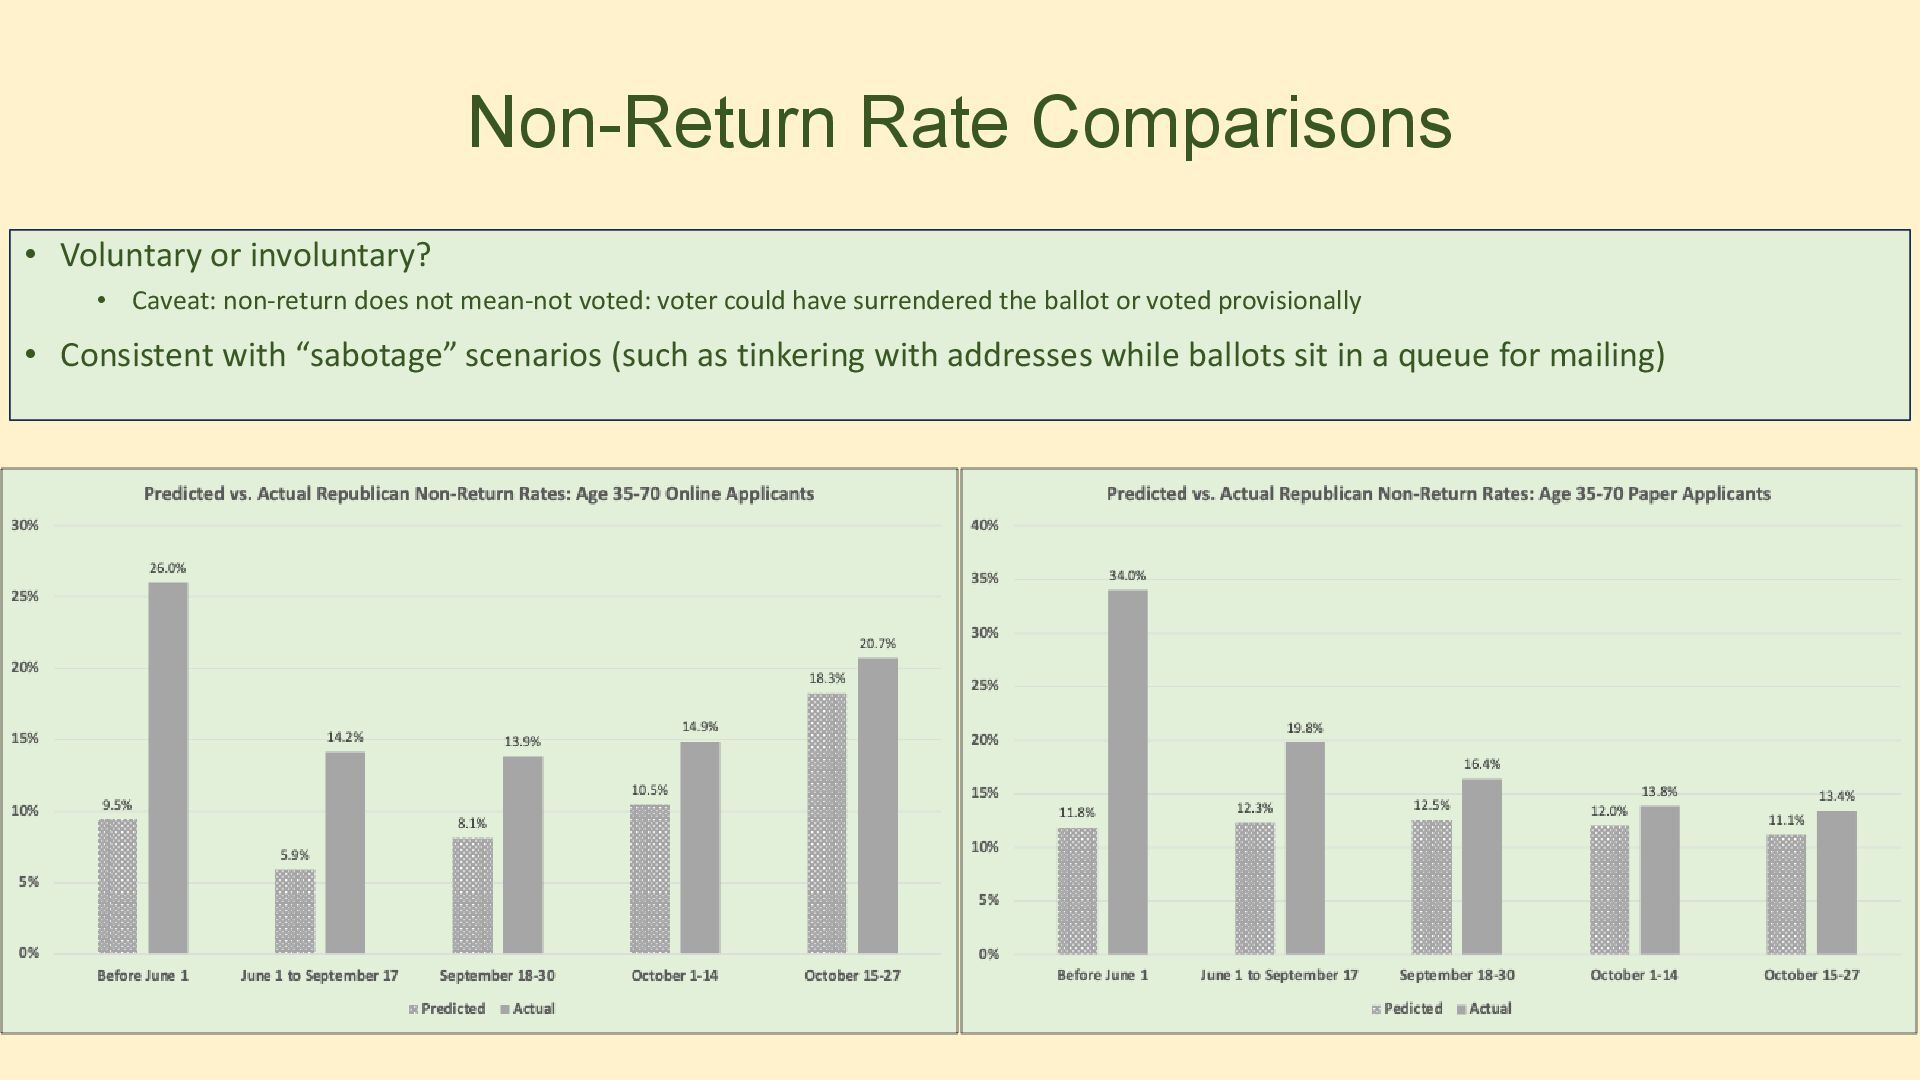
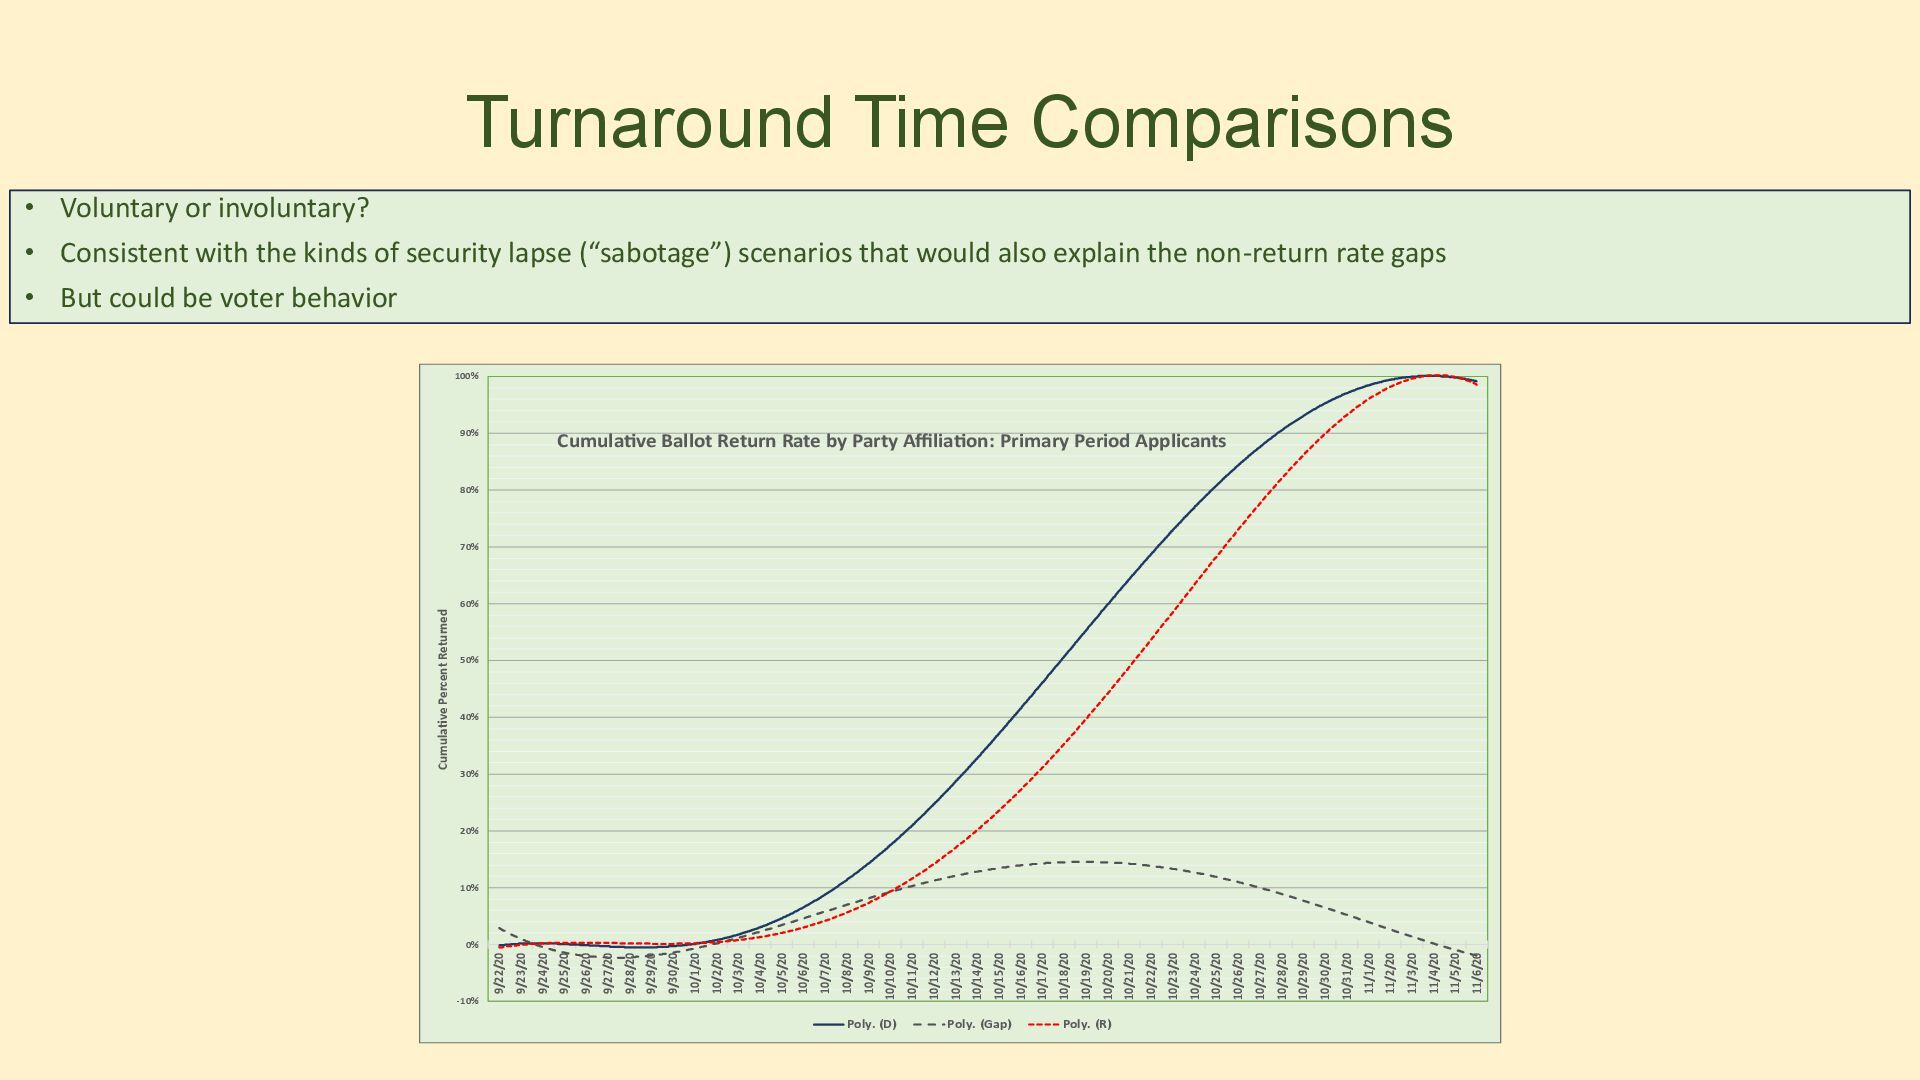
does not mean-not voted: voter could have surrendered the ballot or voted provisionally • Consistent with “sabotage” scenarios (such as tinkering with addresses while ballots sit in a queue for mailing)
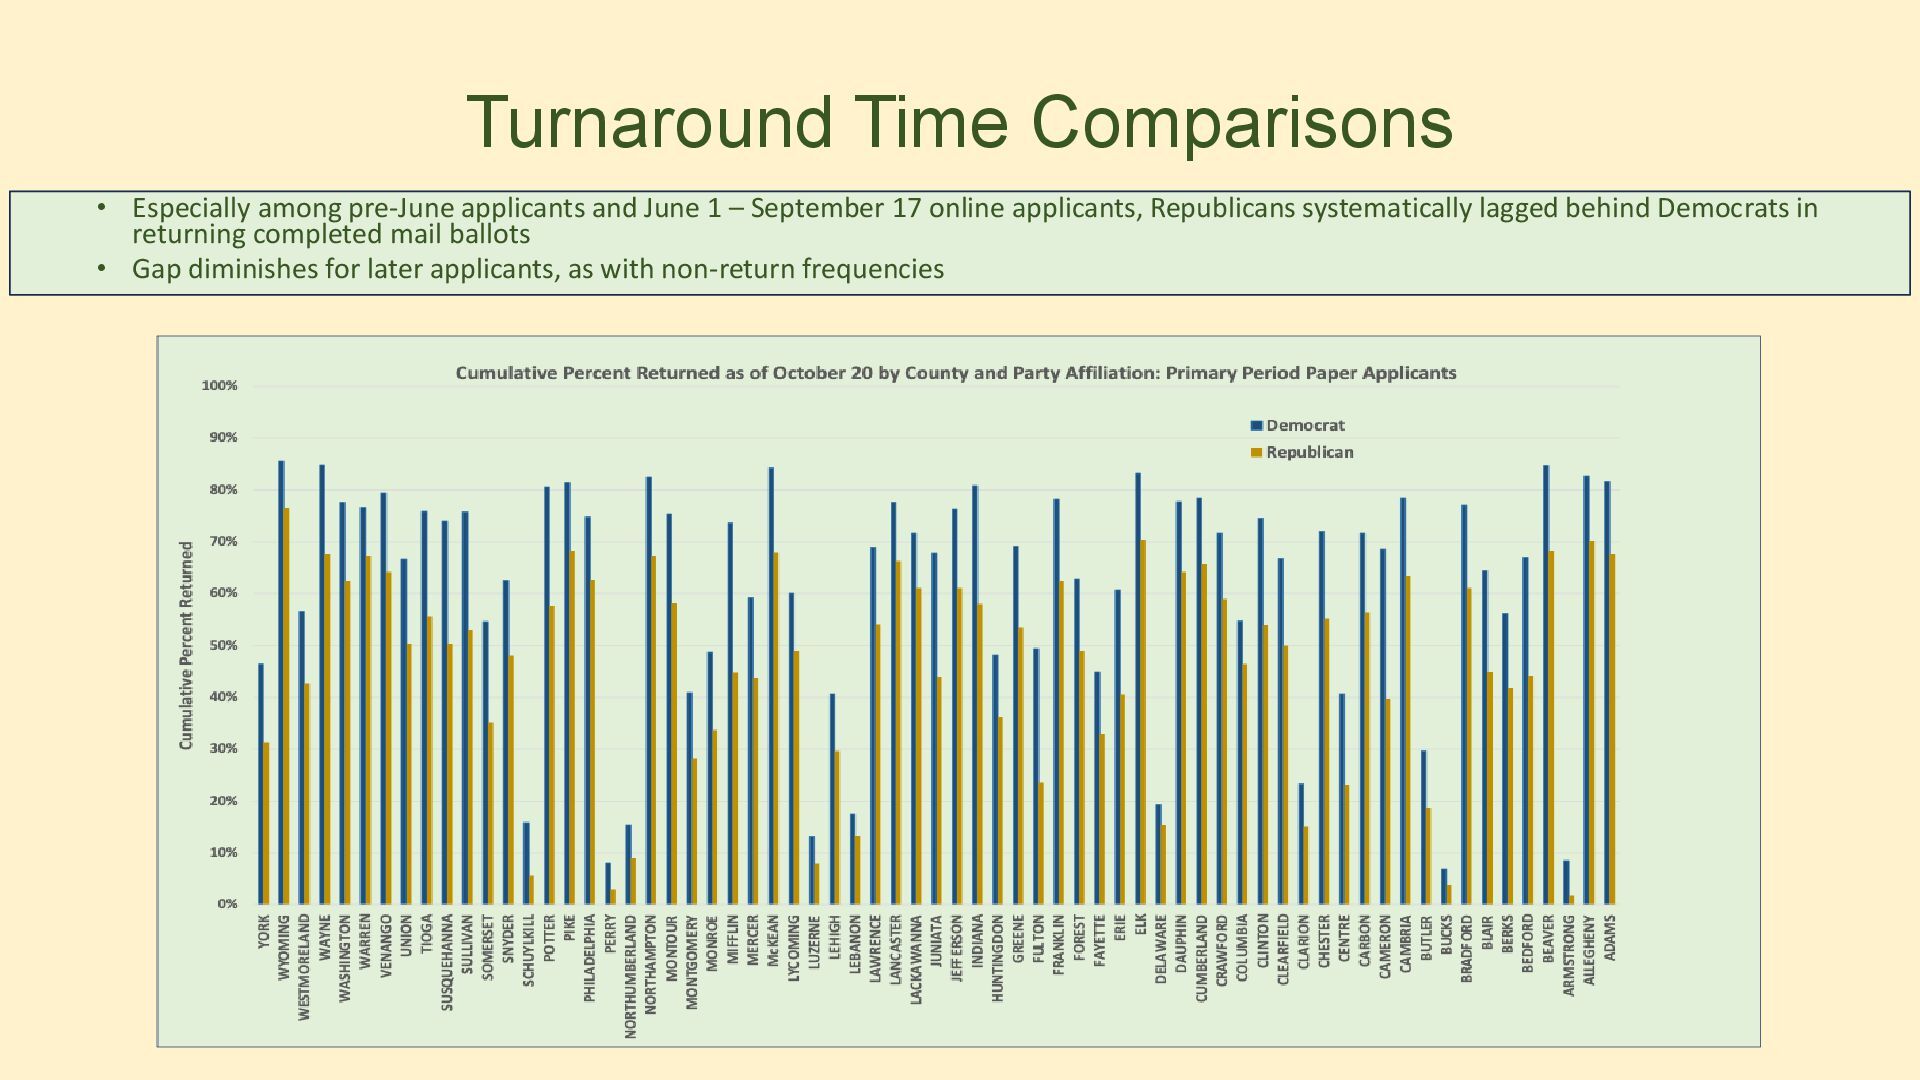
1 – September 17 online applicants, Republicans systematically lagged behind Democrats in returning completed mail ballots • Gap diminishes for later applicants, as with non-return frequencies
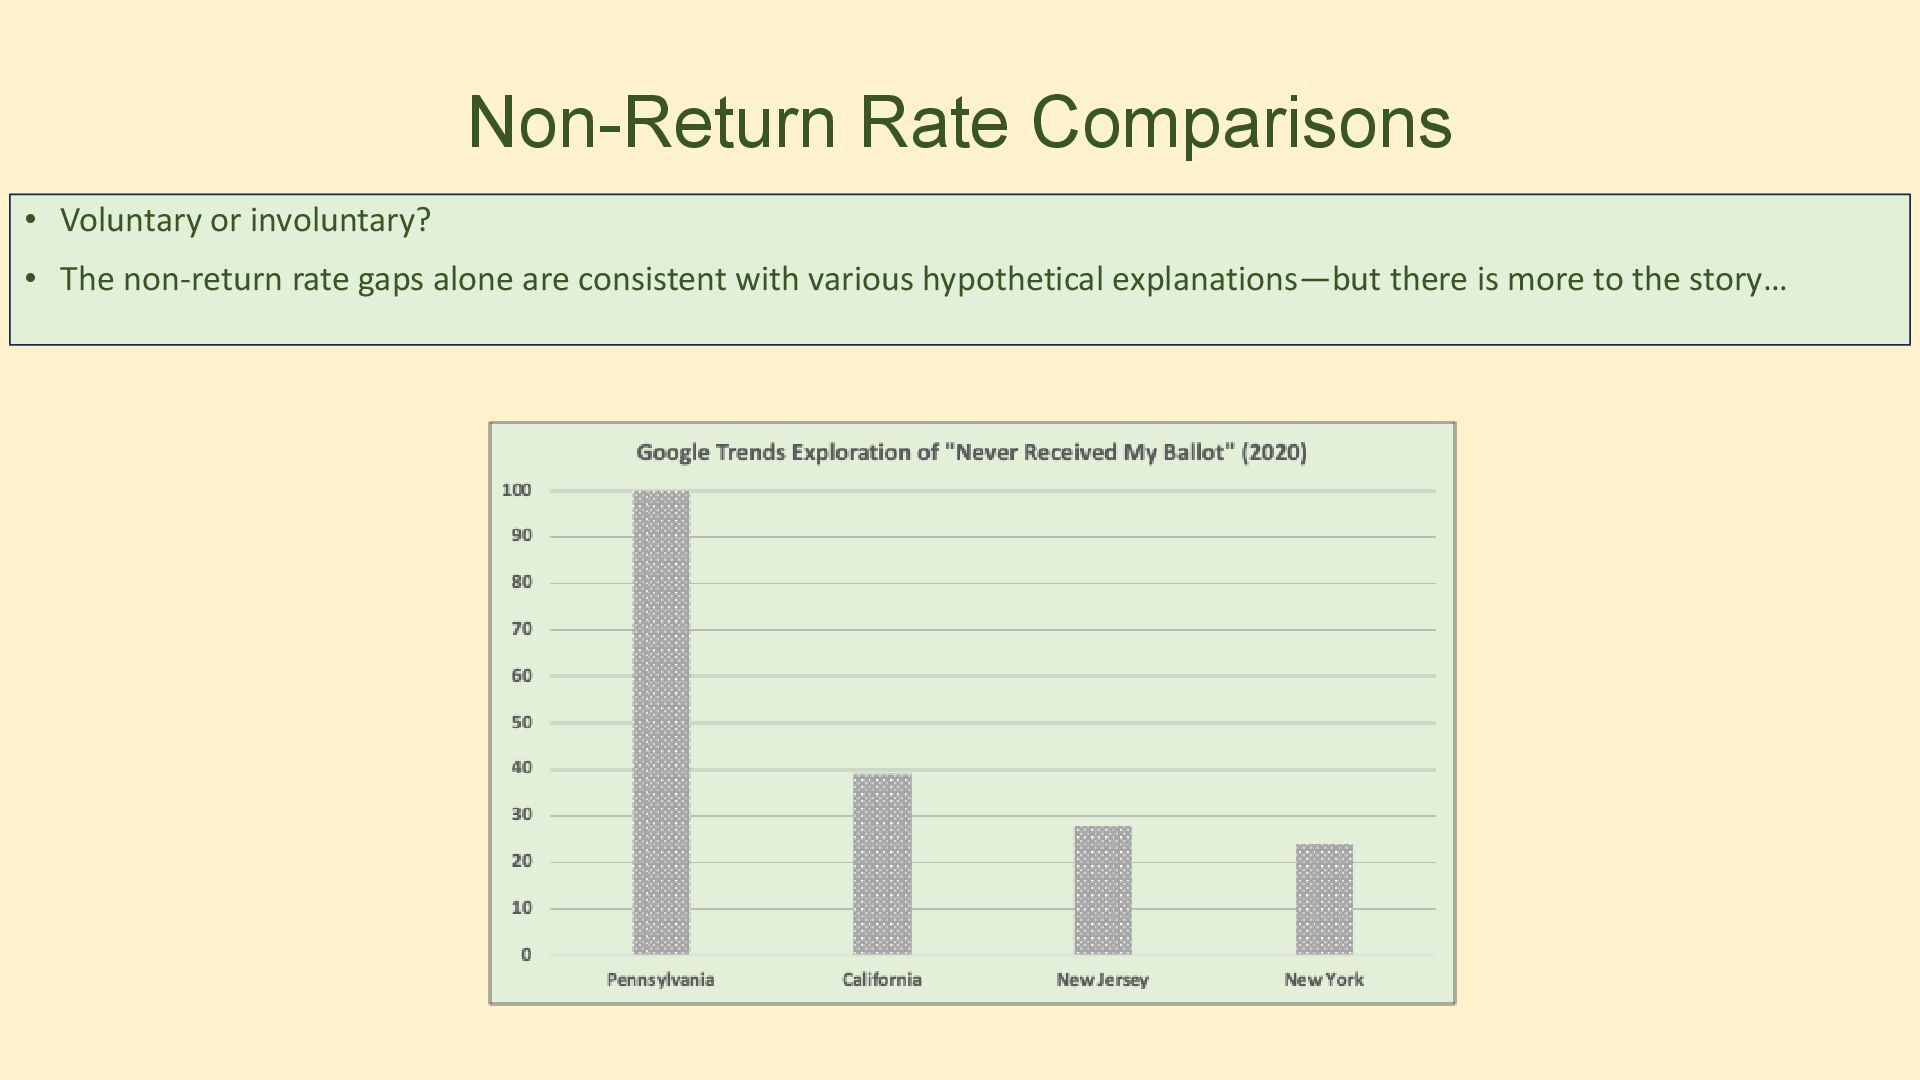
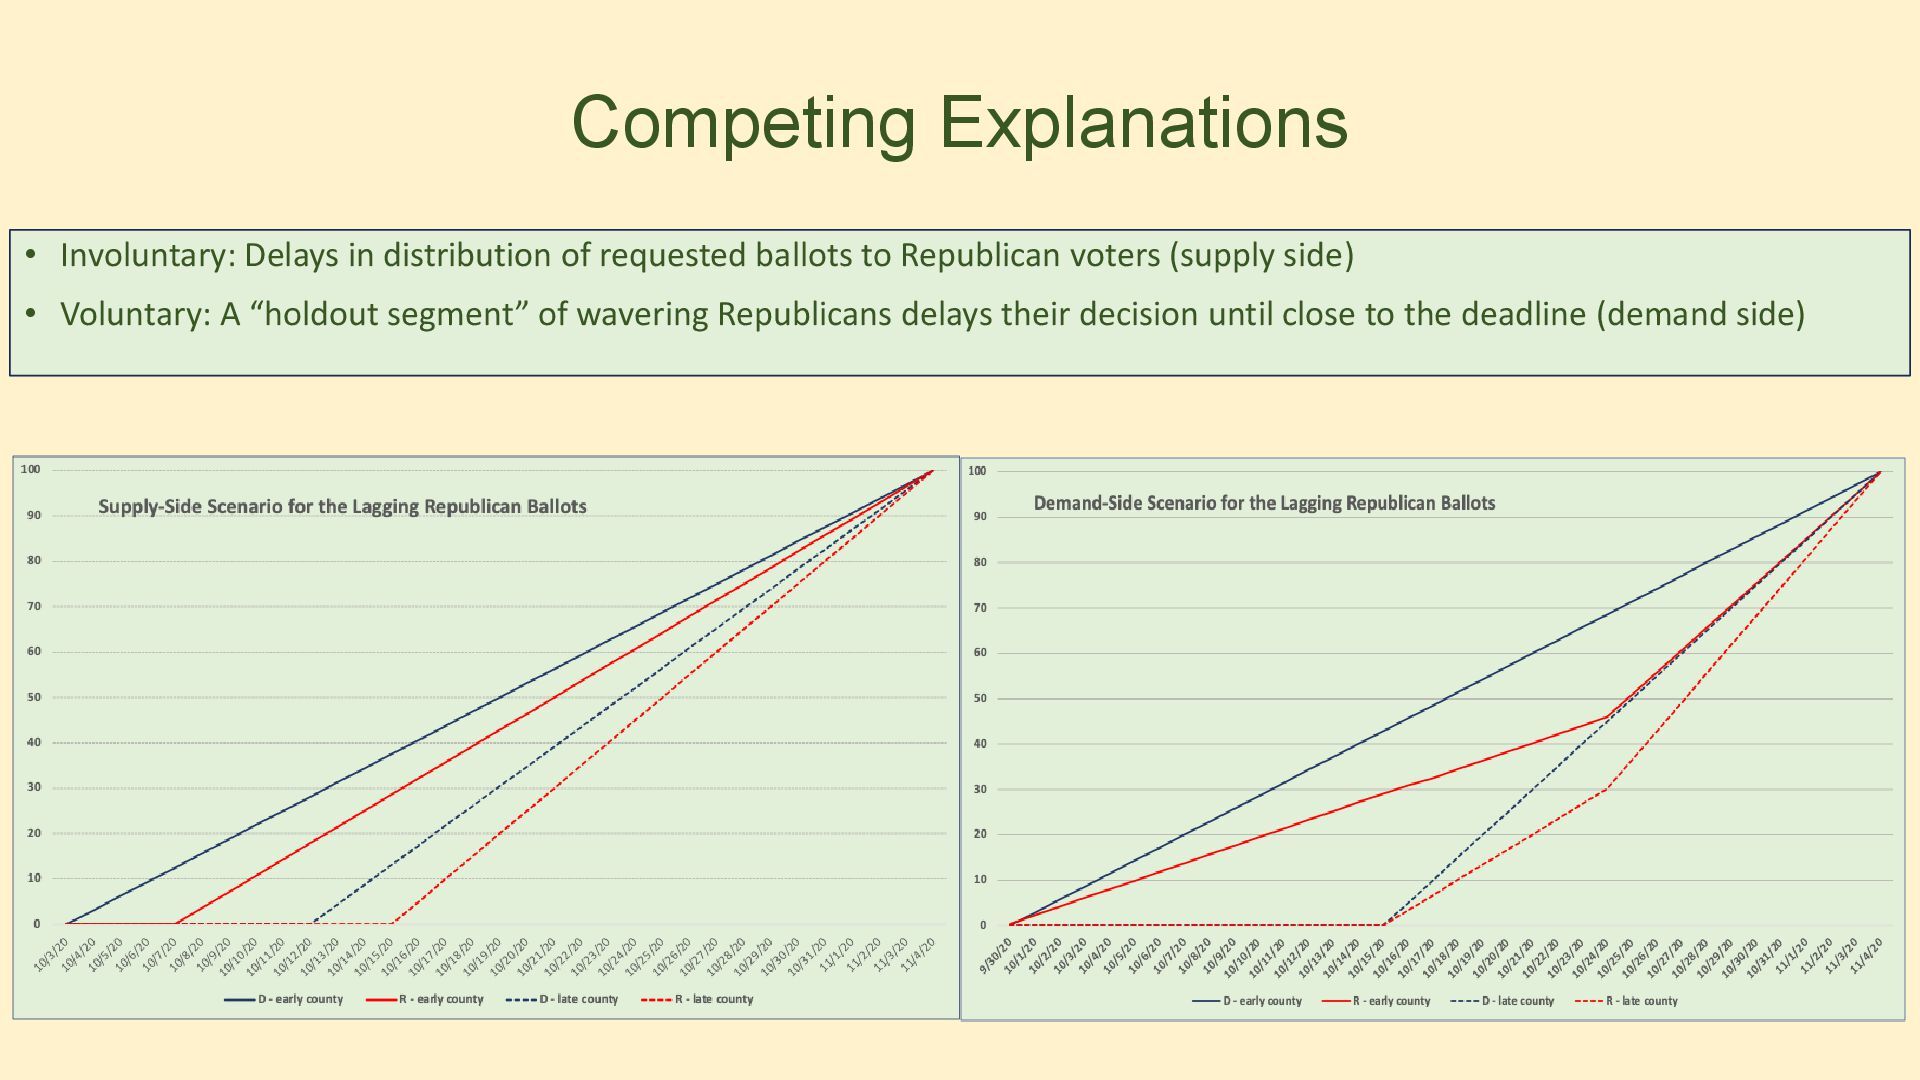
to Republican voters (supply side) • Voluntary: A “holdout segment” of wavering Republicans delays their decision until close to the deadline (demand side)
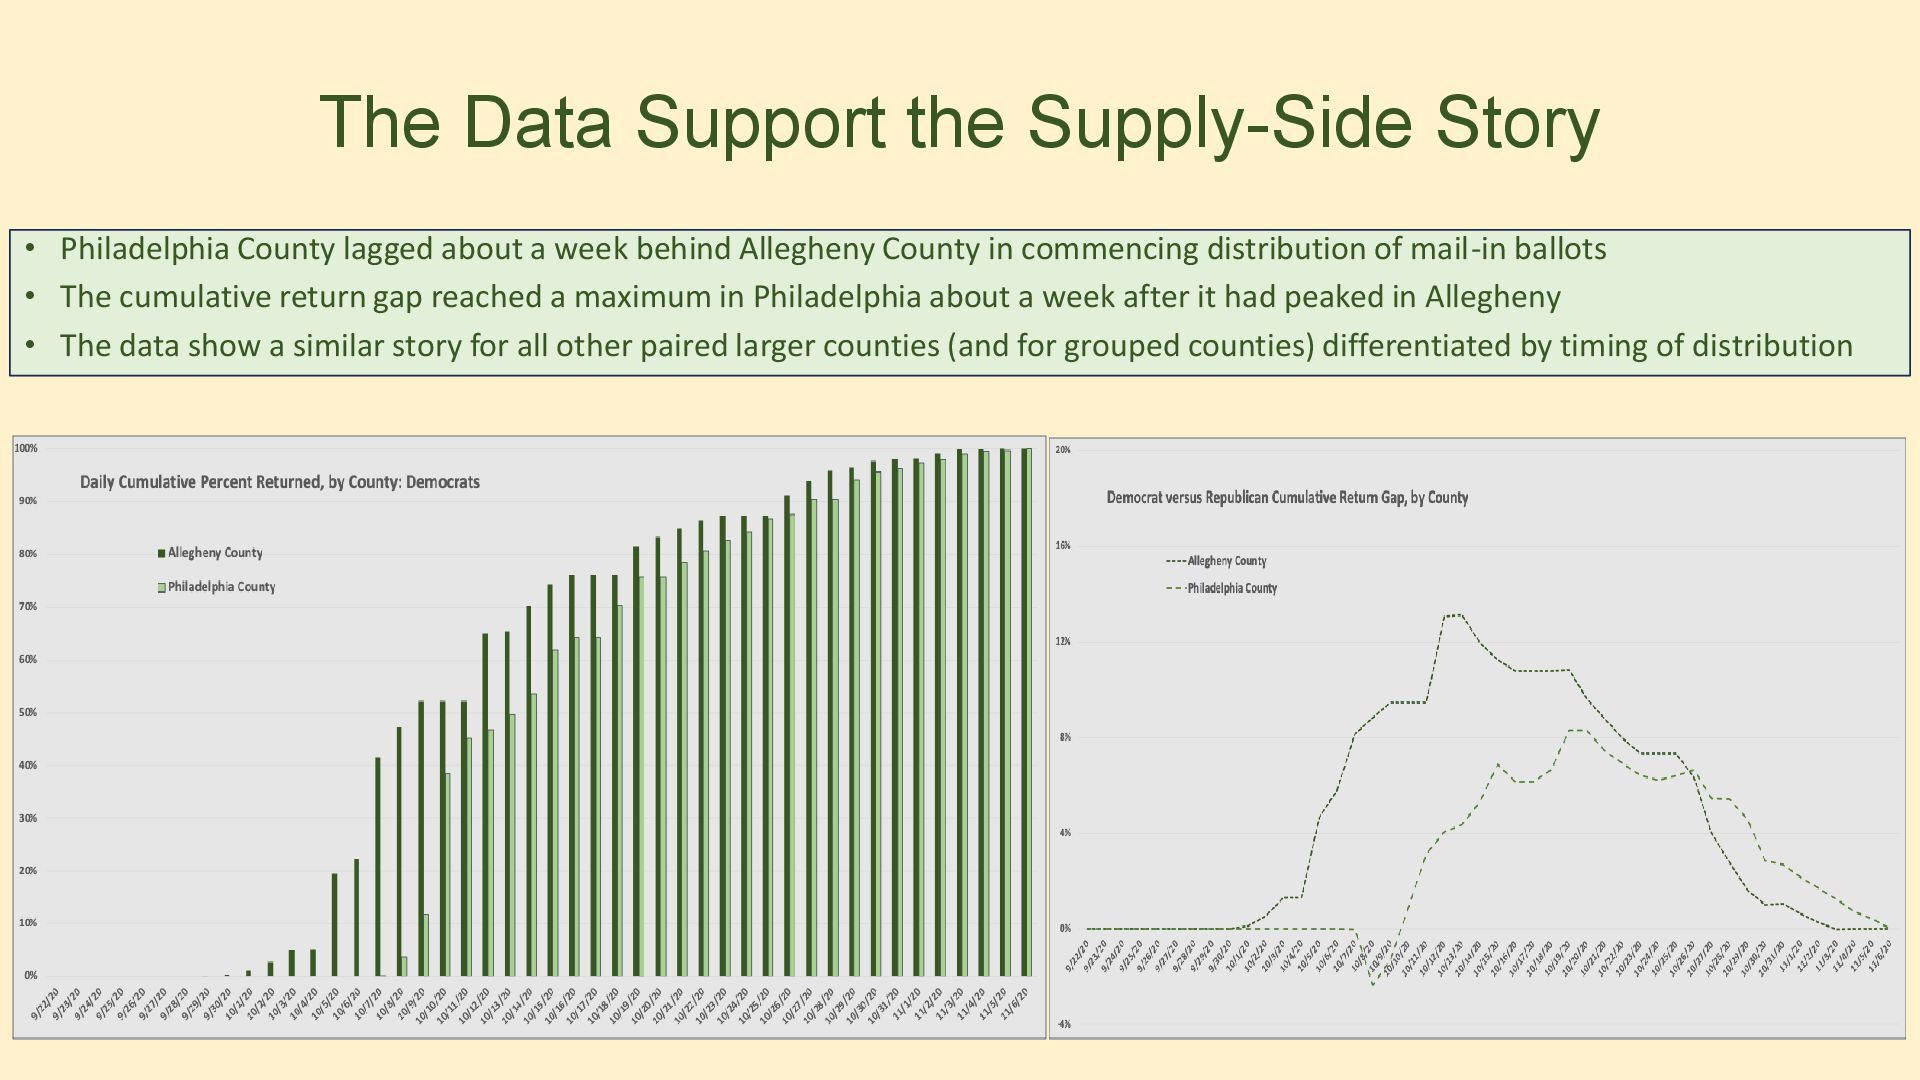
about a week behind Allegheny County in commencing distribution of mail-in ballots • The cumulative return gap reached a maximum in Philadelphia about a week after it had peaked in Allegheny • The data show a similar story for all other paired larger counties (and for grouped counties) differentiated by timing of distribution
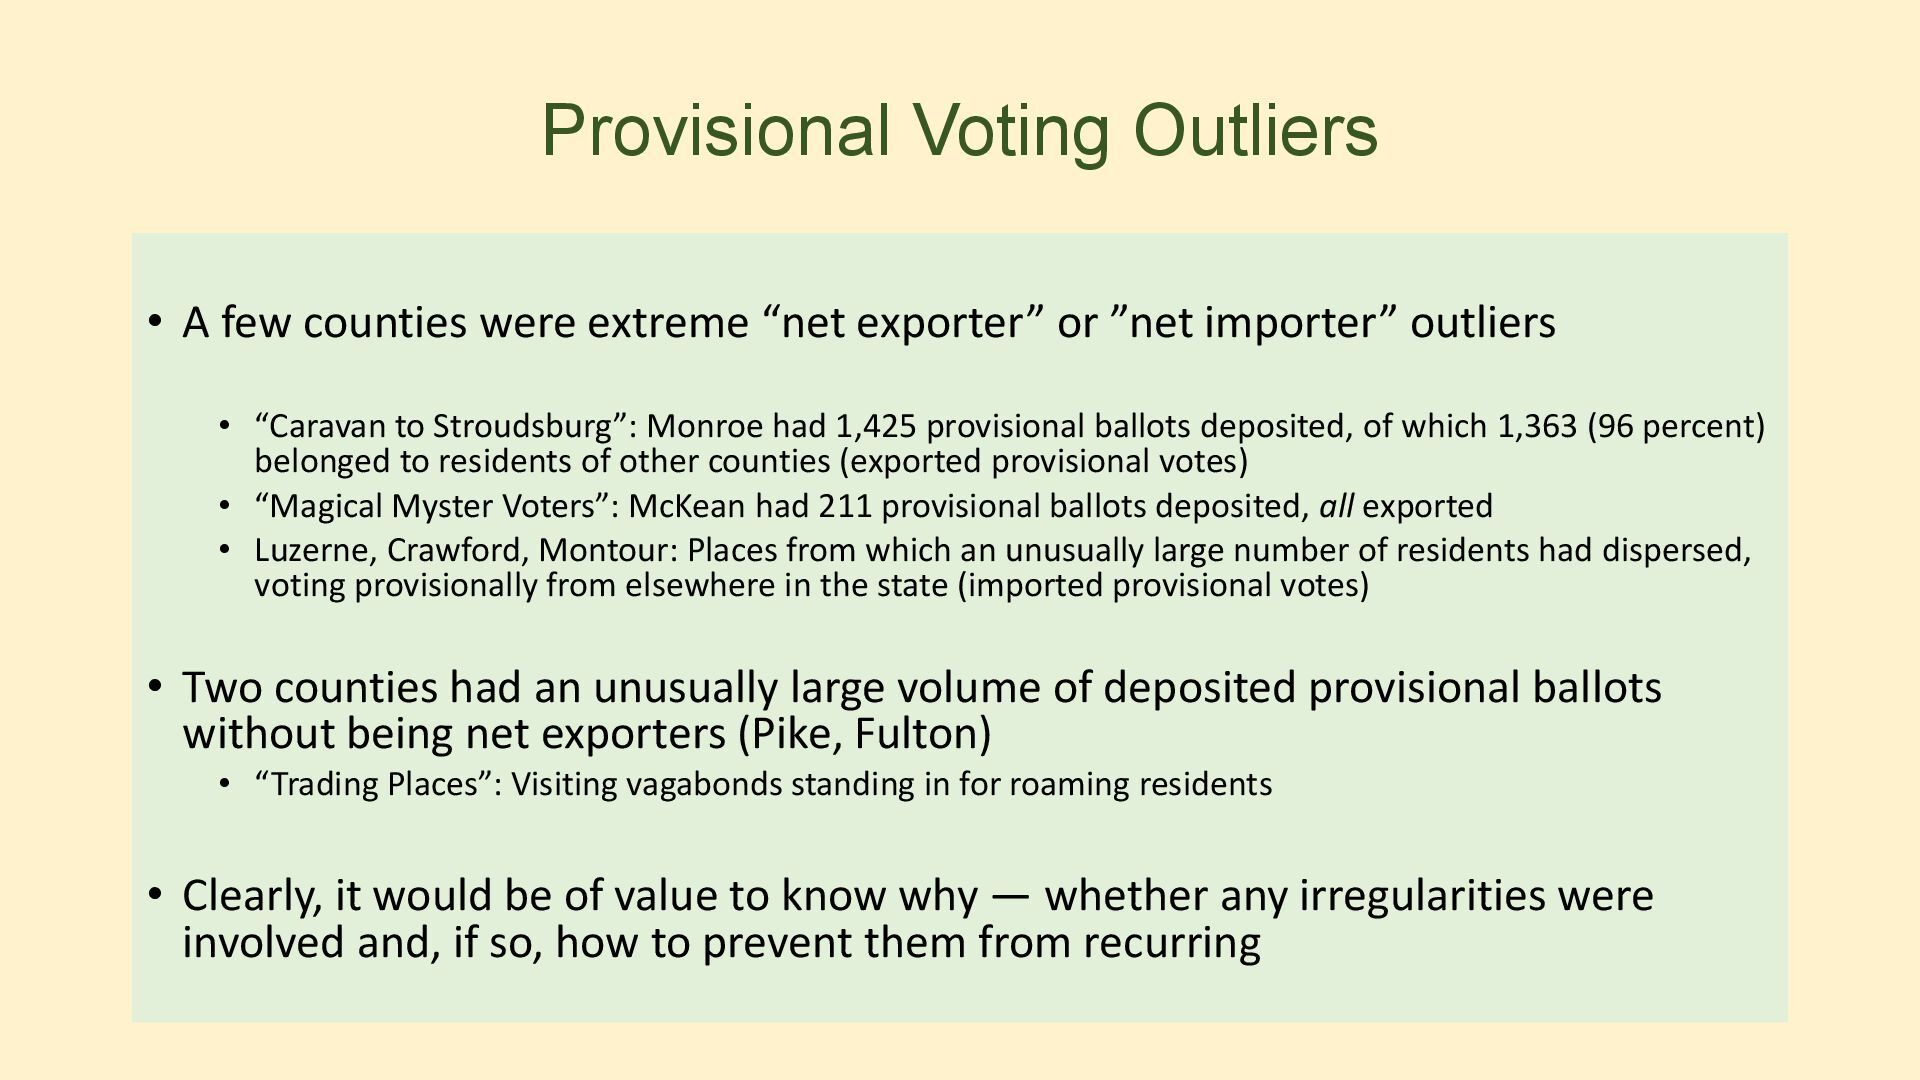
exporter” or ”net importer” outliers • “Caravan to Stroudsburg”: Monroe had 1,425 provisional ballots deposited, of which 1,363 (96 percent) belonged to residents of other counties (exported provisional votes) • “Magical Myster Voters”: McKean had 211 provisional ballots deposited, all exported • Luzerne, Crawford, Montour: Places from which an unusually large number of residents had dispersed, voting provisionally from elsewhere in the state (imported provisional votes) • Two counties had an unusually large volume of deposited provisional ballots without being net exporters (Pike, Fulton) • “Trading Places”: Visiting vagabonds standing in for roaming residents • Clearly, it would be of value to know why — whether any irregularities were involved and, if so, how to prevent them from recurring
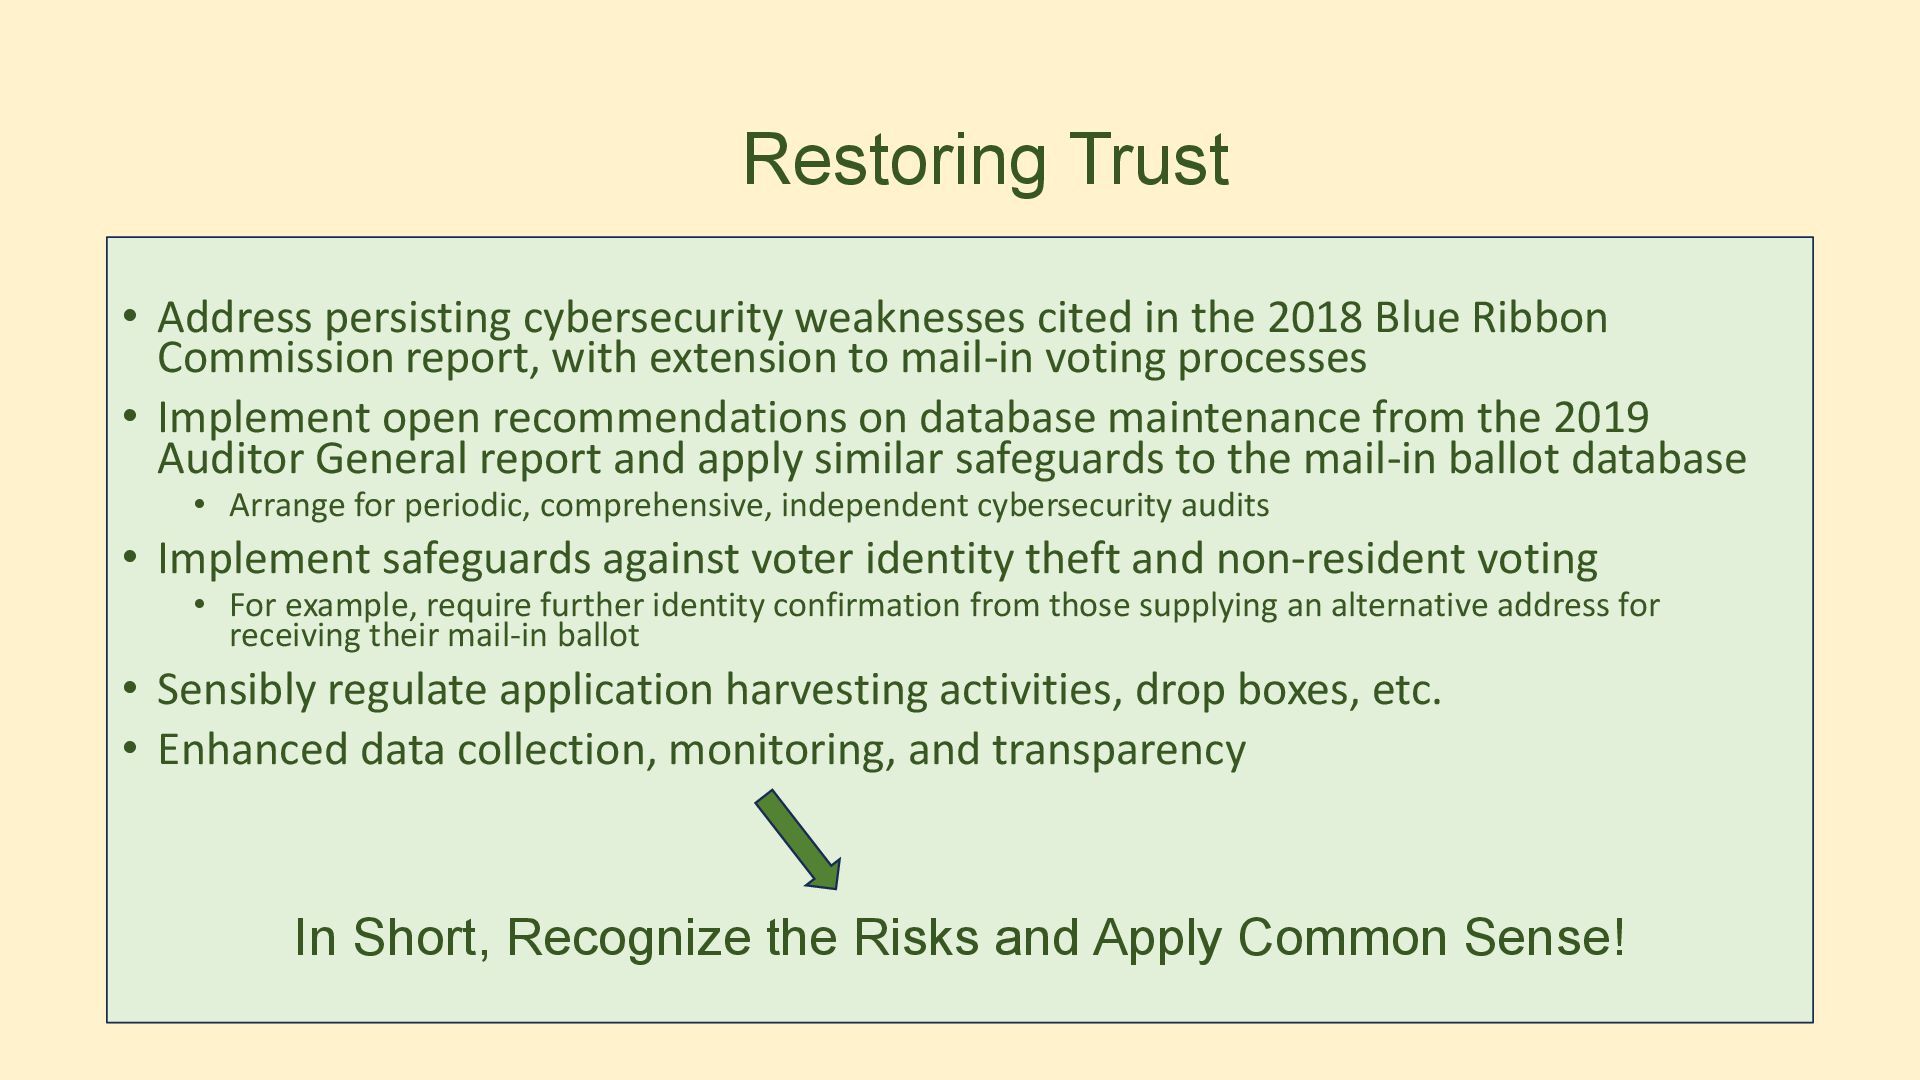
2018 Blue Ribbon Commission report, with extension to mail-in voting processes • Implement open recommendations on database maintenance from the 2019 Auditor General report and apply similar safeguards to the mail-in ballot database • Arrange for periodic, comprehensive, independent cybersecurity audits • Implement safeguards against voter identity theft and non-resident voting • For example, require further identity confirmation from those supplying an alternative address for receiving their mail-in ballot • Sensibly regulate application harvesting activities, drop boxes, etc. • Enhanced data collection, monitoring, and transparency In Short, Recognize the Risks and Apply Common Sense!