Communication Fund (NPO corporation), Gumclean Company Ltd. Technological Assistance: Pirika, Inc. http://tokyo2020.pirika.org Research of the Severity of Litter at Proposed Tokyo Olympics Venues
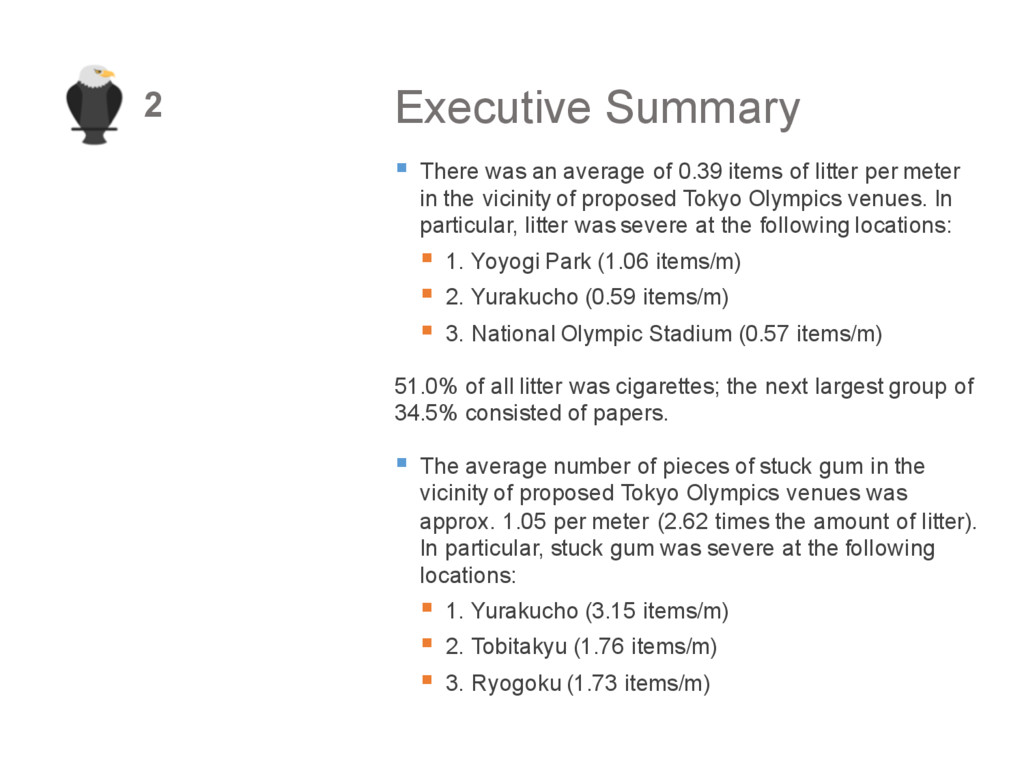
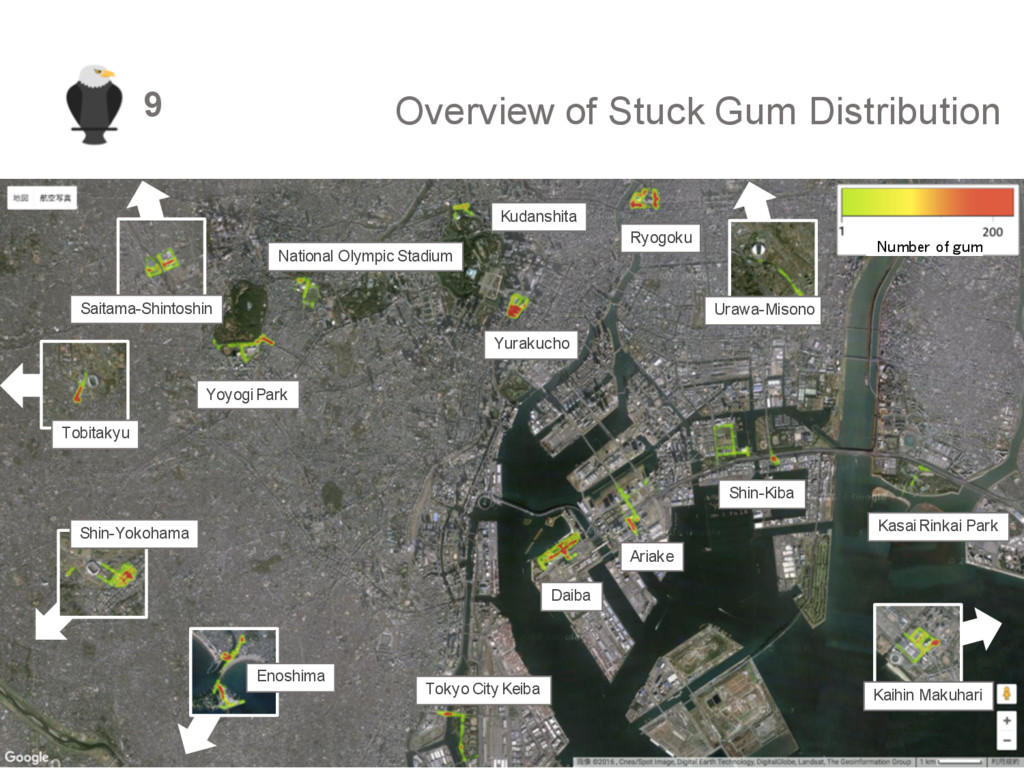
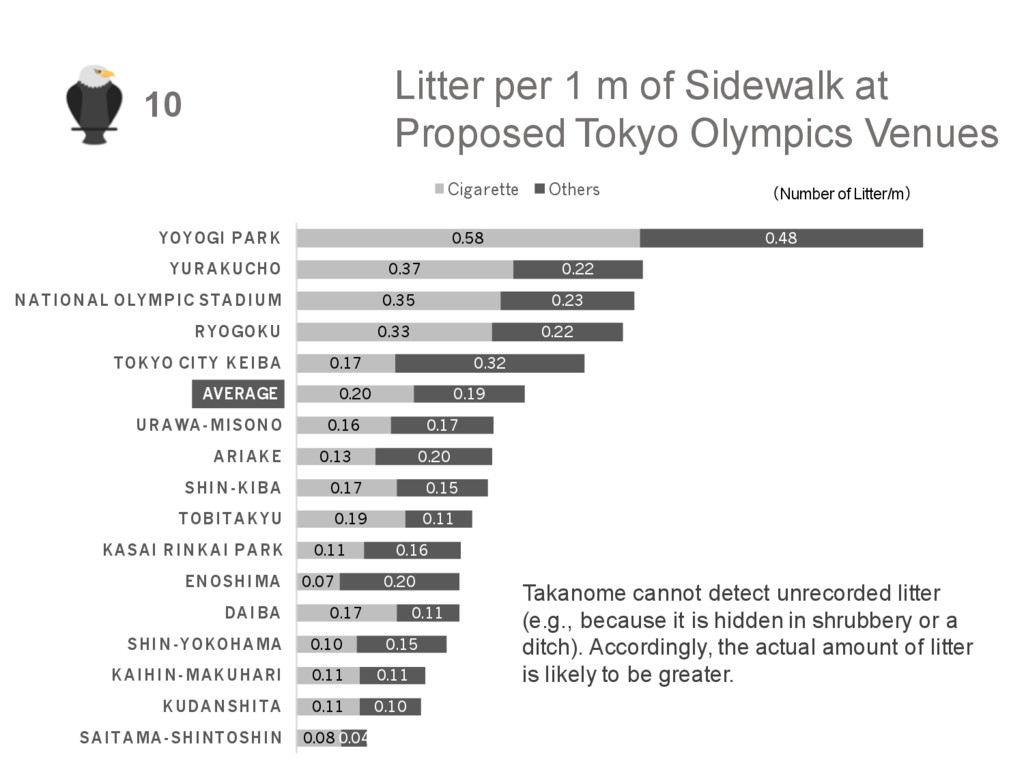
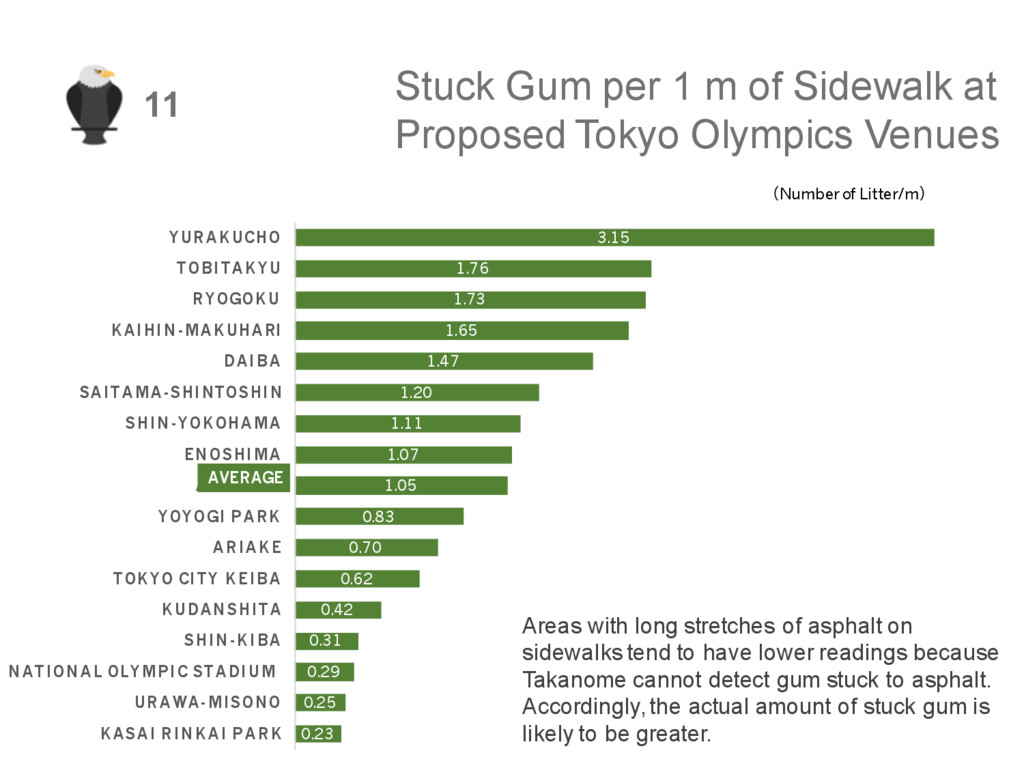
of litter per meter in the vicinity of proposed Tokyo Olympics venues. In particular, litter was severe at the following locations: § 1. Yoyogi Park (1.06 items/m) § 2. Yurakucho (0.59 items/m) § 3. National Olympic Stadium (0.57 items/m) 51.0% of all litter was cigarettes; the next largest group of 34.5% consisted of papers. § The average number of pieces of stuck gum in the vicinity of proposed Tokyo Olympics venues was approx. 1.05 per meter (2.62 times the amount of litter). In particular, stuck gum was severe at the following locations: § 1. Yurakucho (3.15 items/m) § 2. Tobitakyu (1.76 items/m) § 3. Ryogoku (1.73 items/m) 2
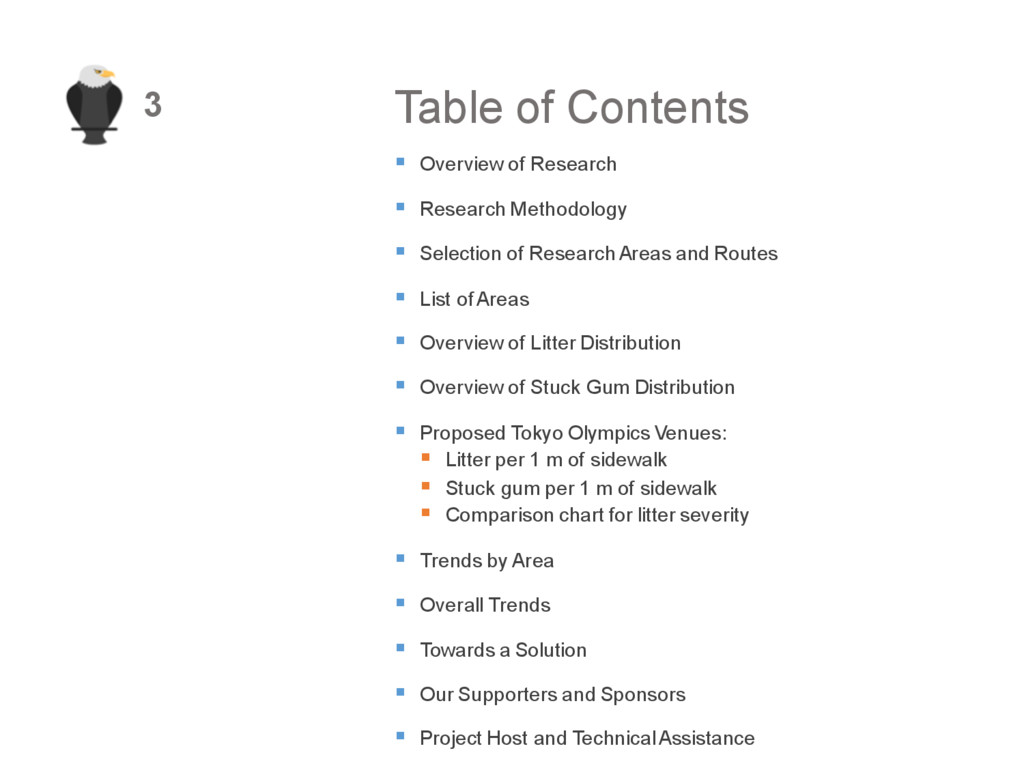
§ Selection of Research Areas and Routes § List of Areas § Overview of Litter Distribution § Overview of Stuck Gum Distribution § Proposed Tokyo Olympics Venues: § Litter per 1 m of sidewalk § Stuck gum per 1 m of sidewalk § Comparison chart for litter severity § Trends by Area § Overall Trends § Towards a Solution § Our Supporters and Sponsors § Project Host and Technical Assistance 3
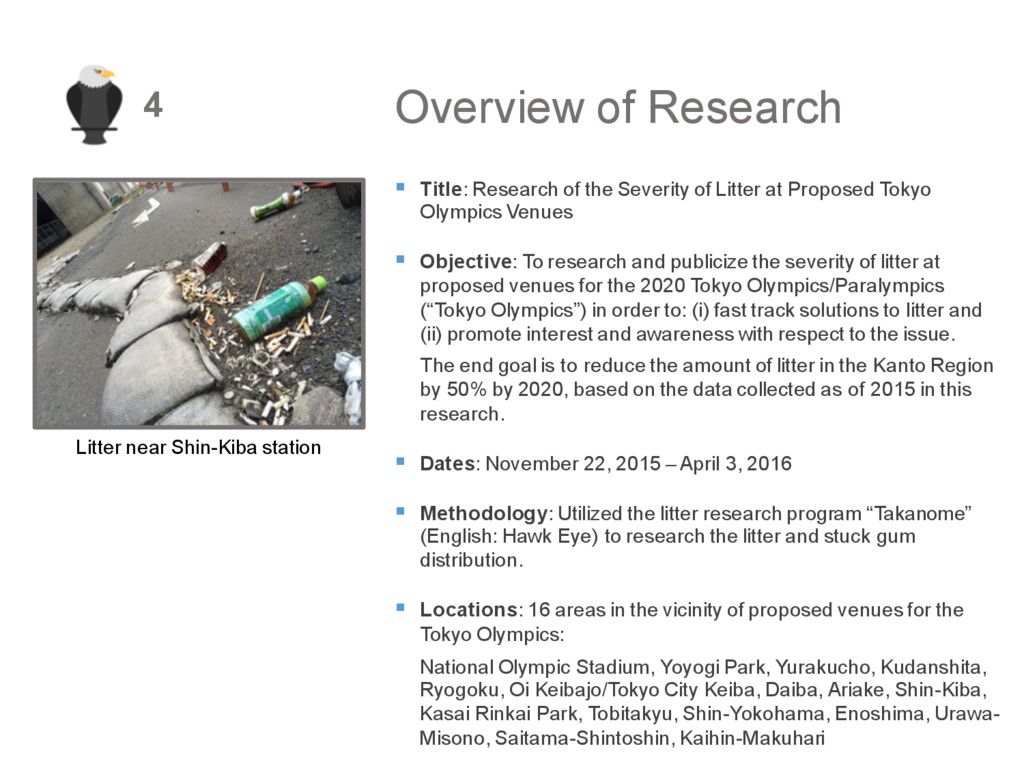
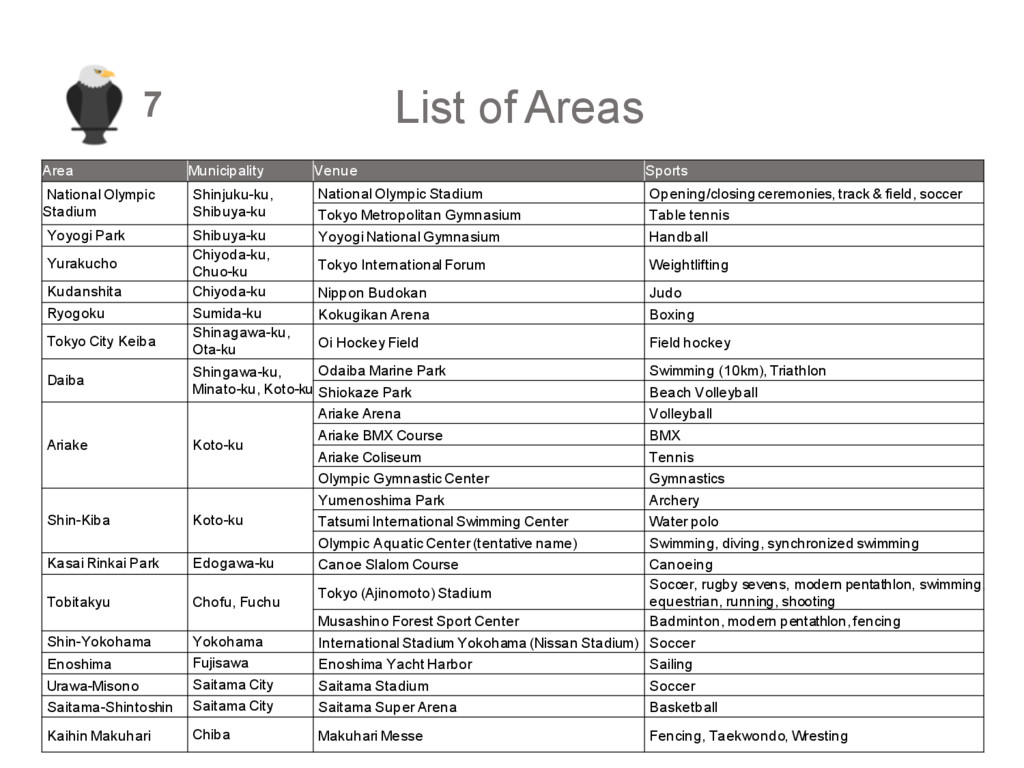
Litter at Proposed Tokyo Olympics Venues § Objective: To research and publicize the severity of litter at proposed venues for the 2020 Tokyo Olympics/Paralympics (“Tokyo Olympics”) in order to: (i) fast track solutions to litter and (ii) promote interest and awareness with respect to the issue. The end goal is to reduce the amount of litter in the Kanto Region by 50% by 2020, based on the data collected as of 2015 in this research. § Dates: November 22, 2015 – April 3, 2016 § Methodology: Utilized the litter research program “Takanome” (English: Hawk Eye) to research the litter and stuck gum distribution. § Locations: 16 areas in the vicinity of proposed venues for the Tokyo Olympics: National Olympic Stadium, Yoyogi Park, Yurakucho, Kudanshita, Ryogoku, Oi Keibajo/Tokyo City Keiba, Daiba, Ariake, Shin-Kiba, Kasai Rinkai Park, Tobitakyu, Shin-Yokohama, Enoshima, Urawa- Misono, Saitama-Shintoshin, Kaihin-Makuhari 4 Litter near Shin-Kiba station
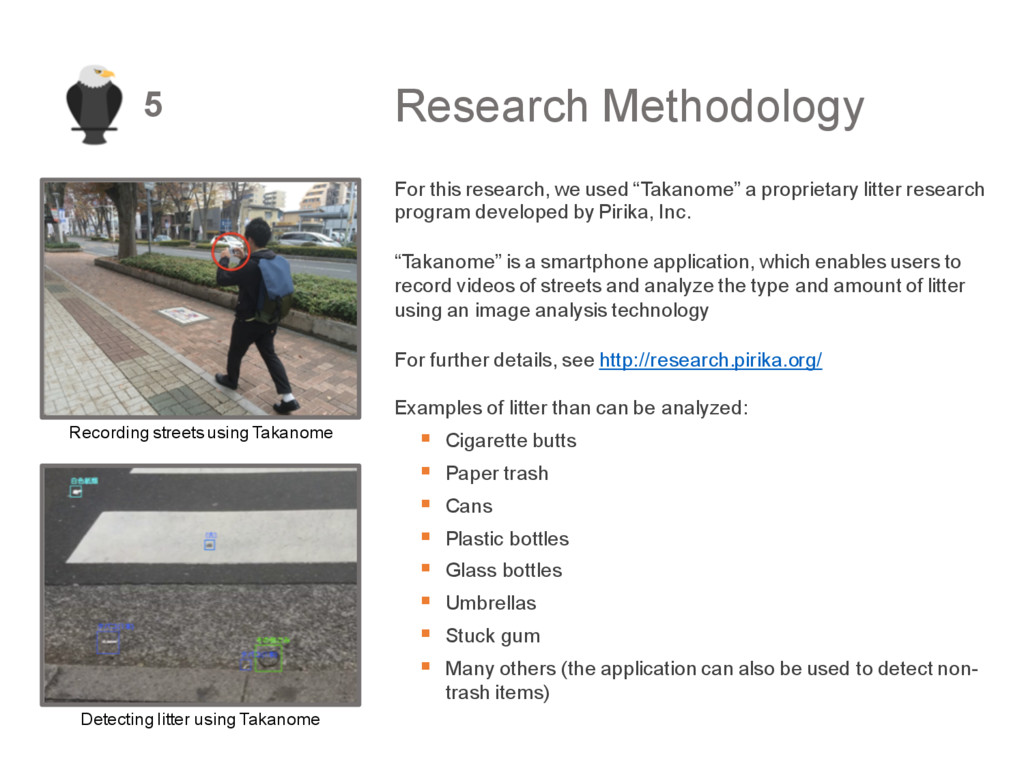
litter research program developed by Pirika, Inc. “Takanome” is a smartphone application, which enables users to record videos of streets and analyze the type and amount of litter using an image analysis technology For further details, see http://research.pirika.org/ Examples of litter than can be analyzed: § Cigarette butts § Paper trash § Cans § Plastic bottles § Glass bottles § Umbrellas § Stuck gum § Many others (the application can also be used to detect non- trash items) 5 Recording streets using Takanome Detecting litter using Takanome
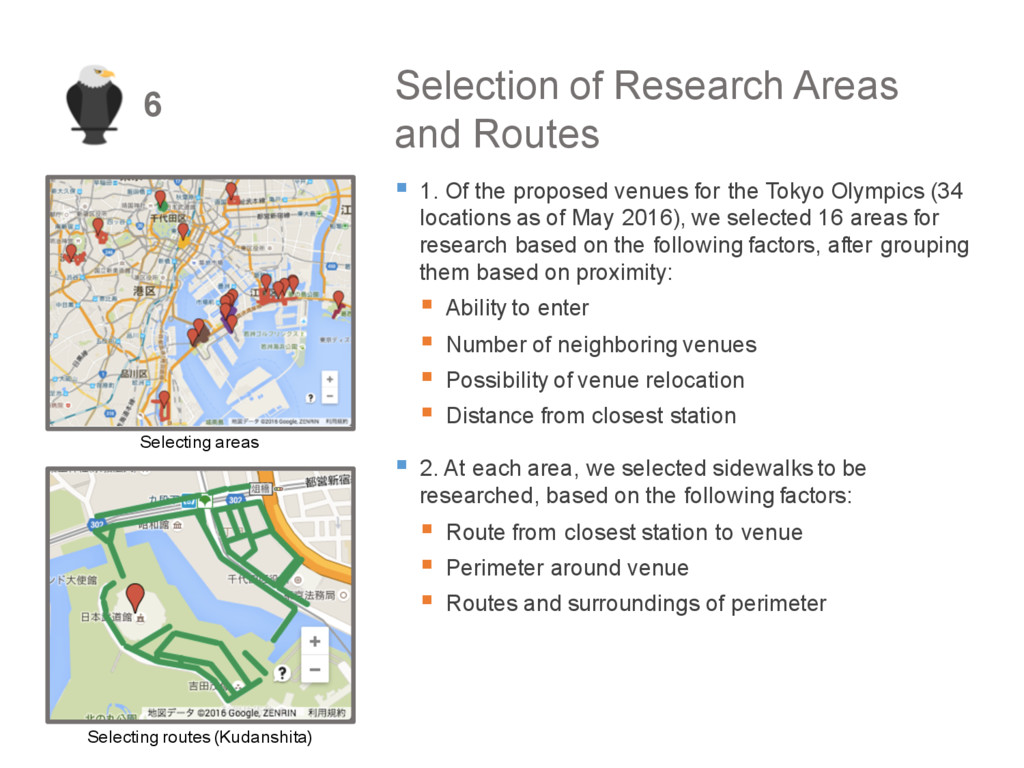
proposed venues for the Tokyo Olympics (34 locations as of May 2016), we selected 16 areas for research based on the following factors, after grouping them based on proximity: § Ability to enter § Number of neighboring venues § Possibility of venue relocation § Distance from closest station § 2. At each area, we selected sidewalks to be researched, based on the following factors: § Route from closest station to venue § Perimeter around venue § Routes and surroundings of perimeter 6 Selecting areas Selecting routes (Kudanshita)
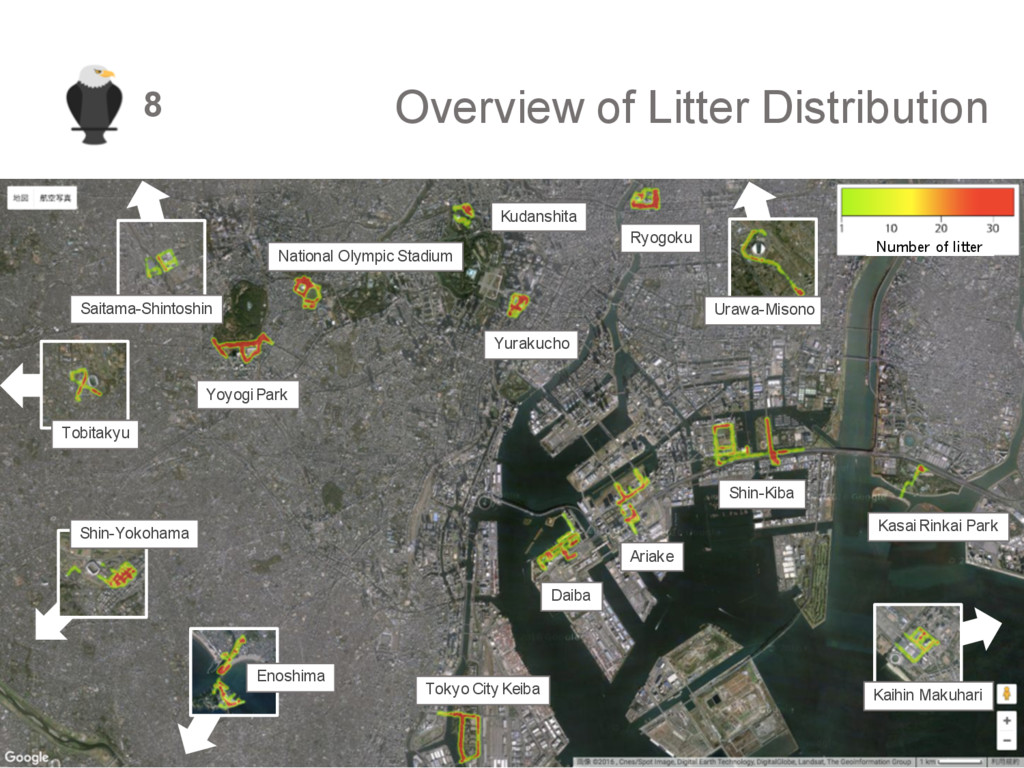
Park Yurakucho Ryogoku Kudanshita National Olympic Stadium Yoyogi Park Tokyo City Keiba Saitama-Shintoshin Shin-Yokohama Enoshima Urawa-Misono Kaihin Makuhari Tobitakyu Number of litter
Rinkai Park Yurakucho Ryogoku Kudanshita National Olympic Stadium Yoyogi Park Tokyo City Keiba Saitama-Shintoshin Tobitakyu Shin-Yokohama Enoshima Urawa-Misono Kaihin Makuhari Number of gum
0.16 0.20 0.17 0.33 0.35 0.37 0.58 0.04 0.10 0.11 0.15 0.11 0.20 0.16 0.11 0.15 0.20 0.17 0.19 0.32 0.22 0.23 0.22 0.48 SAITAMA-SHINTOSHIN KUDANSHITA KAIHIN-MAKUHARI SHIN-YOKOHAMA DAIBA ENOSHIMA KASAI RINKAI PARK TOBITAKYU SHIN-KIBA ARIAKE URAWA-MISONO AVERAGE TOKYO CITY KEIBA RYOGOKU NATIONAL OLYMPIC STADIUM YURAKUCHO YOYOGI PARK Cigarette Others Litter per 1 m of Sidewalk at Proposed Tokyo Olympics Venues 10 (Number of Litter/m) Takanome cannot detect unrecorded litter (e.g., because it is hidden in shrubbery or a ditch). Accordingly, the actual amount of litter is likely to be greater. AVERAGE
1.11 1.20 1.47 1.65 1.73 1.76 3.15 KASAI RINKAI PARK URAWA-MISONO NATIONAL OLYMPIC STADIUM SHIN-KIBA KUDANSHITA TOKYO CITY KEIBA ARIAKE YOYOGI PARK AVERAGE ENOSHIMA SHIN-YOKOHAMA SAITAMA-SHINTOSHIN DAIBA KAIHIN-MAKUHARI RYOGOKU TOBITAKYU YURAKUCHO Stuck Gum per 1 m of Sidewalk at Proposed Tokyo Olympics Venues 11 Areas with long stretches of asphalt on sidewalks tend to have lower readings because Takanome cannot detect gum stuck to asphalt. Accordingly, the actual amount of stuck gum is likely to be greater. AVERAGE (Number of Litter/m)
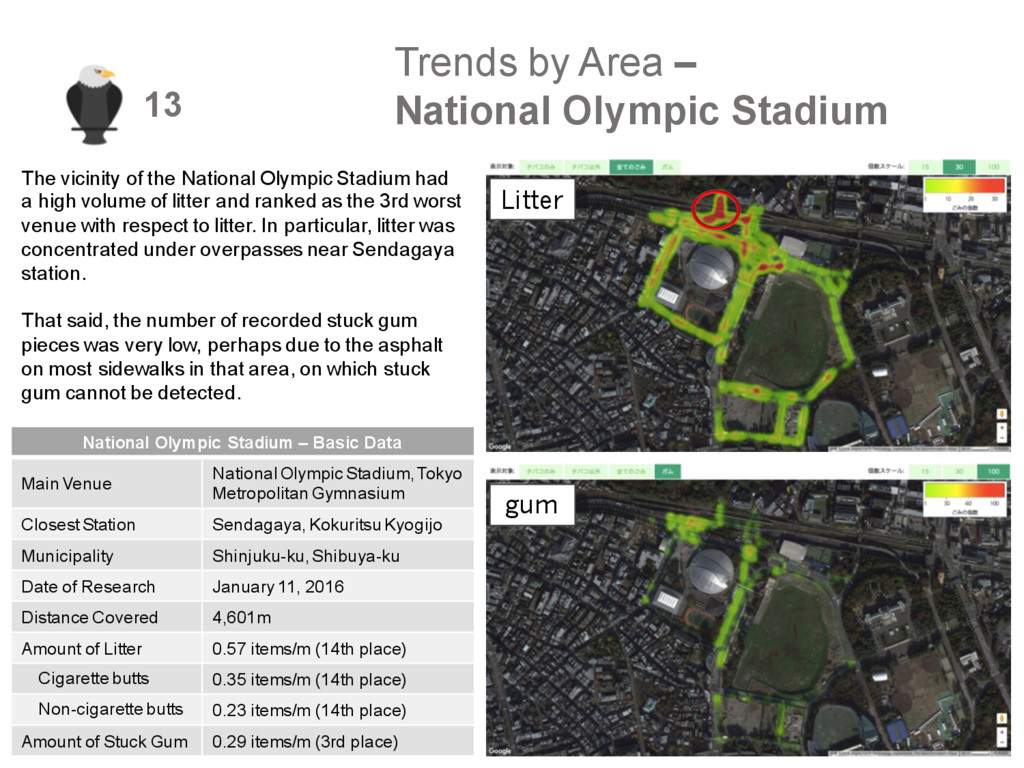
of the National Olympic Stadium had a high volume of litter and ranked as the 3rd worst venue with respect to litter. In particular, litter was concentrated under overpasses near Sendagaya station. That said, the number of recorded stuck gum pieces was very low, perhaps due to the asphalt on most sidewalks in that area, on which stuck gum cannot be detected. National Olympic Stadium – Basic Data Main Venue National Olympic Stadium, Tokyo Metropolitan Gymnasium Closest Station Sendagaya,Kokuritsu Kyogijo Municipality Shinjuku-ku,Shibuya-ku Date of Research January 11, 2016 Distance Covered 4,601m Amount of Litter 0.57 items/m (14th place) Cigarette butts 0.35 items/m (14th place) Non-cigarette butts 0.23 items/m (14th place) Amount of Stuck Gum 0.29 items/m (3rd place) Litter gum
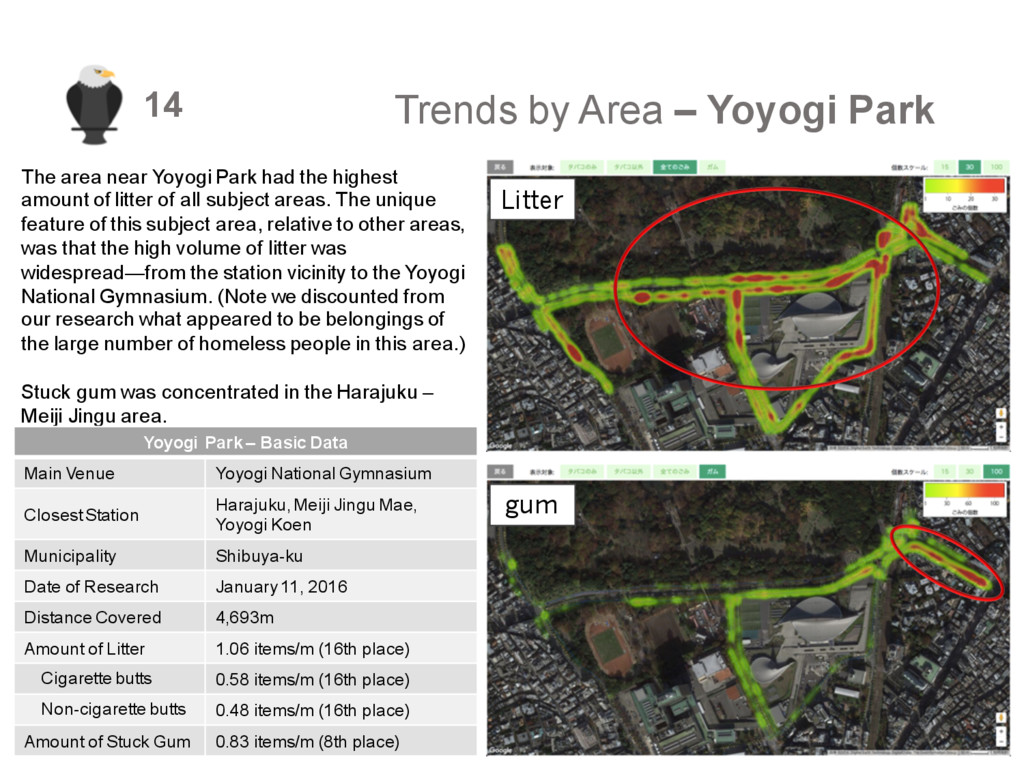
Yoyogi Park had the highest amount of litter of all subject areas. The unique feature of this subject area, relative to other areas, was that the high volume of litter was widespread—from the station vicinity to the Yoyogi National Gymnasium. (Note we discounted from our research what appeared to be belongings of the large number of homeless people in this area.) Stuck gum was concentrated in the Harajuku – Meiji Jingu area. Yoyogi Park – Basic Data Main Venue Yoyogi National Gymnasium Closest Station Harajuku, Meiji Jingu Mae, Yoyogi Koen Municipality Shibuya-ku Date of Research January 11, 2016 Distance Covered 4,693m Amount of Litter 1.06 items/m (16th place) Cigarette butts 0.58 items/m (16th place) Non-cigarette butts 0.48 items/m (16th place) Amount of Stuck Gum 0.83 items/m (8th place) Litter gum
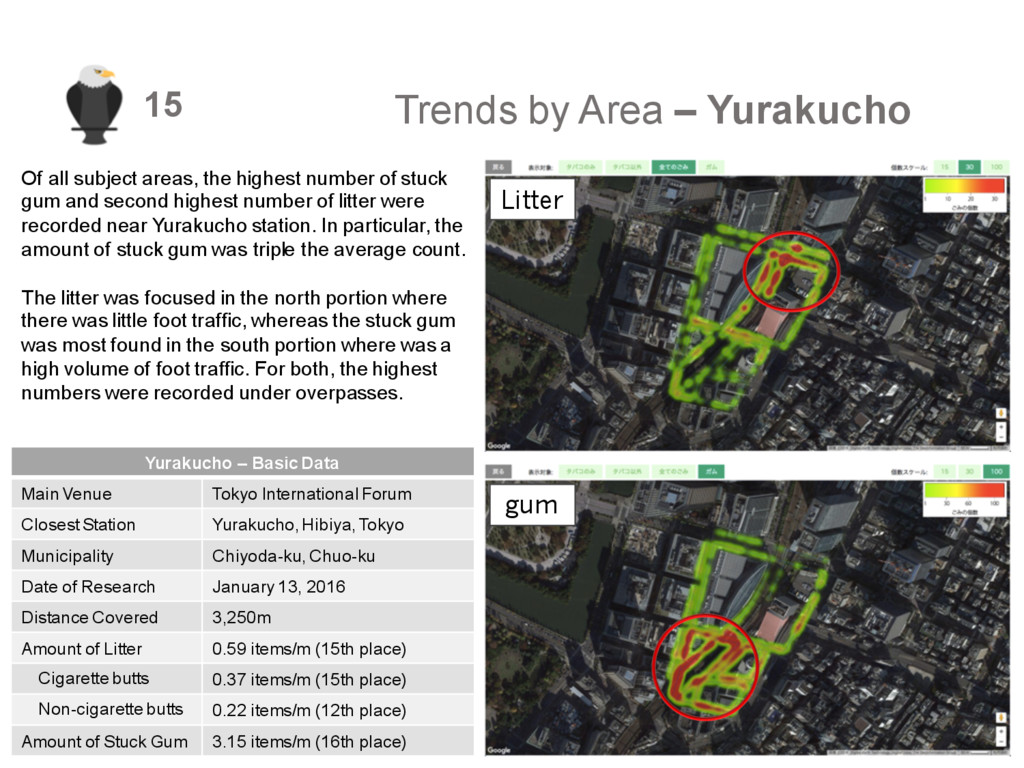
the highest number of stuck gum and second highest number of litter were recorded near Yurakucho station. In particular, the amount of stuck gum was triple the average count. The litter was focused in the north portion where there was little foot traffic, whereas the stuck gum was most found in the south portion where was a high volume of foot traffic. For both, the highest numbers were recorded under overpasses. Yurakucho – Basic Data Main Venue Tokyo International Forum Closest Station Yurakucho,Hibiya, Tokyo Municipality Chiyoda-ku,Chuo-ku Date of Research January 13, 2016 Distance Covered 3,250m Amount of Litter 0.59 items/m (15th place) Cigarette butts 0.37 items/m (15th place) Non-cigarette butts 0.22 items/m (12th place) Amount of Stuck Gum 3.15 items/m (16th place) Litter gum
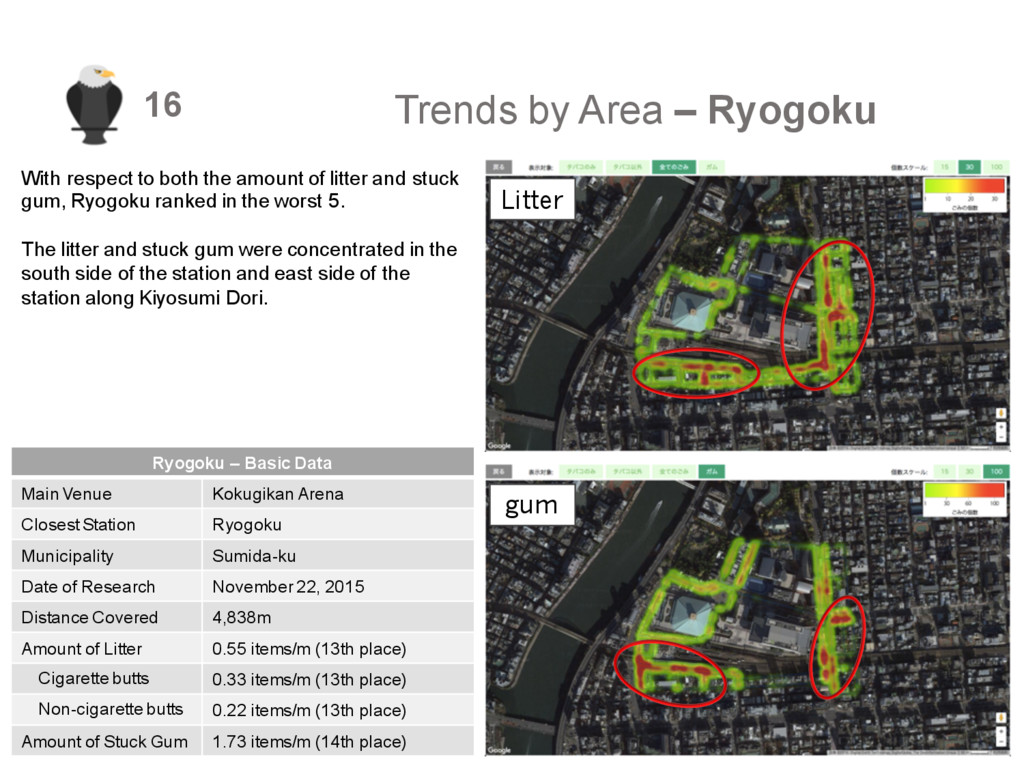
the amount of litter and stuck gum, Ryogoku ranked in the worst 5. The litter and stuck gum were concentrated in the south side of the station and east side of the station along Kiyosumi Dori. Ryogoku – Basic Data Main Venue Kokugikan Arena Closest Station Ryogoku Municipality Sumida-ku Date of Research November 22, 2015 Distance Covered 4,838m Amount of Litter 0.55 items/m (13th place) Cigarette butts 0.33 items/m (13th place) Non-cigarette butts 0.22 items/m (13th place) Amount of Stuck Gum 1.73 items/m (14th place) Litter gum
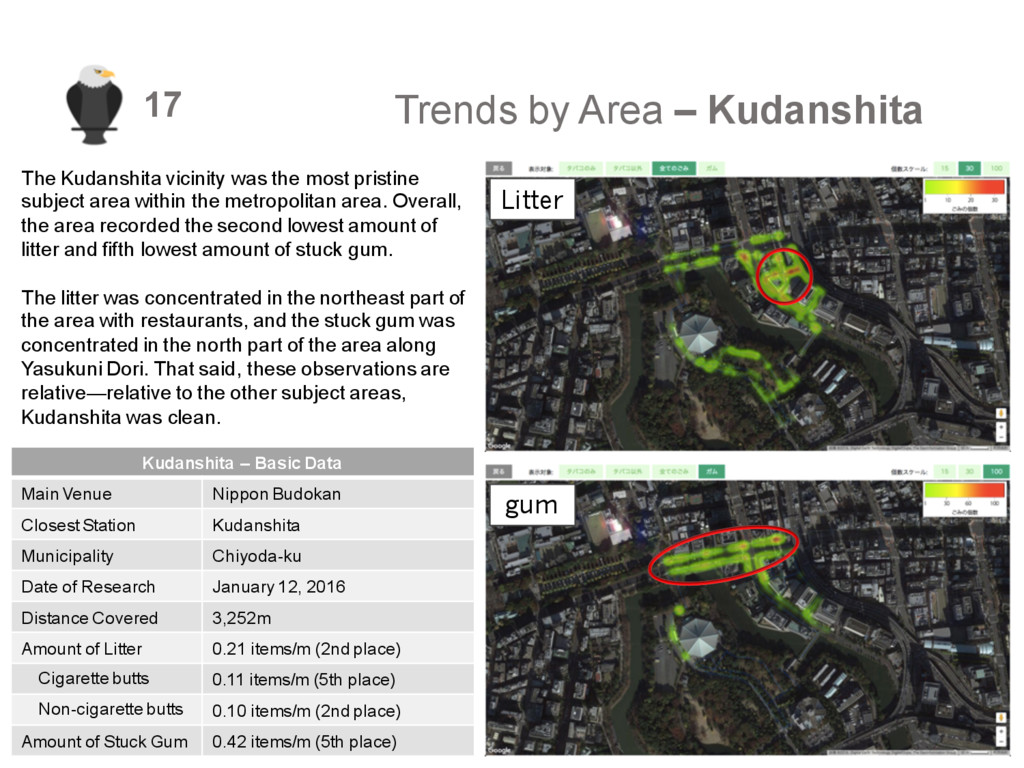
the most pristine subject area within the metropolitan area. Overall, the area recorded the second lowest amount of litter and fifth lowest amount of stuck gum. The litter was concentrated in the northeast part of the area with restaurants, and the stuck gum was concentrated in the north part of the area along Yasukuni Dori. That said, these observations are relative—relative to the other subject areas, Kudanshita was clean. Kudanshita – Basic Data Main Venue Nippon Budokan Closest Station Kudanshita Municipality Chiyoda-ku Date of Research January 12, 2016 Distance Covered 3,252m Amount of Litter 0.21 items/m (2nd place) Cigarette butts 0.11 items/m (5th place) Non-cigarette butts 0.10 items/m (2nd place) Amount of Stuck Gum 0.42 items/m (5th place) Litter gum
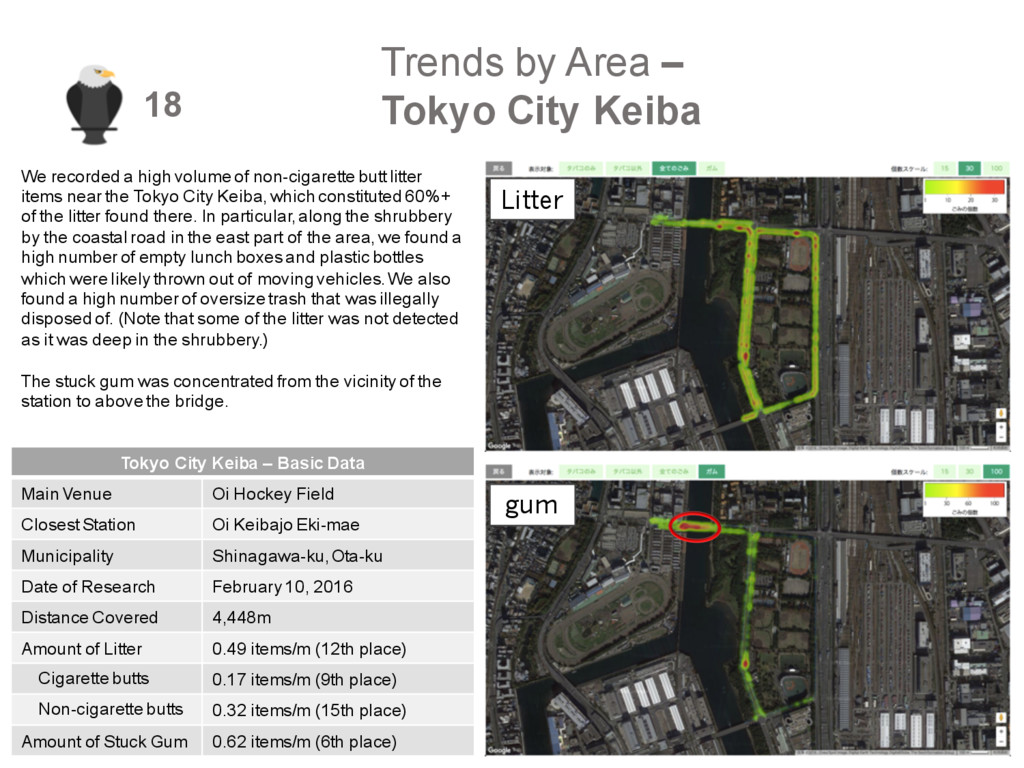
a high volume of non-cigarette butt litter items near the Tokyo City Keiba, which constituted 60%+ of the litter found there. In particular, along the shrubbery by the coastal road in the east part of the area, we found a high number of empty lunch boxes and plastic bottles which were likely thrown out of moving vehicles. We also found a high number of oversize trash that was illegally disposed of. (Note that some of the litter was not detected as it was deep in the shrubbery.) The stuck gum was concentrated from the vicinity of the station to above the bridge. Tokyo City Keiba – Basic Data Main Venue Oi Hockey Field Closest Station Oi Keibajo Eki-mae Municipality Shinagawa-ku,Ota-ku Date of Research February 10, 2016 Distance Covered 4,448m Amount of Litter 0.49 items/m (12th place) Cigarette butts 0.17 items/m (9th place) Non-cigarette butts 0.32 items/m (15th place) Amount of Stuck Gum 0.62 items/m (6th place) Litter gum
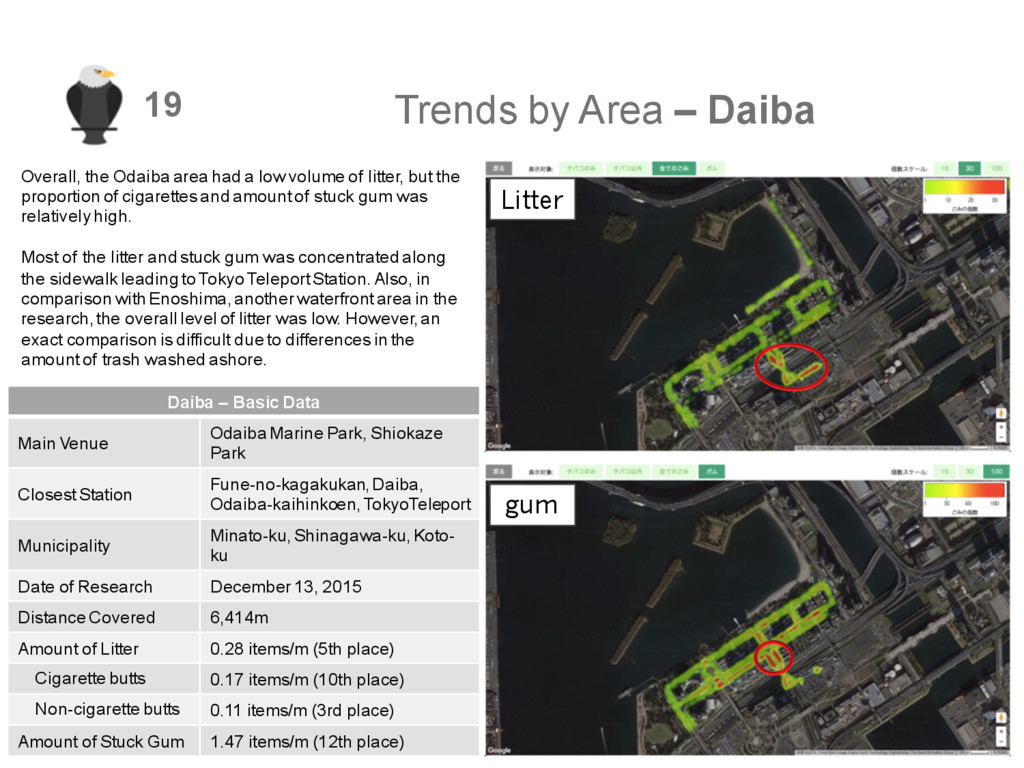
had a low volume of litter, but the proportion of cigarettes and amount of stuck gum was relatively high. Most of the litter and stuck gum was concentrated along the sidewalk leading to Tokyo Teleport Station. Also, in comparison with Enoshima, another waterfront area in the research, the overall level of litter was low. However, an exact comparison is difficult due to differences in the amount of trash washed ashore. Daiba – Basic Data Main Venue Odaiba Marine Park, Shiokaze Park ClosestStation Fune-no-kagakukan,Daiba, Odaiba-kaihinkoen, TokyoTeleport Municipality Minato-ku, Shinagawa-ku,Koto- ku Date of Research December 13, 2015 Distance Covered 6,414m Amount of Litter 0.28 items/m (5th place) Cigarette butts 0.17 items/m (10th place) Non-cigarette butts 0.11 items/m (3rd place) Amount of Stuck Gum 1.47 items/m (12th place) Litter gum
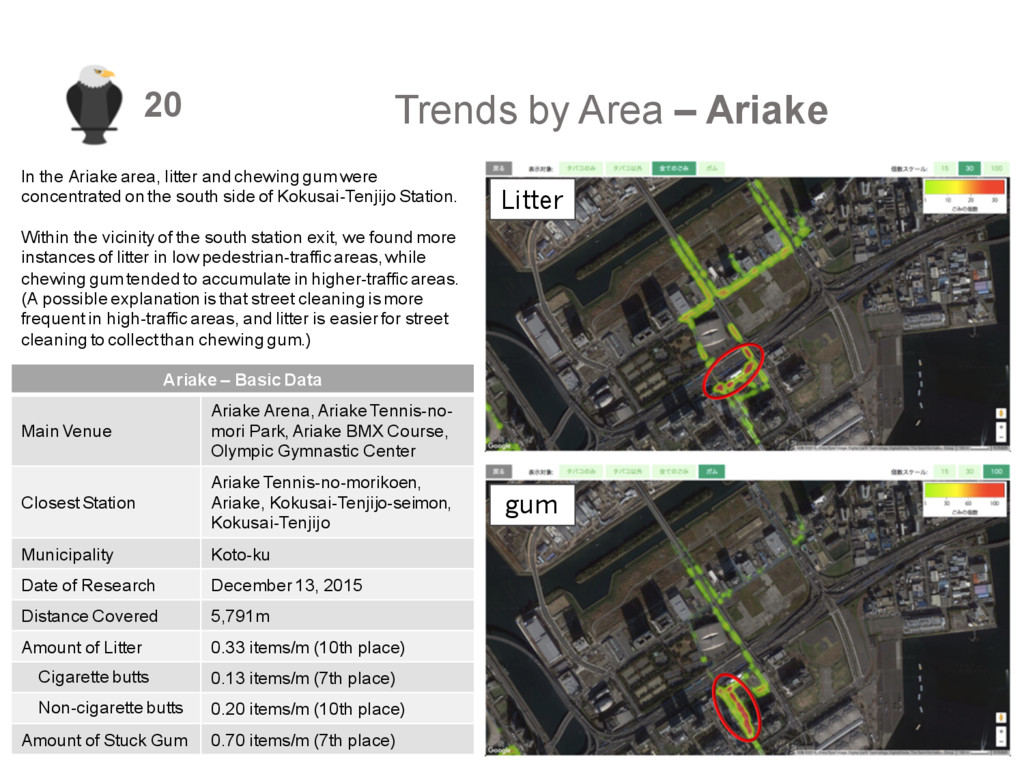
litter and chewing gum were concentrated on the south side of Kokusai-Tenjijo Station. Within the vicinity of the south station exit, we found more instances of litter in low pedestrian-traffic areas, while chewing gum tended to accumulate in higher-traffic areas. (A possible explanation is that street cleaning is more frequent in high-traffic areas, and litter is easier for street cleaning to collect than chewing gum.) Ariake – Basic Data Main Venue Ariake Arena,Ariake Tennis-no- mori Park, Ariake BMX Course, Olympic Gymnastic Center Closest Station Ariake Tennis-no-morikoen, Ariake, Kokusai-Tenjijo-seimon, Kokusai-Tenjijo Municipality Koto-ku Date of Research December 13, 2015 Distance Covered 5,791m Amount of Litter 0.33 items/m (10th place) Cigarette butts 0.13 items/m (7th place) Non-cigarette butts 0.20 items/m (10th place) Amount of Stuck Gum 0.70 items/m (7th place) Litter gum
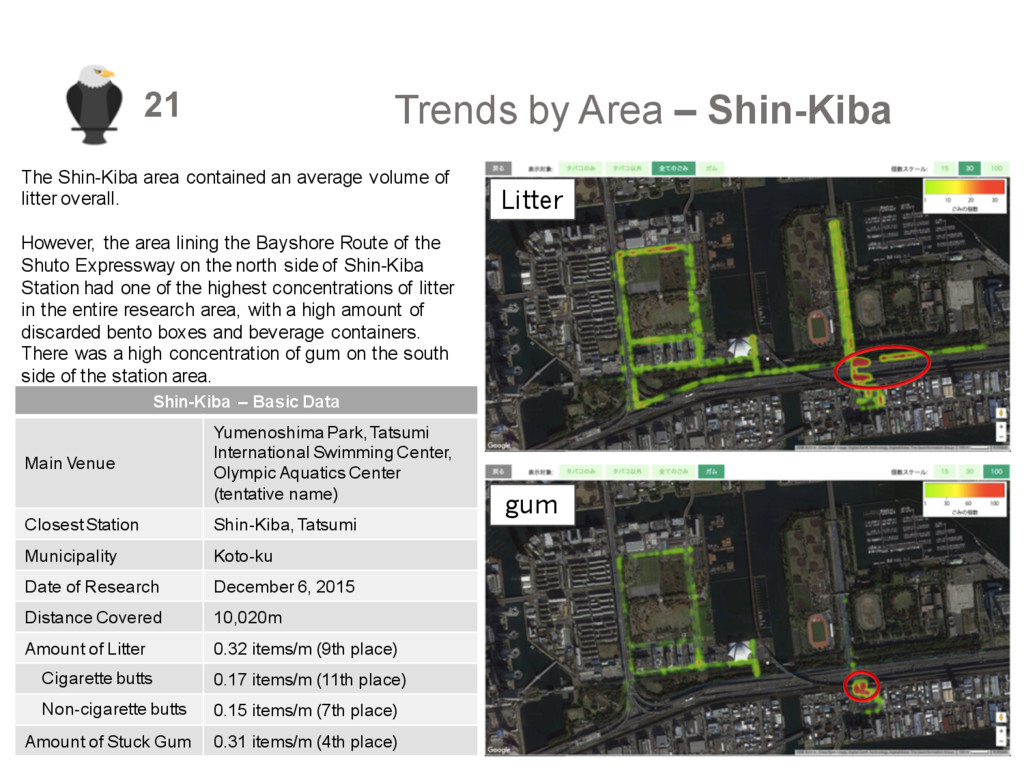
an average volume of litter overall. However, the area lining the Bayshore Route of the Shuto Expressway on the north side of Shin-Kiba Station had one of the highest concentrations of litter in the entire research area, with a high amount of discarded bento boxes and beverage containers. There was a high concentration of gum on the south side of the station area. Shin-Kiba – Basic Data Main Venue Yumenoshima Park, Tatsumi International Swimming Center, Olympic Aquatics Center (tentative name) Closest Station Shin-Kiba, Tatsumi Municipality Koto-ku Date of Research December 6, 2015 Distance Covered 10,020m Amount of Litter 0.32 items/m (9th place) Cigarette butts 0.17 items/m (11th place) Non-cigarette butts 0.15 items/m (7th place) Amount of Stuck Gum 0.31 items/m (4th place) Litter gum
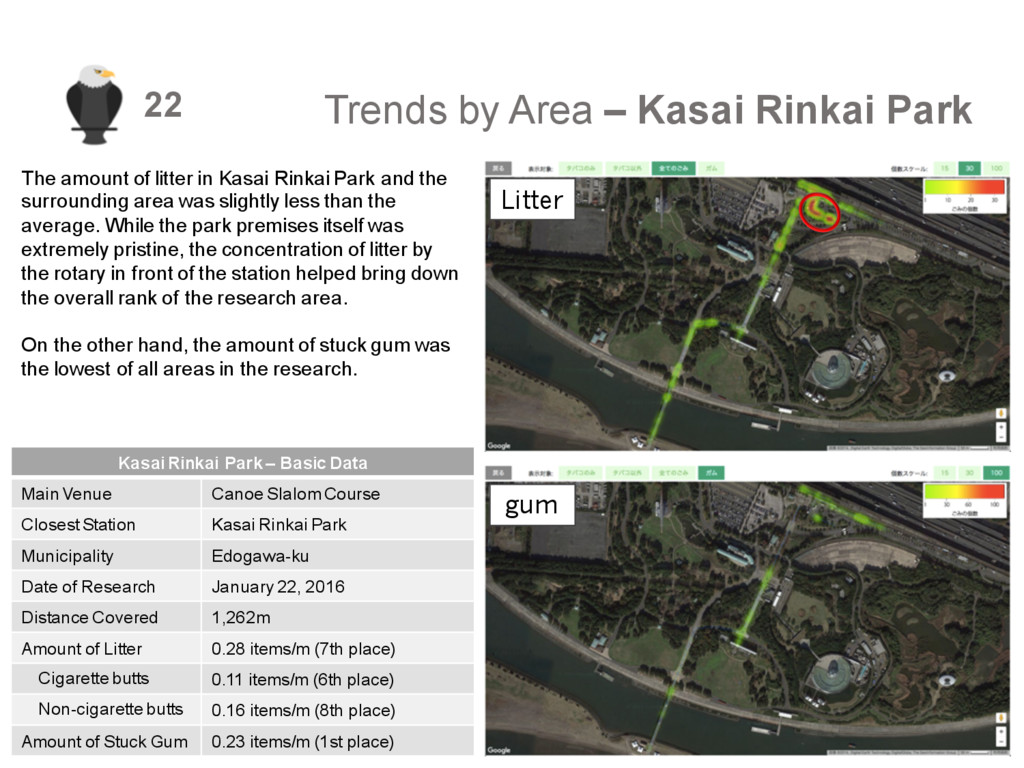
of litter in Kasai Rinkai Park and the surrounding area was slightly less than the average. While the park premises itself was extremely pristine, the concentration of litter by the rotary in front of the station helped bring down the overall rank of the research area. On the other hand, the amount of stuck gum was the lowest of all areas in the research. Kasai Rinkai Park – Basic Data Main Venue Canoe Slalom Course Closest Station Kasai Rinkai Park Municipality Edogawa-ku Date of Research January 22, 2016 Distance Covered 1,262m Amount of Litter 0.28 items/m (7th place) Cigarette butts 0.11 items/m (6th place) Non-cigarette butts 0.16 items/m (8th place) Amount of Stuck Gum 0.23 items/m (1st place) Litter gum
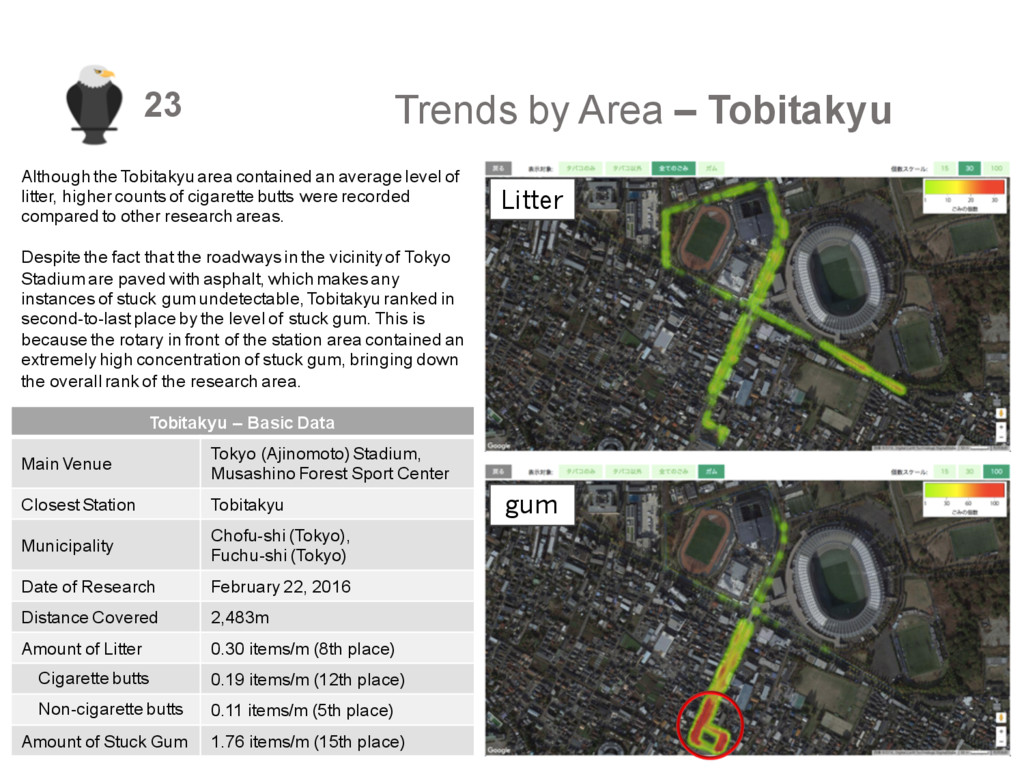
contained an average level of litter, higher counts of cigarette butts were recorded compared to other research areas. Despite the fact that the roadways in the vicinity of Tokyo Stadium are paved with asphalt, which makes any instances of stuck gum undetectable, Tobitakyu ranked in second-to-last place by the level of stuck gum. This is because the rotary in front of the station area contained an extremely high concentration of stuck gum, bringing down the overall rank of the research area. Tobitakyu – Basic Data Main Venue Tokyo (Ajinomoto) Stadium, Musashino Forest Sport Center Closest Station Tobitakyu Municipality Chofu-shi (Tokyo), Fuchu-shi (Tokyo) Date of Research February 22, 2016 Distance Covered 2,483m Amount of Litter 0.30 items/m (8th place) Cigarette butts 0.19 items/m (12th place) Non-cigarette butts 0.11 items/m (5th place) Amount of Stuck Gum 1.76 items/m (15th place) Litter gum
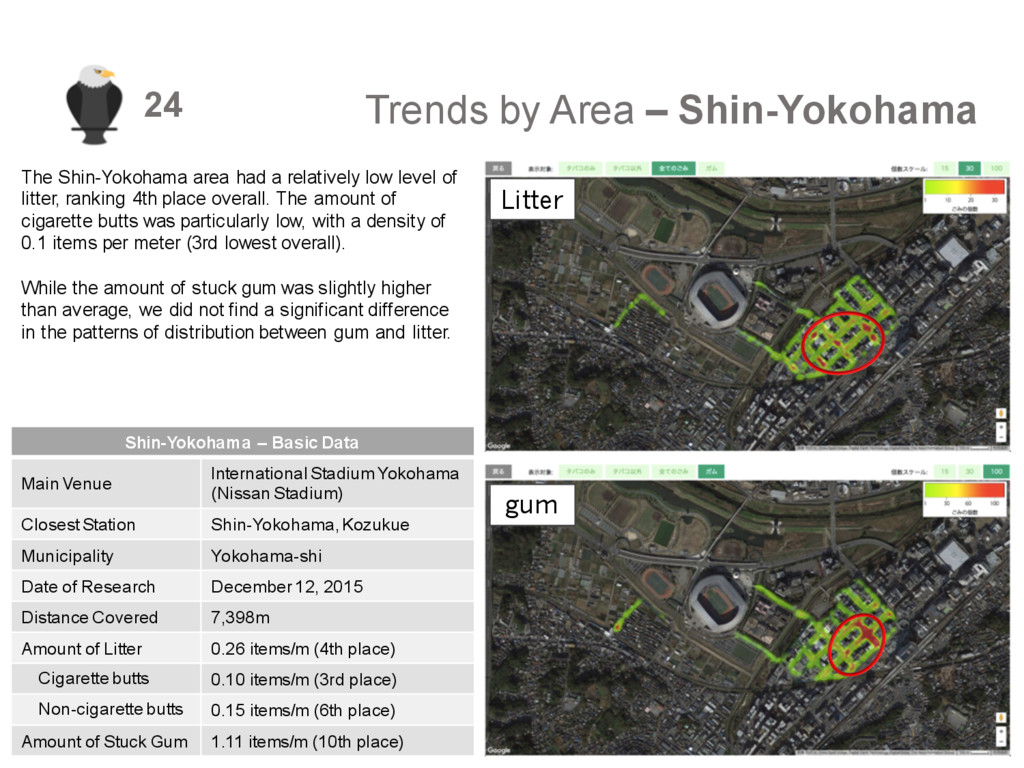
a relatively low level of litter, ranking 4th place overall. The amount of cigarette butts was particularly low, with a density of 0.1 items per meter (3rd lowest overall). While the amount of stuck gum was slightly higher than average, we did not find a significant difference in the patterns of distribution between gum and litter. Shin-Yokohama – Basic Data Main Venue International Stadium Yokohama (Nissan Stadium) Closest Station Shin-Yokohama, Kozukue Municipality Yokohama-shi Date of Research December 12, 2015 Distance Covered 7,398m Amount of Litter 0.26 items/m (4th place) Cigarette butts 0.10 items/m (3rd place) Non-cigarette butts 0.15 items/m (6th place) Amount of Stuck Gum 1.11 items/m (10th place) Litter gum
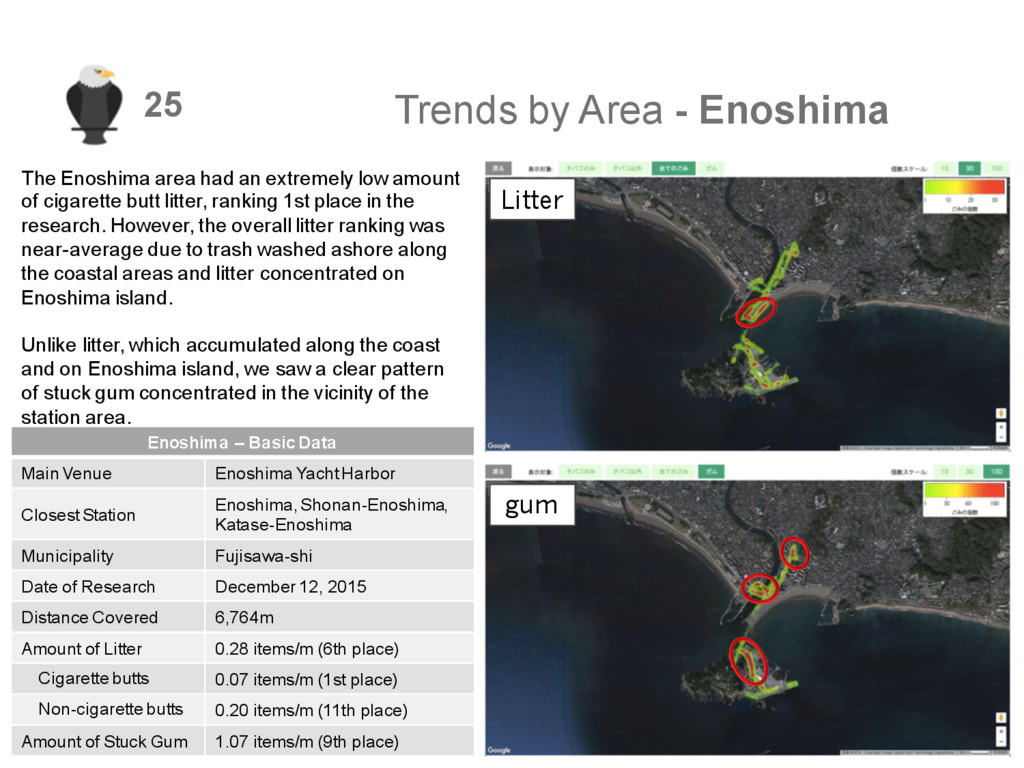
an extremely low amount of cigarette butt litter, ranking 1st place in the research. However, the overall litter ranking was near-average due to trash washed ashore along the coastal areas and litter concentrated on Enoshima island. Unlike litter, which accumulated along the coast and on Enoshima island, we saw a clear pattern of stuck gum concentrated in the vicinity of the station area. Enoshima – Basic Data Main Venue Enoshima Yacht Harbor Closest Station Enoshima,Shonan-Enoshima, Katase-Enoshima Municipality Fujisawa-shi Date of Research December 12, 2015 Distance Covered 6,764m Amount of Litter 0.28 items/m (6th place) Cigarette butts 0.07 items/m (1st place) Non-cigarette butts 0.20 items/m (11th place) Amount of Stuck Gum 1.07 items/m (9th place) Litter gum
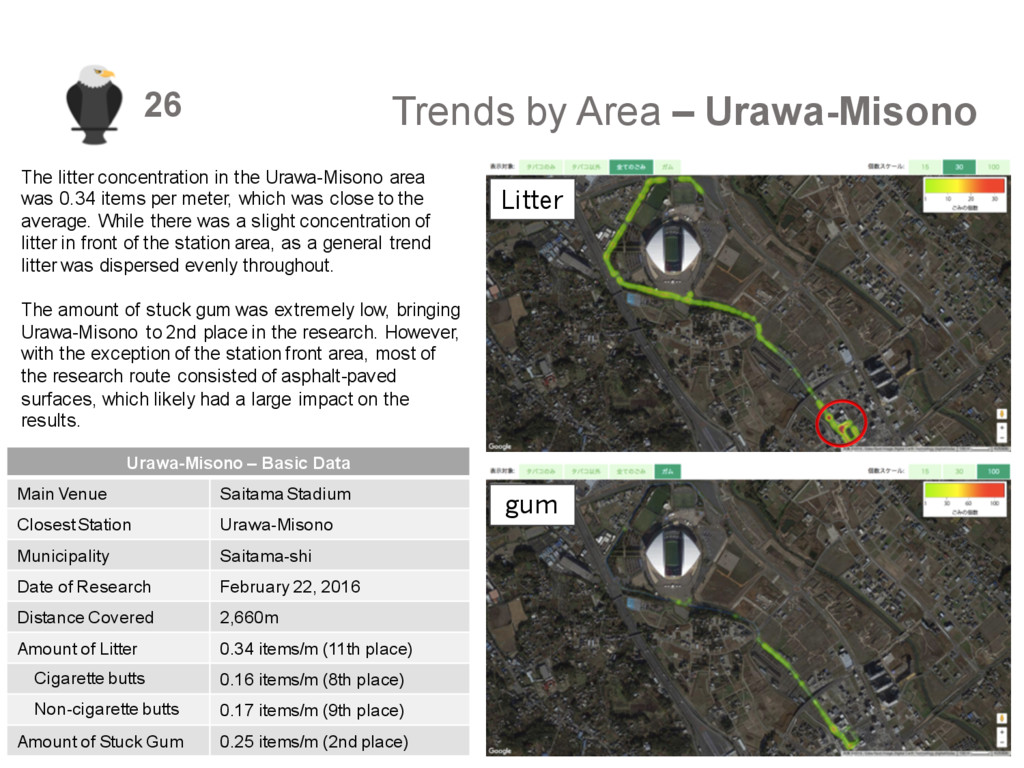
the Urawa-Misono area was 0.34 items per meter, which was close to the average. While there was a slight concentration of litter in front of the station area, as a general trend litter was dispersed evenly throughout. The amount of stuck gum was extremely low, bringing Urawa-Misono to 2nd place in the research. However, with the exception of the station front area, most of the research route consisted of asphalt-paved surfaces, which likely had a large impact on the results. Urawa-Misono – Basic Data Main Venue Saitama Stadium Closest Station Urawa-Misono Municipality Saitama-shi Date of Research February 22, 2016 Distance Covered 2,660m Amount of Litter 0.34 items/m (11th place) Cigarette butts 0.16 items/m (8th place) Non-cigarette butts 0.17 items/m (9th place) Amount of Stuck Gum 0.25 items/m (2nd place) Litter gum
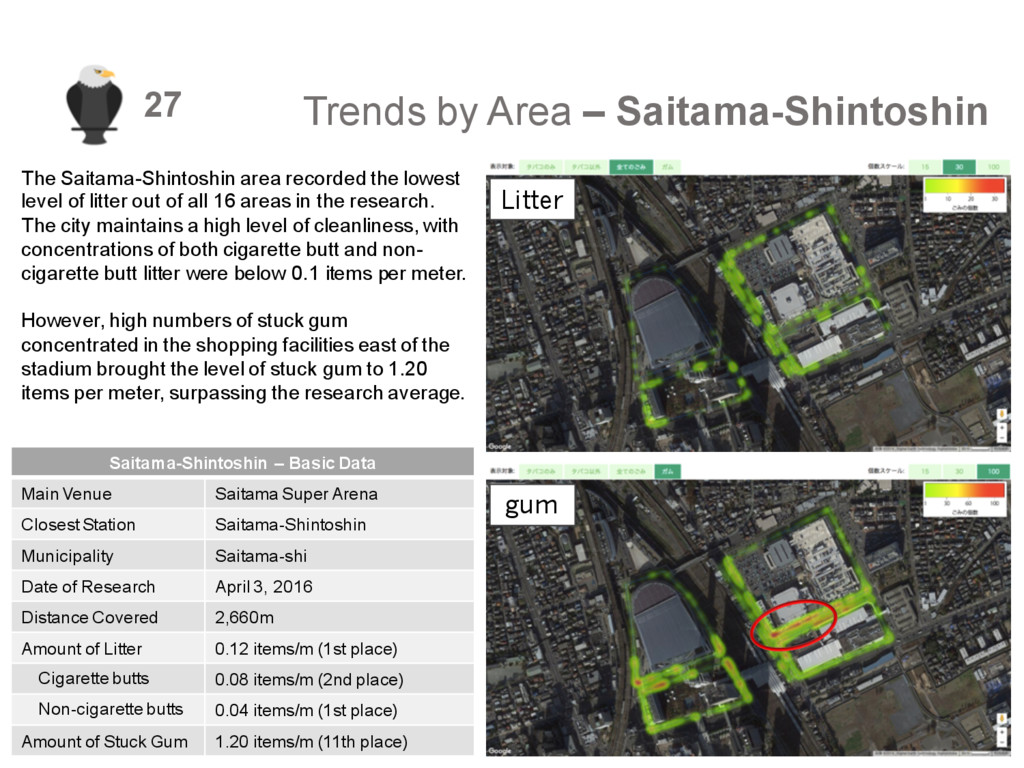
Main Venue Saitama Super Arena Closest Station Saitama-Shintoshin Municipality Saitama-shi Date of Research April 3, 2016 Distance Covered 2,660m Amount of Litter 0.12 items/m (1st place) Cigarette butts 0.08 items/m (2nd place) Non-cigarette butts 0.04 items/m (1st place) Amount of Stuck Gum 1.20 items/m (11th place) The Saitama-Shintoshin area recorded the lowest level of litter out of all 16 areas in the research. The city maintains a high level of cleanliness, with concentrations of both cigarette butt and non- cigarette butt litter were below 0.1 items per meter. However, high numbers of stuck gum concentrated in the shopping facilities east of the stadium brought the level of stuck gum to 1.20 items per meter, surpassing the research average. Litter gum
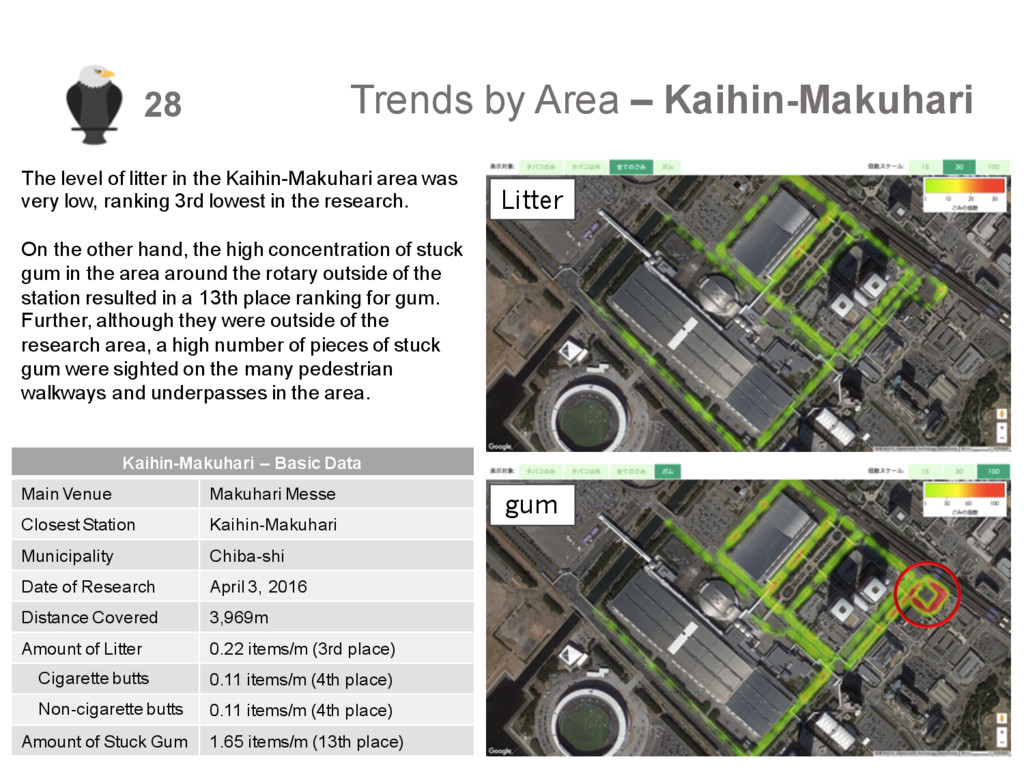
in the Kaihin-Makuhari area was very low, ranking 3rd lowest in the research. On the other hand, the high concentration of stuck gum in the area around the rotary outside of the station resulted in a 13th place ranking for gum. Further, although they were outside of the research area, a high number of pieces of stuck gum were sighted on the many pedestrian walkways and underpasses in the area. Kaihin-Makuhari – Basic Data Main Venue Makuhari Messe Closest Station Kaihin-Makuhari Municipality Chiba-shi Date of Research April 3, 2016 Distance Covered 3,969m Amount of Litter 0.22 items/m (3rd place) Cigarette butts 0.11 items/m (4th place) Non-cigarette butts 0.11 items/m (4th place) Amount of Stuck Gum 1.65 items/m (13th place) Litter gum
instances of litter in the research Paper trash was the second most common type of item (34.5%) Beverage containers (cans, glass and plastic bottles) (1.67%) § Note: Due to beverage containers’ large size, they represent a higher share by volume § The number of pieces of stuck gum was 2.62 times higher than the number of items of litter § Note: Results could change by taking account of undetectable items such as litter in bushes or ditches, or stuck gum on asphalt. § Litter tended to accumulate in parking lots, vacant land and underneath overpasses. § Stuck gum tended to concentrate in high-traffic areas such as station front areas. Litter tended to be dispersed throughout. (Although it is plausible that litter also tends to accumulate in high- traffic areas, those areas are more frequently served by street cleaning. However, street cleaning is less effective at collecting stuck gum, which explains the high concentration of gum in high-traffic areas.) 29
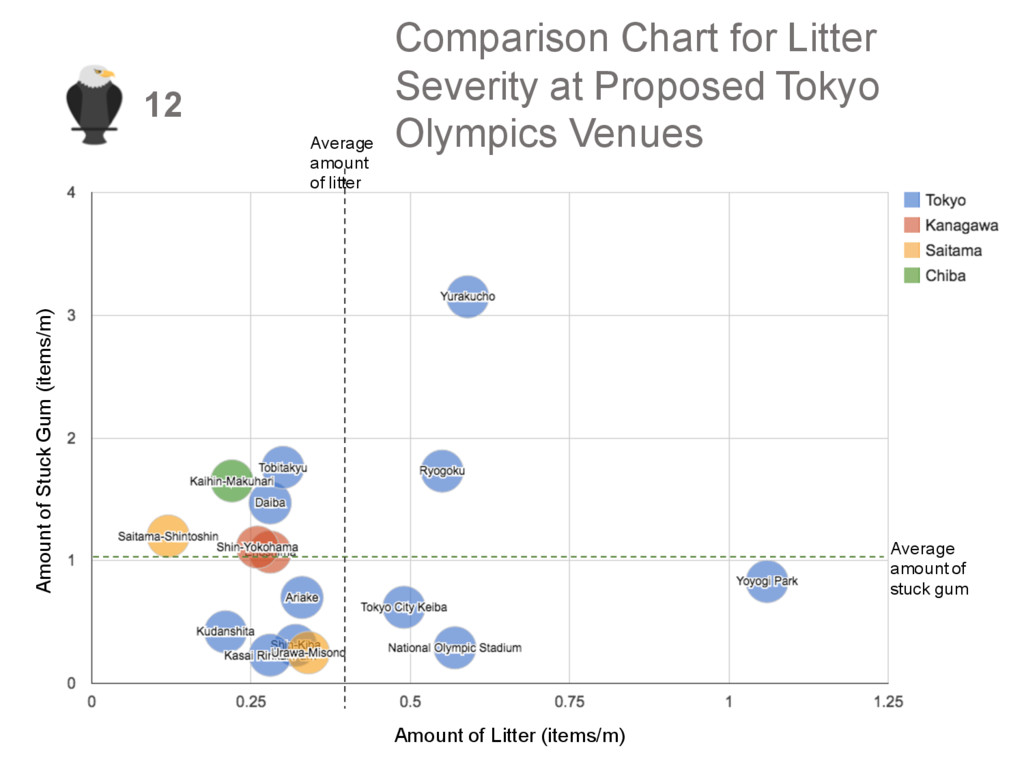
areas in our research were found to be sufficiently clean, overall, there is room for improvement. In particular, in Yoyogi Park, Kokuritsu-Kyogijo, Yurakucho and Ryogoku, a severe litter problem exists over widespread areas, which has a significant adverse impact on the landscape. § Next Steps In collaboration with local governments in each area, we will conduct research on a continuing basis and evaluate the effectiveness of beautification projects. We will implement improvement measures in locations with particularly severe litter problems. We will find and develop plans and urban designs that effectively limit litter, and extend these methods to other regions. By making the results of our research and data public, we will actively contribute to research on littering and urban planning. Our efforts will continue beyond 2020, and we will work to promote Tokyo’s reputation as the ultimate urban environment in the world. This will help strengthen tourism, improve livability, and provide a model for beautification measures in other cities around the world. 30
Gumclean Company Ltd. http://www.gumclean.co.jp/ 31 We conducted this project with the financial support and sponsorship from the organizations listed below. We are grateful for their cooperation and support.
this project… THE ANOTHER PROJECT (NPO) Toranomon KT Bldg 2F, 5-11-15 Toranomon, Minato-ku, Tokyo http://another-project.com/ § For inquiries related to research methodology and data… Pirika, Inc. 3-5-7 Ebisu Minami, Shibuya-ku, Tokyo http://www.pirika.org/ [email protected] +81-50-5582-5878 32