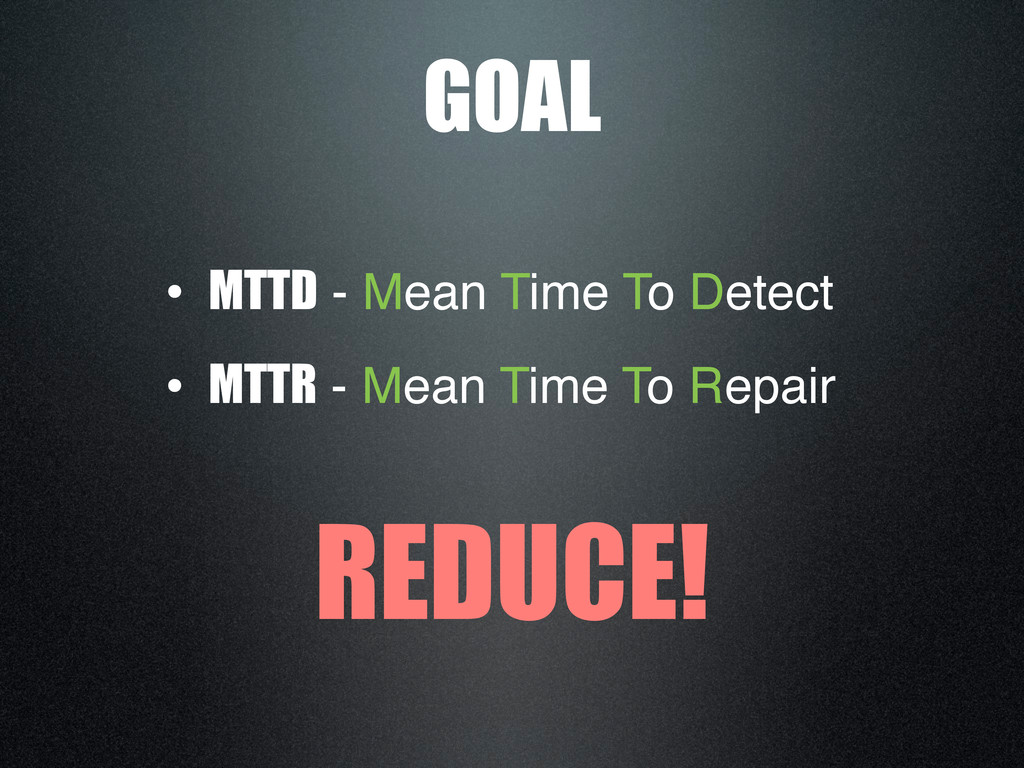
A Polyglot Vancouver presentation on application & infrastructure monitoring. Reducing MTTD/R, instrumentation, log streams, dependency chains/relationships, tools, and a demo.
I have uploaded the source for others to use, just be sure to give me a mention :) http://portertech.s3.amazonaws.com/monitoring_slides.tar.gz
![(fn [request] (let [start (System/currentTimeMillis) response (handler request) finish (System/currentTimeMillis)](https://files.speakerdeck.com/presentations/50469587c413ff0002007563/slide_14.jpg)