working on LA • Our use-case of interpreter-mediated communication training • The synergy of Visual Analytics (VA) and LA • Future directions and recommendations
of scientific inquiry the last decades. • Physics, environmental sciences and biology use analytics for some time – education/learning sciences have done so only recently: e.g., Computers in Biology and Medicine – 1970 vs Journal of Educational Data Mining – 2009 • When applied to education these methodologies are referred to as learning analytics (LA), academic analytics and educational data mining (EDM) – (similar but essentially different!). • The field of LA has been emerging, over last decade, but has gained significant attention and momentum in the last three years. Baker, R., and Siemens, G., "Educational data mining and learning analytics." Cambridge Handbook of the Learning Sciences: (2014).
definition of LA appeared in the call for papers of the first International Conference on Learning Analytics and Knowledge (LAK 2011) and was adopted by the Society of Learning Analytics Research (SOLAR): Learning analytics is the measurement, collection, analysis and reporting of data about learners and their contexts, for purposes of understanding and optimising learning and the environments in which it occurs Siemens G., Long P, Penetrating the fog: Analytics in learning and education. Educause Review 46, 5 (2011) • Academic Analytics addresses a mix of administrative and learning analytics (BI in academia) • EDM is concerned with developing methods for exploring the unique types of data that come from educational settings and using those methods to better understand students, and the settings which they learn in
data, has the potential to depict underlying factors that affect the learning and teaching processes and allow us to improve them. • The dynamic analysis and visualization of the data can also help students as they learn. • There has been recent substantial growth (in the education sector) in the application of business intelligence, web analytics and data mining concepts at educational institutions. Technology-Enhanced Learning (TEL) environments Learning Management Systems (LMSs) Virtual Learning Environments (VLEs) ever-increasing amount of data, (potentially) collected by educational institutions.
use of LMSs many educational institutions offer their educational material online. • Massive Open Online Courses (MOOCs) like Harvard’s and MIT’s eDX, and Standford’s Coursera, offer an unprecedented access and opportunity for people to access top-class educational programs. • Consequently, all that online activity can yield a large amount of data that can be analyzed and give the opportunity for: – better performance prediction, – increase the opportunities of intervention and – offer new levels of personalization of the teaching process.
sources and has been developing over many years through our: – experience of teaching computing science and engineering in academic and vocational environments, over many years – experience with student performance metrics and data from the perspective of various roles (e.g., Dir. Of Teaching) – collaboration since 2011 with interpreting researchers for the implementation of a dedicated VLEs for the simulation and training of interpreter-mediated communications
The rise of migration and multilingualism in Europe requires professional interpreters in business, legal, medical and many other settings. • Future interpreters therefore need to master an ever broadening range of interpreting scenarios and skills. • This is difficult to achieve with traditional teaching methods and in times of reduced teaching contact hours. • Also, a client-side understanding of what working with an interpreter involves is crucial, but efforts to educate potential clients of interpreters are scarce and normally separate from interpreter education.
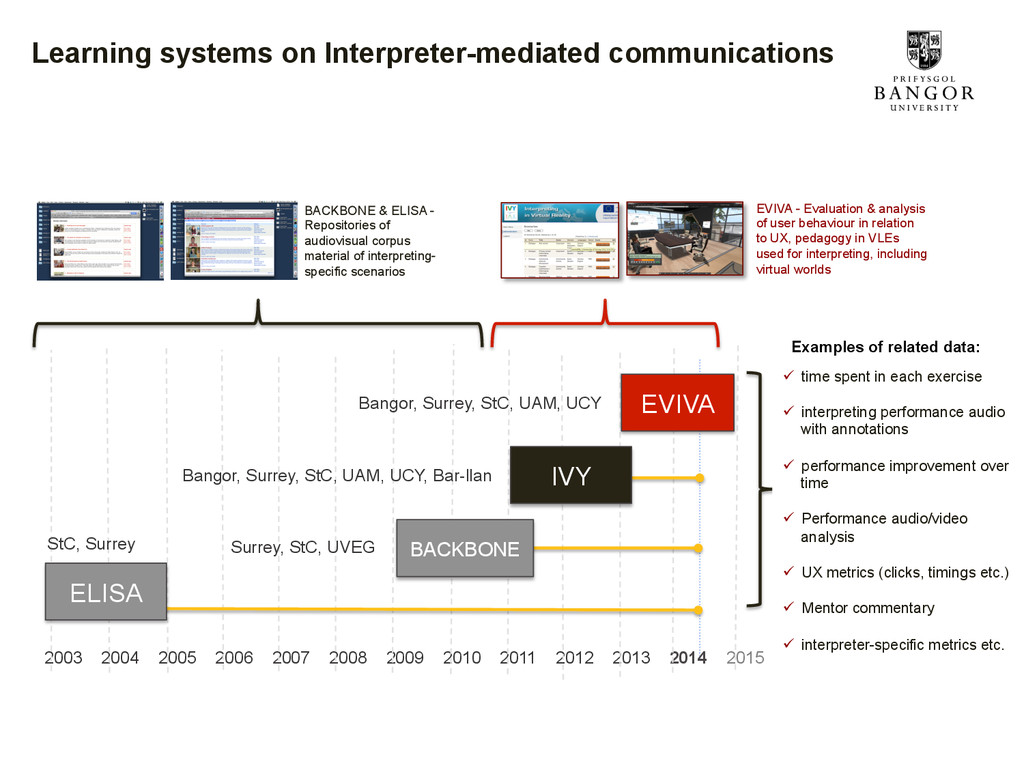
2008 2009 2010 2011 2012 2013 2014 2015 EVIVA StC, Surrey Surrey, StC, UVEG Bangor, Surrey, StC, UAM, UCY, Bar-llan Bangor, Surrey, StC, UAM, UCY ELISA BACKBONE IVY EVIVA - Evaluation & analysis of user behaviour in relation to UX, pedagogy in VLEs used for interpreting, including virtual worlds BACKBONE & ELISA - Repositories of audiovisual corpus material of interpreting- specific scenarios ü time spent in each exercise ü interpreting performance audio with annotations ü performance improvement over time ü Performance audio/video analysis ü UX metrics (clicks, timings etc.) ü Mentor commentary ü interpreter-specific metrics etc. Examples of related data:
learning tools do utilize several visualization types, these mostly are ``traditional’’ styles, i.e., bar charts, line graphs, scatterplots or sparklines. • They are also predominantly static by nature, and afford little interaction. • These visualizations typically represent simple statistical information such as grades from tests, dials to illustrate user-load, line-graphs of user logins etc • Visualization and VA can transform LA; it has potential to go beyond mere analysis. • The VA community has extensive experience in non-traditional visualization types and can offer novel ways of data exploration • There are therefore challenges and opportunities for VA researchers to provide more informative visualizations, new interaction methodologies, better ways to manipulate data, and, ultimately, provide value for teachers and learners.
moral and educational practice, resulting in more successful learning. • However, a series of important implications arise in terms of usage ethics, privacy and access. • These are implications also often encountered in VA systems, where real data are concerned. • For instance, questions such as: – what type of data a learning system collects – how the data leads to genuine insights about a learner’s performance – who controls and owns the data – who can access it – and where it is stored …require careful consideration. Slade S., Prinsloo P.: Learning analytics ethical issues and dilemmas. American Behavioral Scientist 57, 10 (2013), 1510–1529.
and to consider the issues and opportunities such and endeavour entails. • Our long-term hypotheses are as follows: – there is a need to develop tools that assist the learner throughout the whole process of learning - i.e., tools that aid and supports the learners from the very beginning when the users are novices, and help them advance into expert level – a wider range of data should be captured - from assessment and exam results, to usage statistics, attitudes and emotions. – more analytics will aid the users themselves, as they learn - they will become more active and reflective learners. Ultimately, as they become more aware of the processes of their own learning they will be more effective learners.
simple dashboards – integrating monitoring, analysis and interactive visualizations throughout various stages of the learning process. • Apply knowledge and practices from the VA domain in order to design better LA interfaces – e.g., learn from ideas in uncertainty visualization to create more informative interfaces • Utilize data from multiple users for more accurate outcomes • Integrate visualization techniques of data provenance to create more accountable learning environments • Consider how learners can be more active in their learning • Integrate new interaction modalities, like affective computing techniques, eye-tracking, tangible and haptic interfaces
We are grateful to the members of the IVY consortium, for their assistance and contributions. This work was supported by the European Commission through projects (IVY) 511862-LLP-1-2010-1-UK-KA3- KA3MP and (EVIVA) 531140-LLP-1-2012-1-UK-KA3-KA3MP in the Lifelong Learning Programme. This presentation reflects the views only of the authors, and the Commission cannot be held responsible for any use which may be made of the information contained therein.
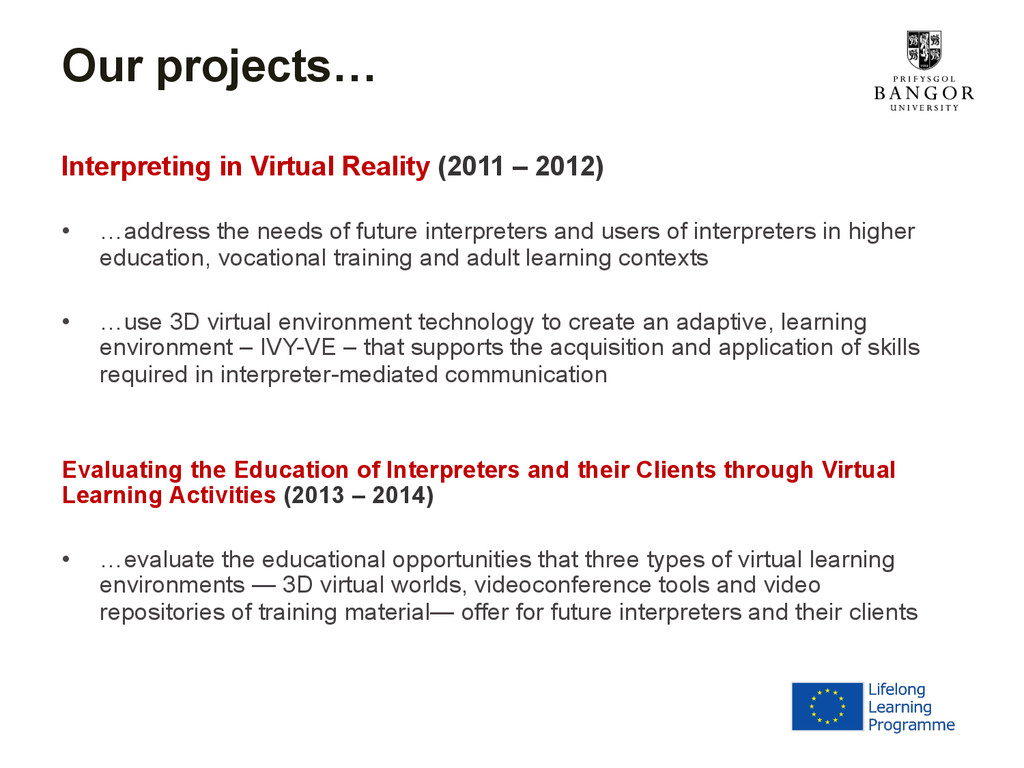
…address the needs of future interpreters and users of interpreters in higher education, vocational training and adult learning contexts • …use 3D virtual environment technology to create an adaptive, learning environment – IVY-VE – that supports the acquisition and application of skills required in interpreter-mediated communication Evaluating the Education of Interpreters and their Clients through Virtual Learning Activities (2013 – 2014) • …evaluate the educational opportunities that three types of virtual learning environments — 3D virtual worlds, videoconference tools and video repositories of training material— offer for future interpreters and their clients
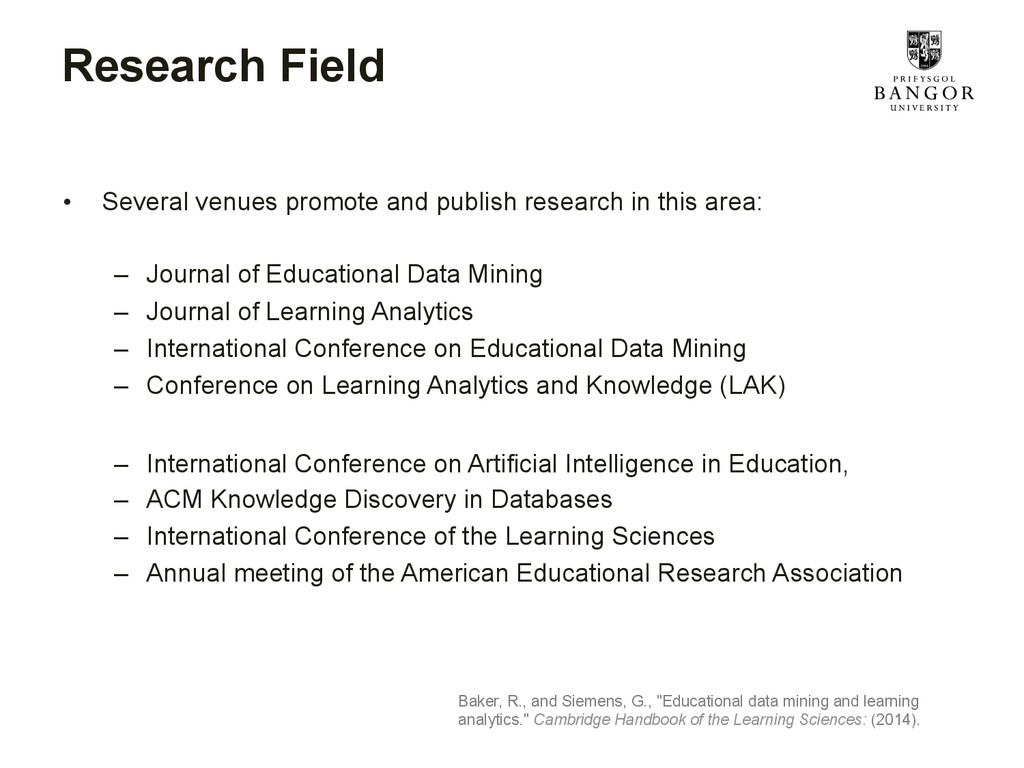
this area: – Journal of Educational Data Mining – Journal of Learning Analytics – International Conference on Educational Data Mining – Conference on Learning Analytics and Knowledge (LAK) – International Conference on Artificial Intelligence in Education, – ACM Knowledge Discovery in Databases – International Conference of the Learning Sciences – Annual meeting of the American Educational Research Association Baker, R., and Siemens, G., "Educational data mining and learning analytics." Cambridge Handbook of the Learning Sciences: (2014).