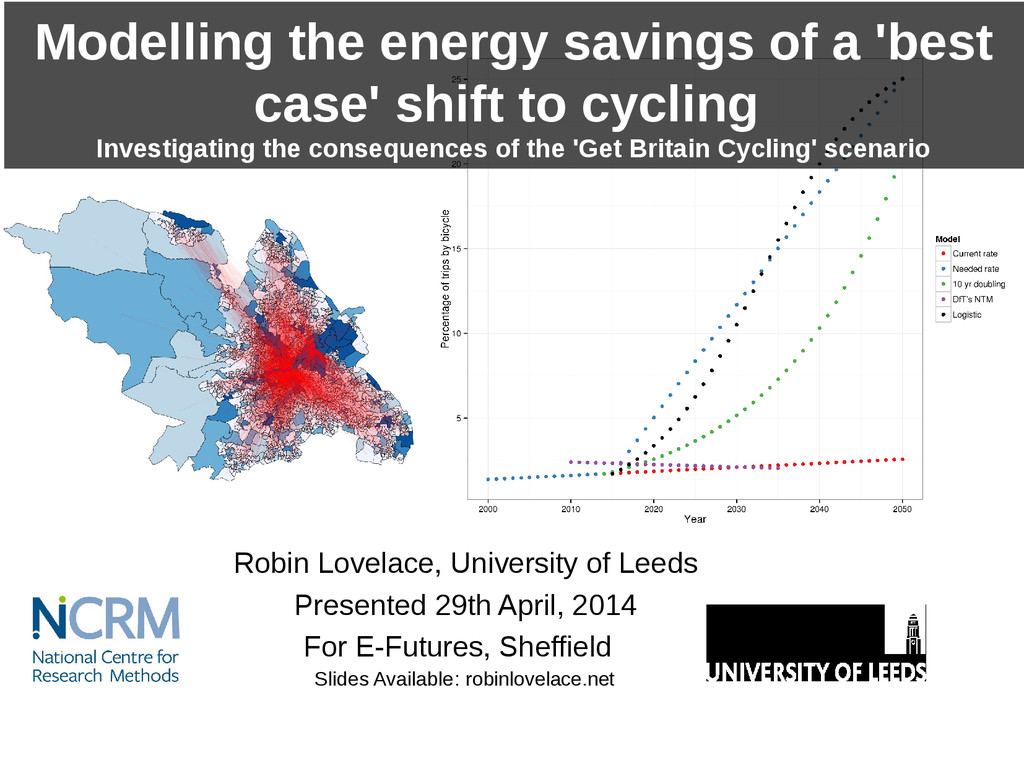
cycling Investigating the consequences of the 'Get Britain Cycling' scenario Robin Lovelace, University of Leeds Presented 29th April, 2014 For E-Futures, Sheffield Slides Available: robinlovelace.net
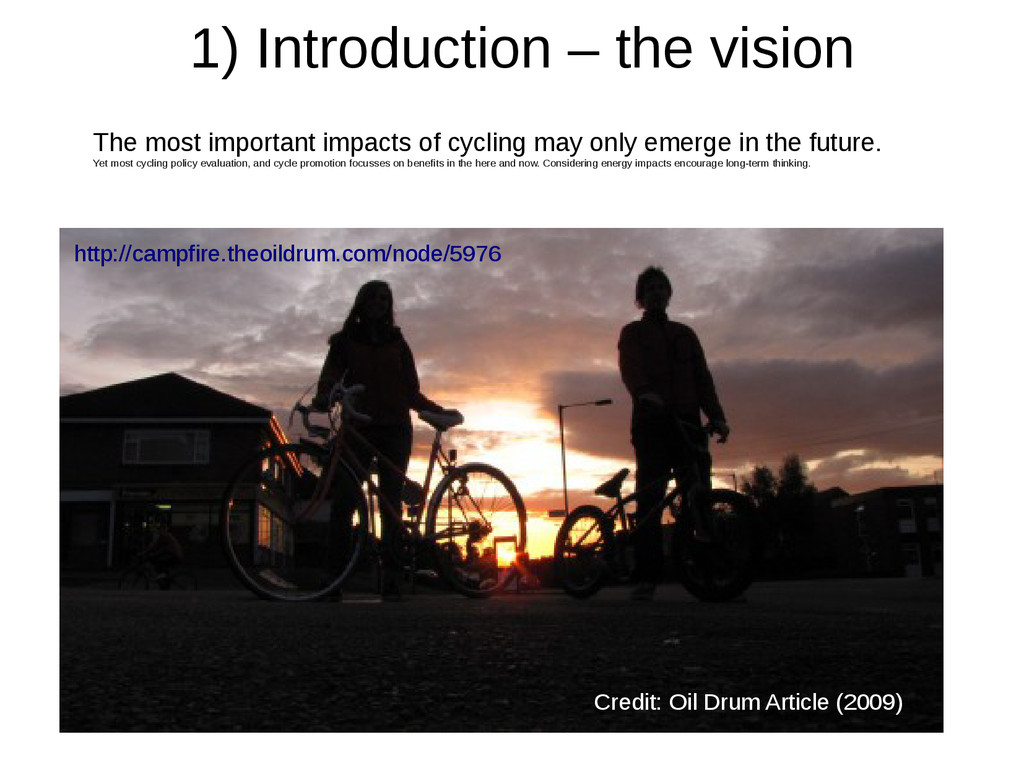
cycling may only emerge in the future. Yet most cycling policy evaluation, and cycle promotion focusses on benefits in the here and now. Considering energy impacts encourage long-term thinking. Credit: Oil Drum Article (2009) http://campfire.theoildrum.com/node/5976
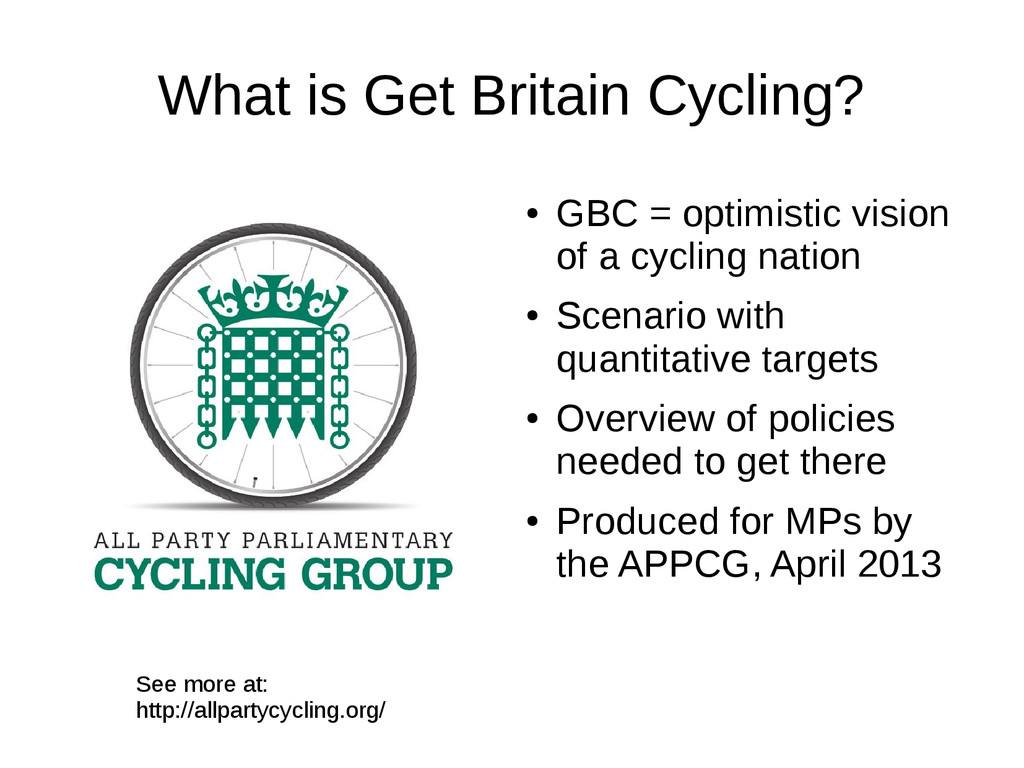
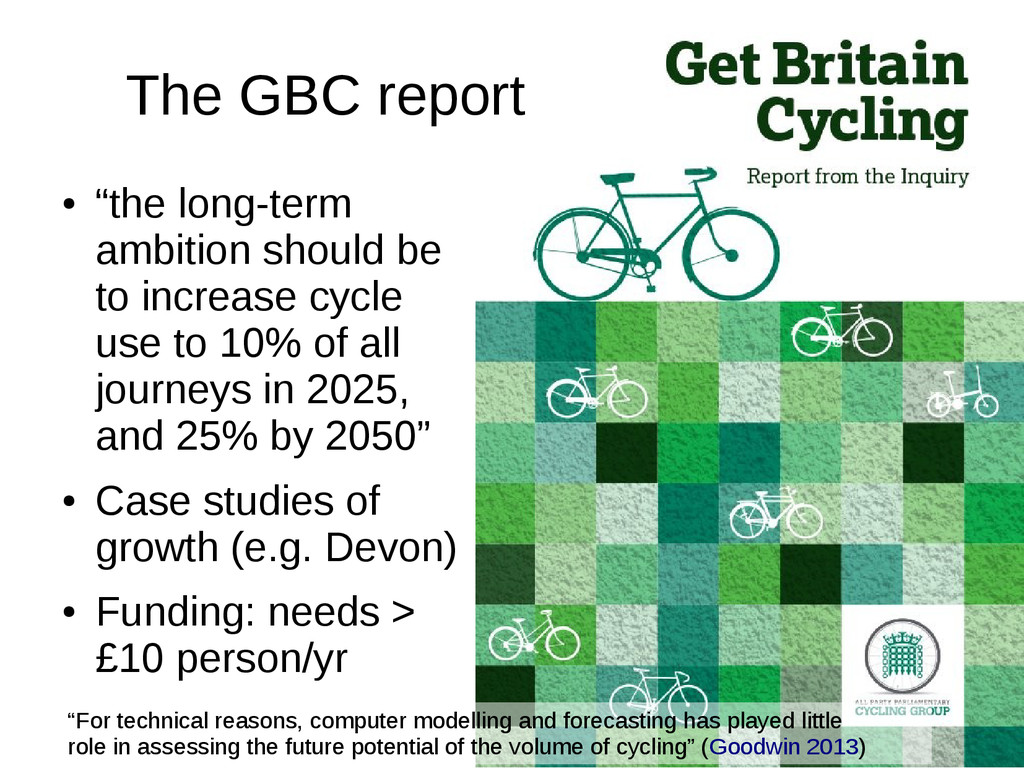
of a cycling nation • Scenario with quantitative targets • Overview of policies needed to get there • Produced for MPs by the APPCG, April 2013 See more at: http://allpartycycling.org/
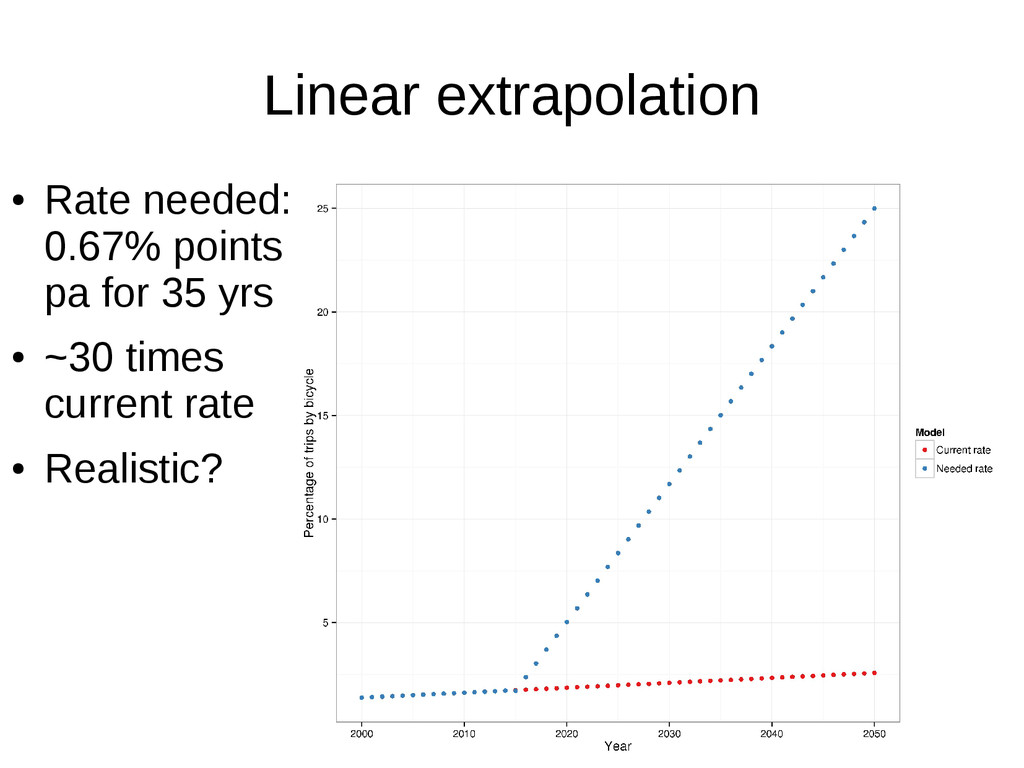
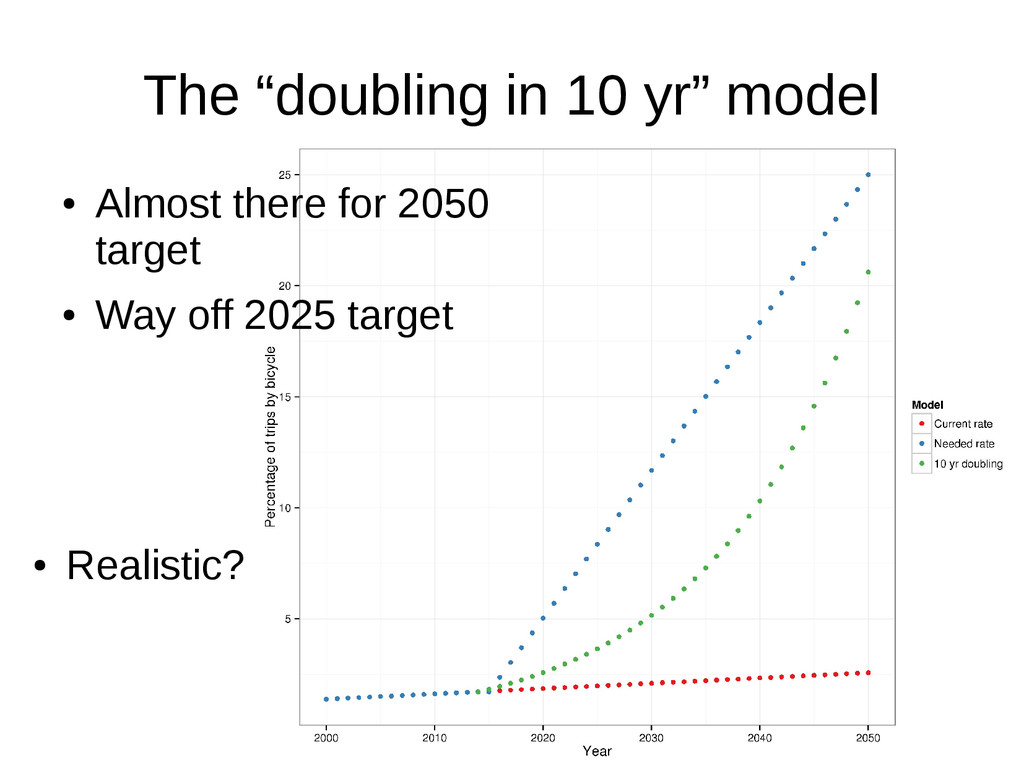
to 10% of all journeys in 2025, and 25% by 2050” • Case studies of growth (e.g. Devon) • Funding: needs > £10 person/yr The GBC report “For technical reasons, computer modelling and forecasting has played little role in assessing the future potential of the volume of cycling” (Goodwin 2013)
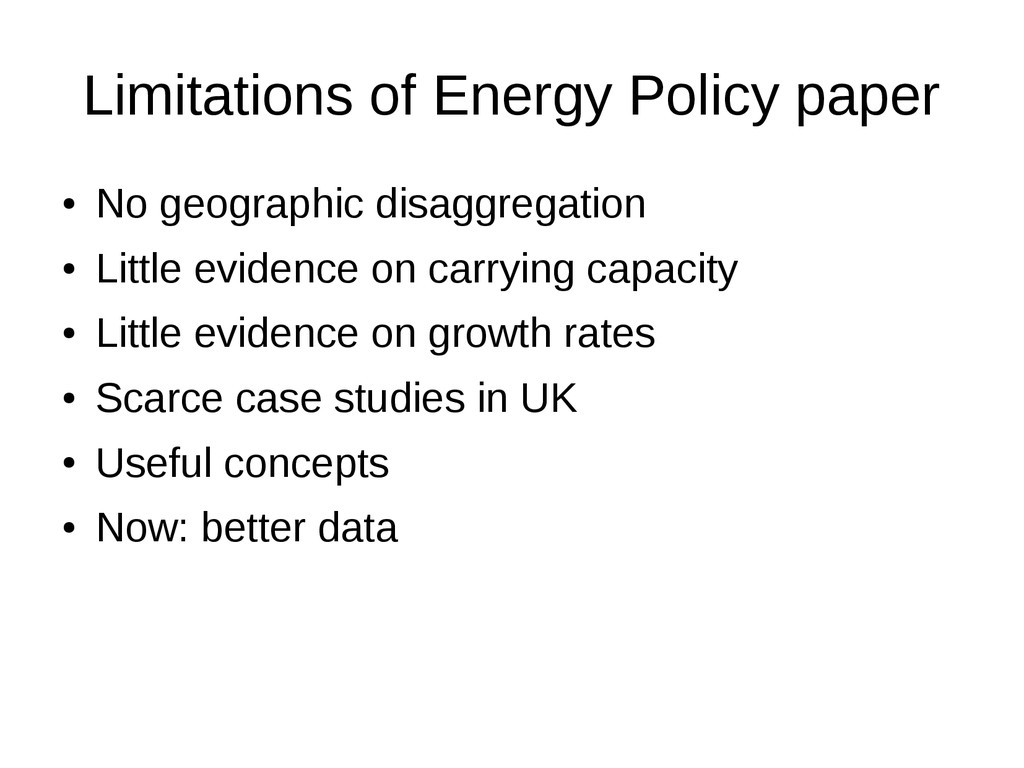
and 2050 • No geographical disaggregation of cycling uptake • Nothing on who would be cycling where, replacing which modes and for what trip types • Basically, great overview, scant on detail • So the first stage was to create scenarios
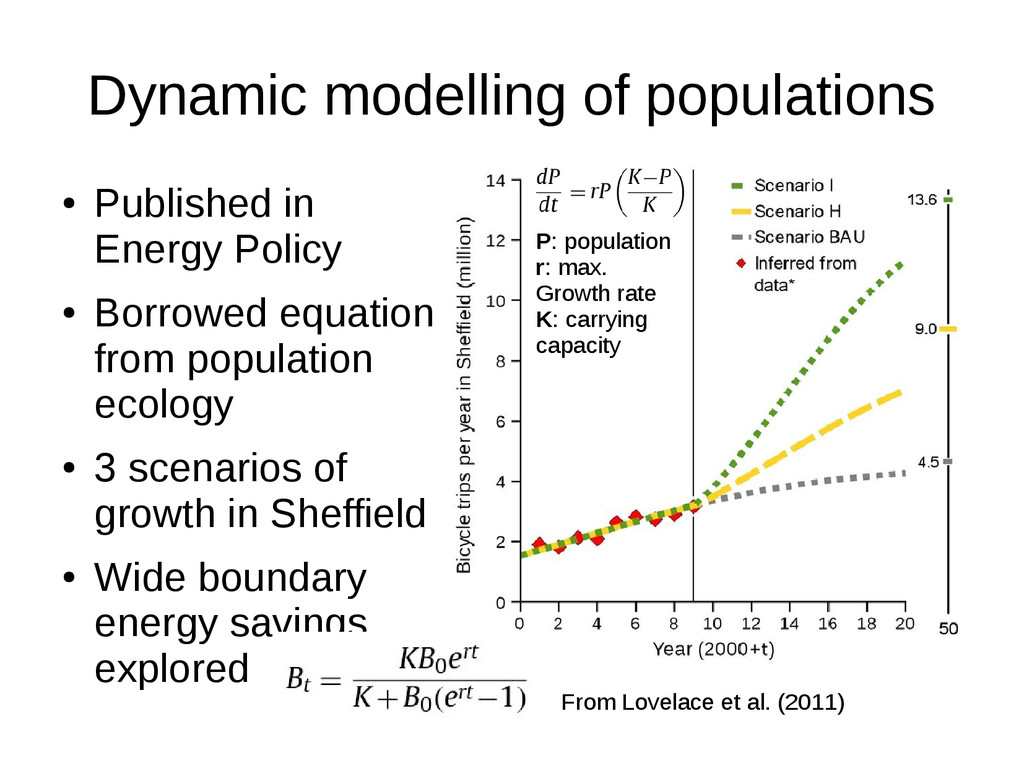
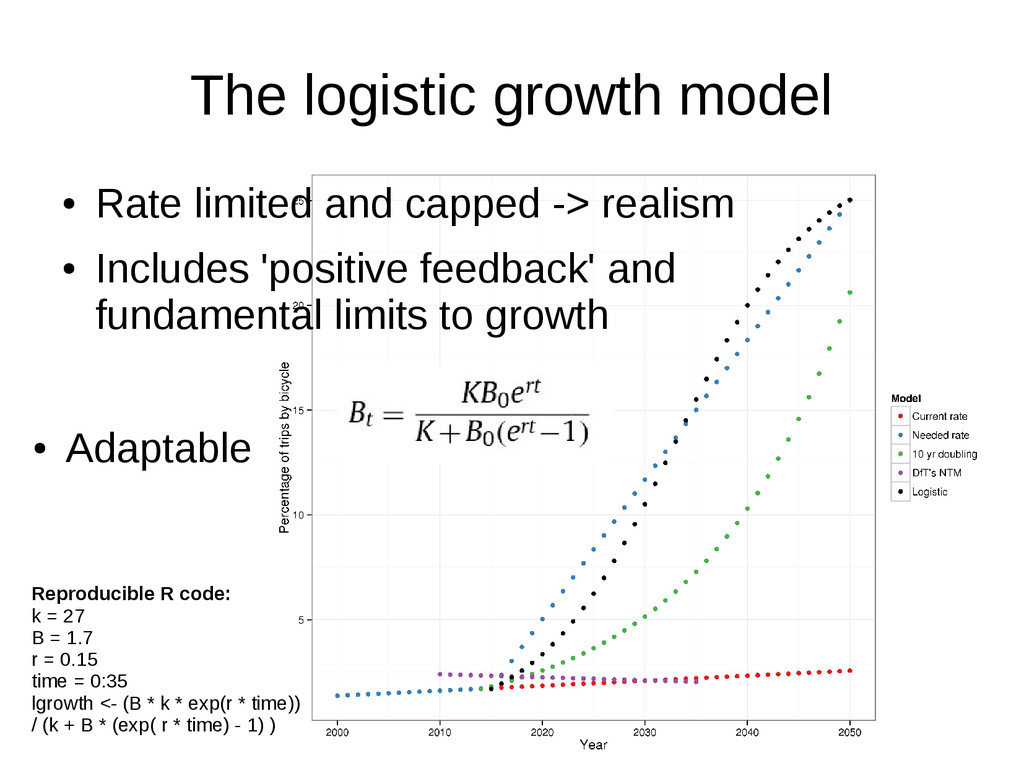
Published in Energy Policy • Borrowed equation from population ecology • 3 scenarios of growth in Sheffield • Wide boundary energy savings explored P: population r: max. Growth rate K: carrying capacity
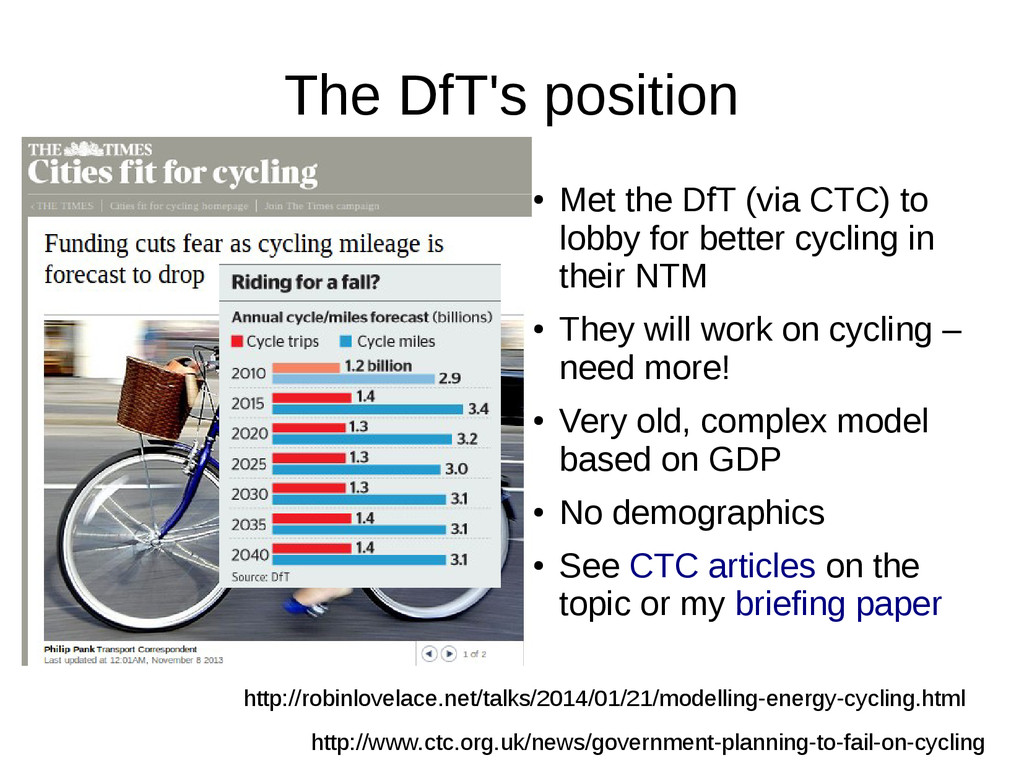
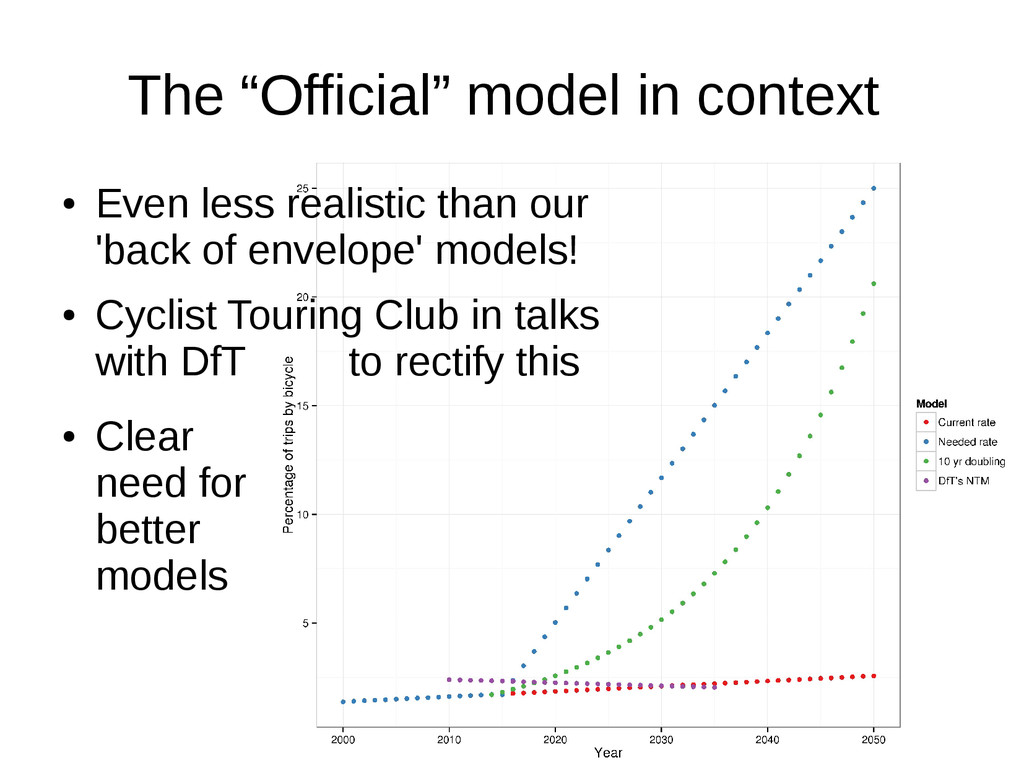
lobby for better cycling in their NTM • They will work on cycling – need more! • Very old, complex model based on GDP • No demographics • See CTC articles on the topic or my briefing paper http://www.ctc.org.uk/news/government-planning-to-fail-on-cycling http://robinlovelace.net/talks/2014/01/21/modelling-energy-cycling.html
capped -> realism • Includes 'positive feedback' and fundamental limits to growth Reproducible R code: k = 27 B = 1.7 r = 0.15 time = 0:35 lgrowth <- (B * k * exp(r * time)) / (k + B * (exp( r * time) - 1) )
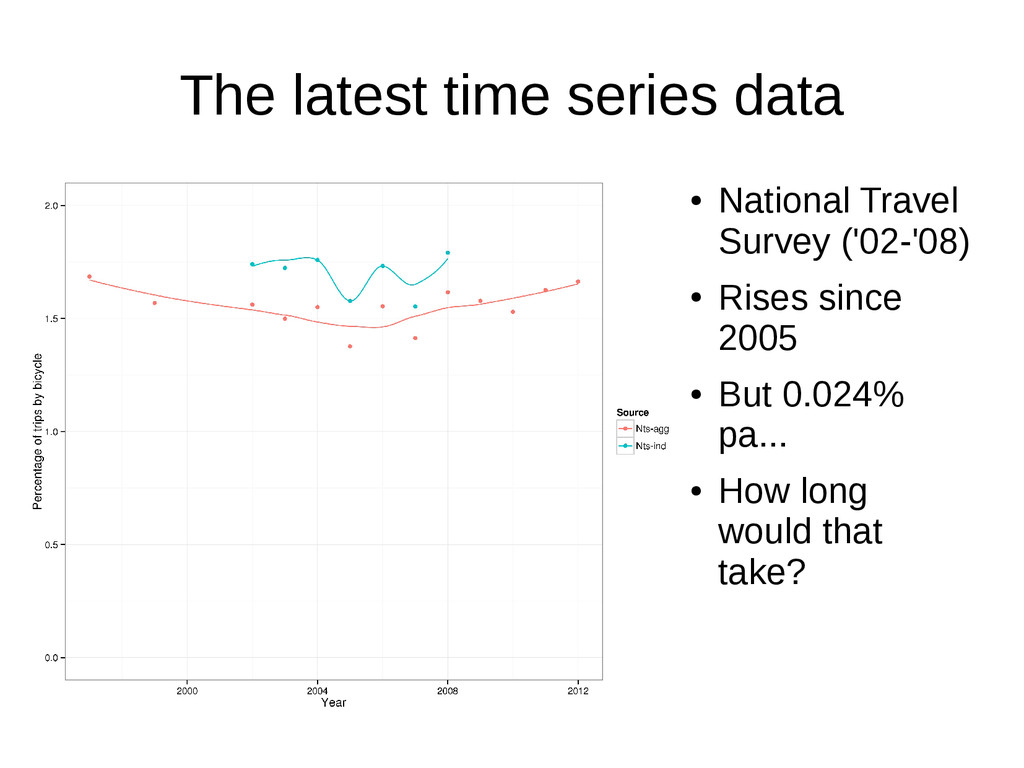
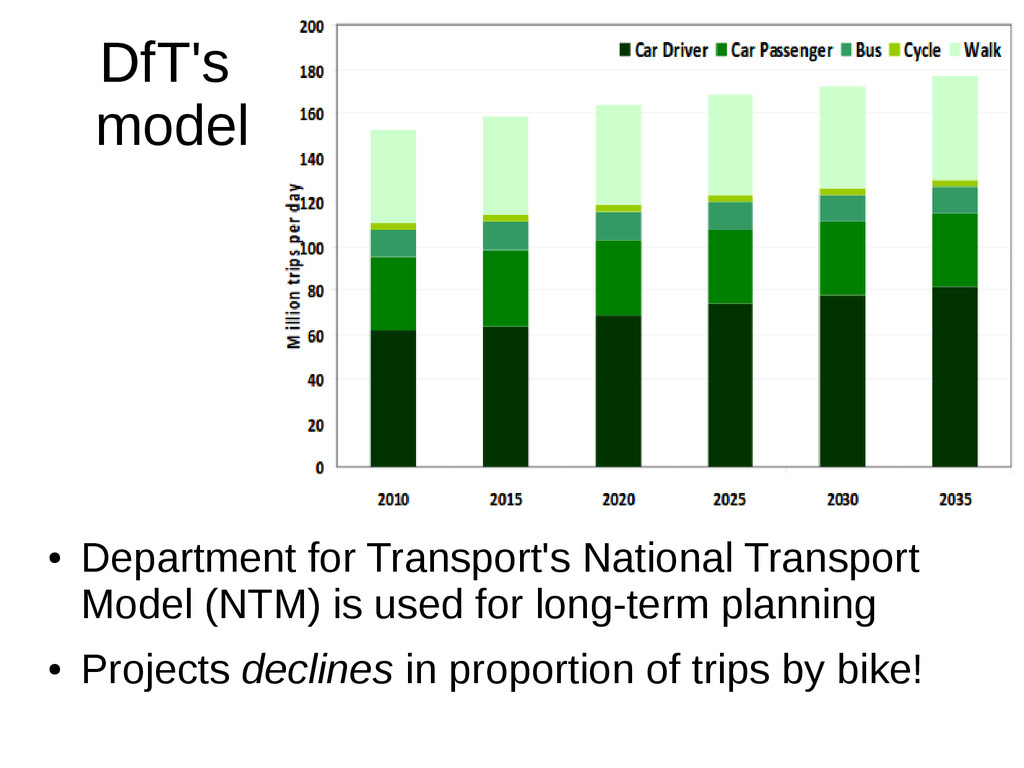
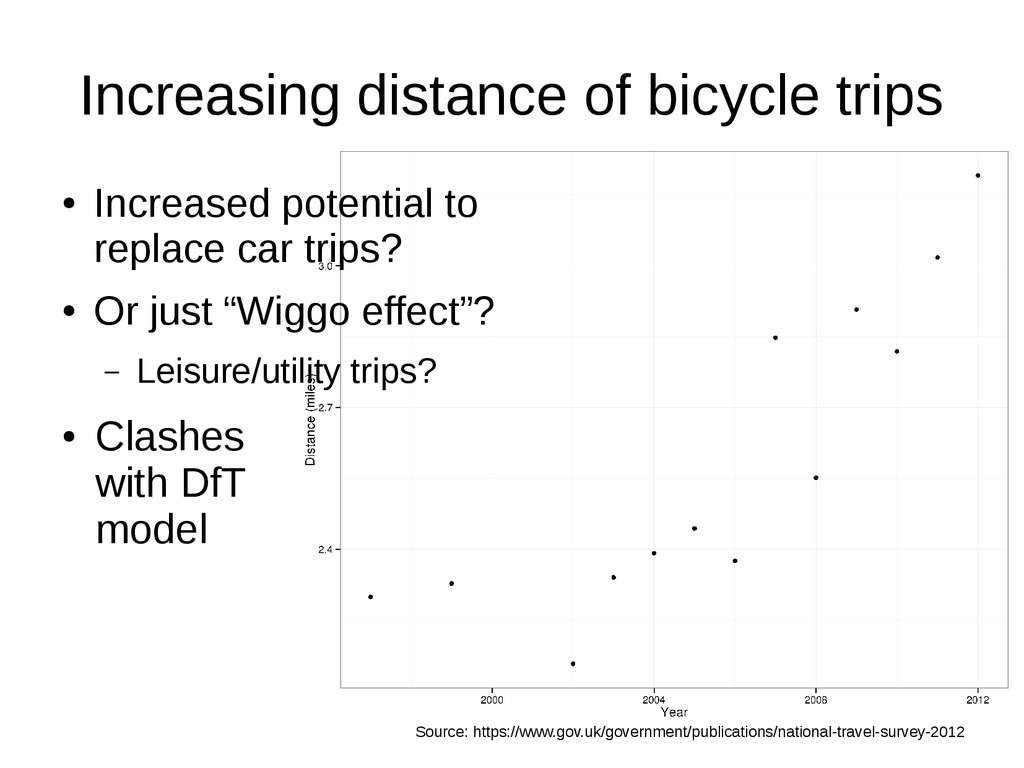
car trips? • Or just “Wiggo effect”? – Leisure/utility trips? • Clashes with DfT model Source: https://www.gov.uk/government/publications/national-travel-survey-2012
25% rush hour trips in central London are bicycles (TfL 2013) • Lack of 'dose-response' studies (we're working on it!) – Regression analysis of impact of new cycle lanes – Evaluations of organisation-level interventions Data issues
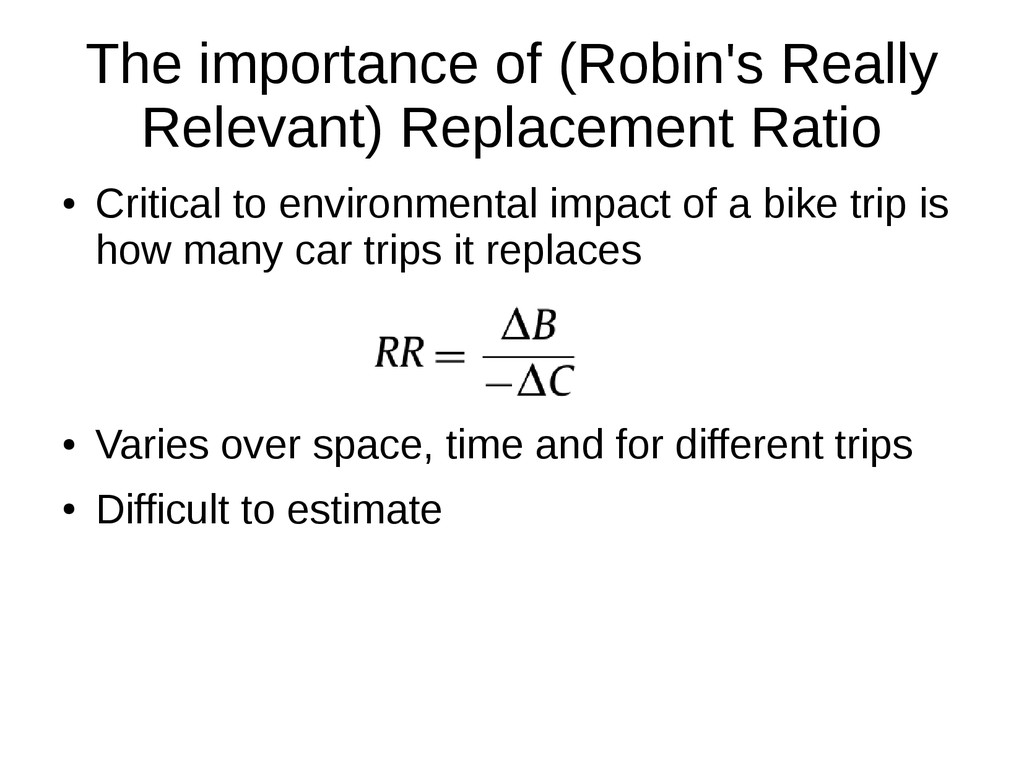
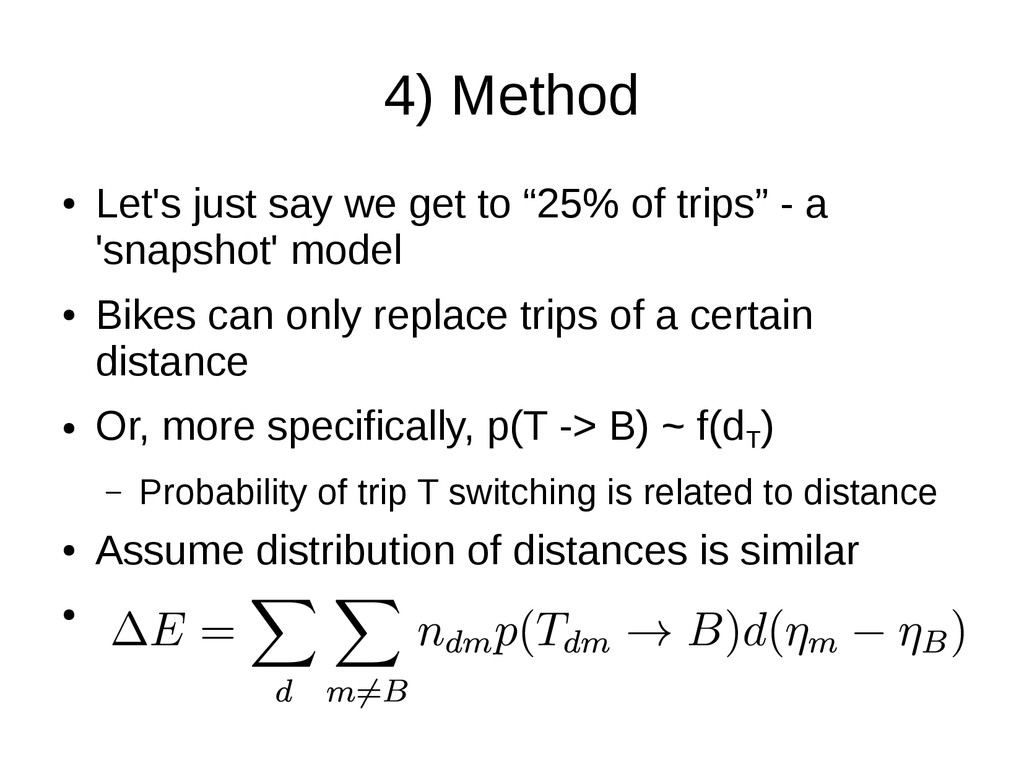
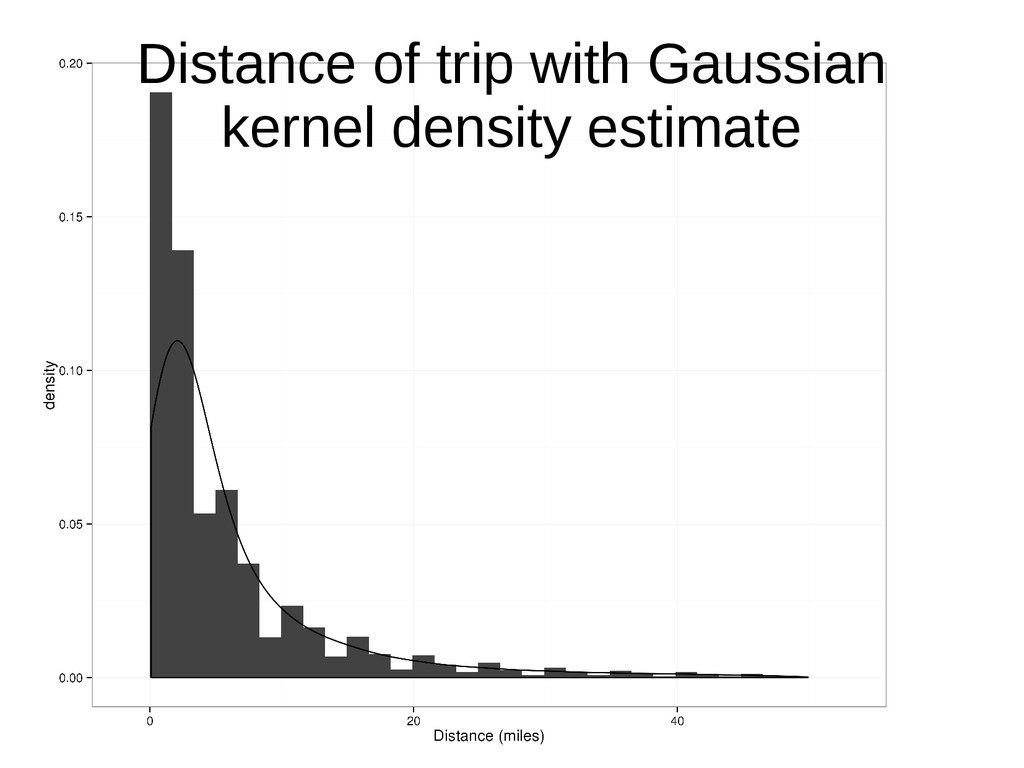
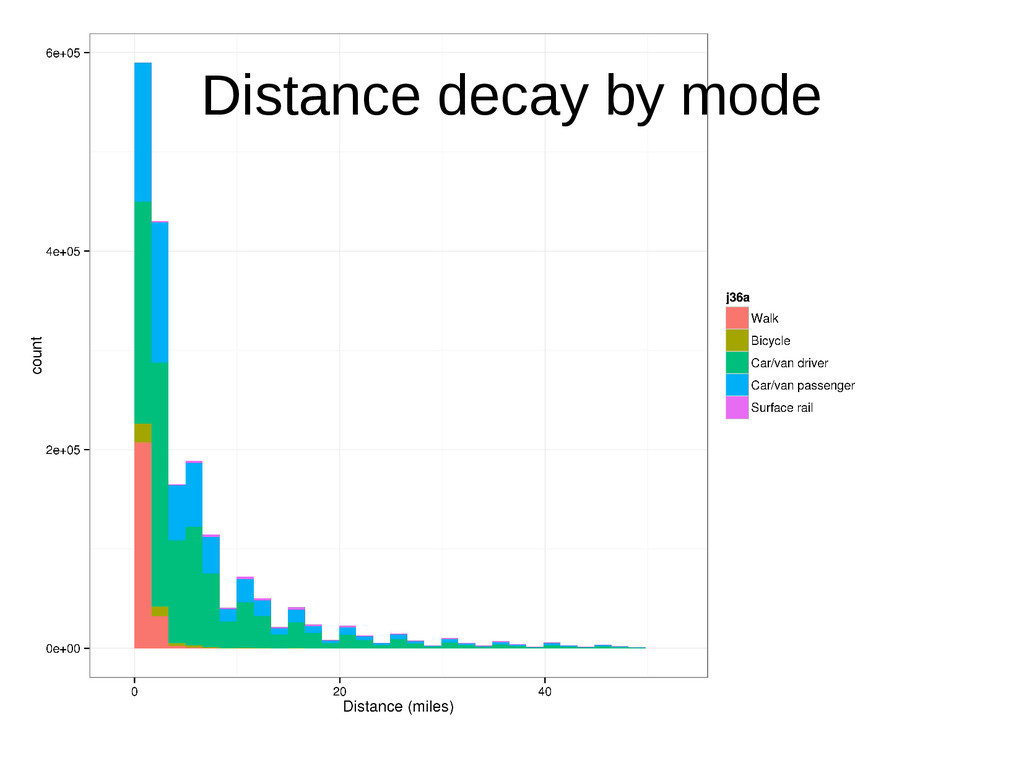
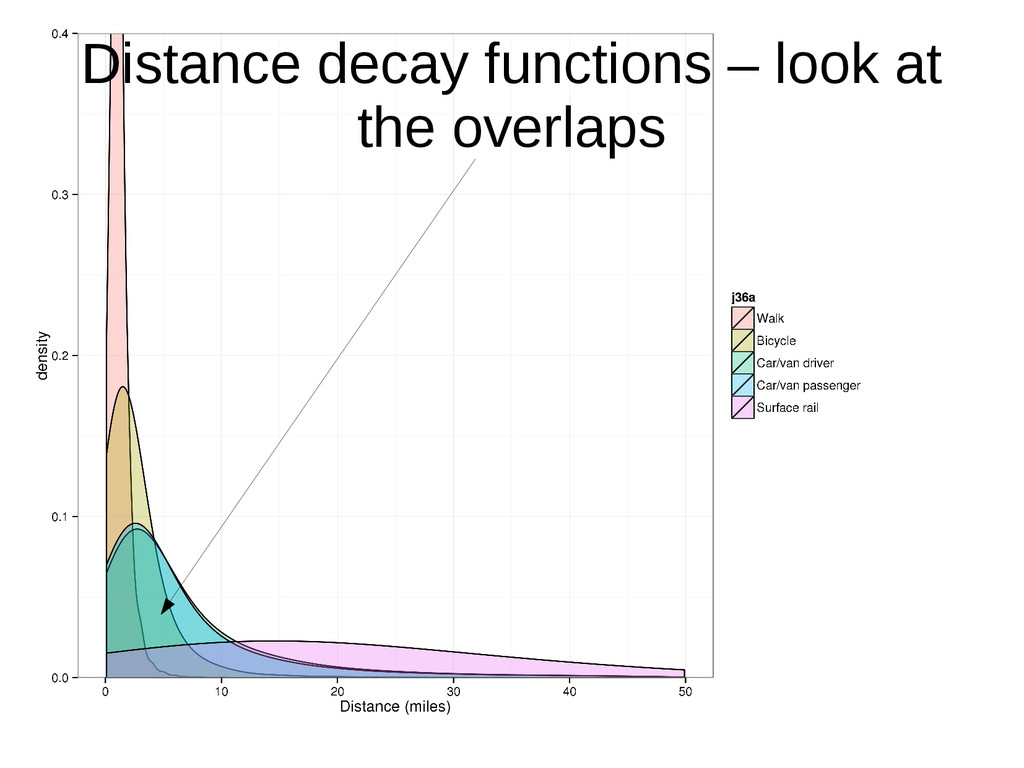
of trips” - a 'snapshot' model • Bikes can only replace trips of a certain distance • Or, more specifically, p(T -> B) ~ f(d T ) – Probability of trip T switching is related to distance • Assume distribution of distances is similar •
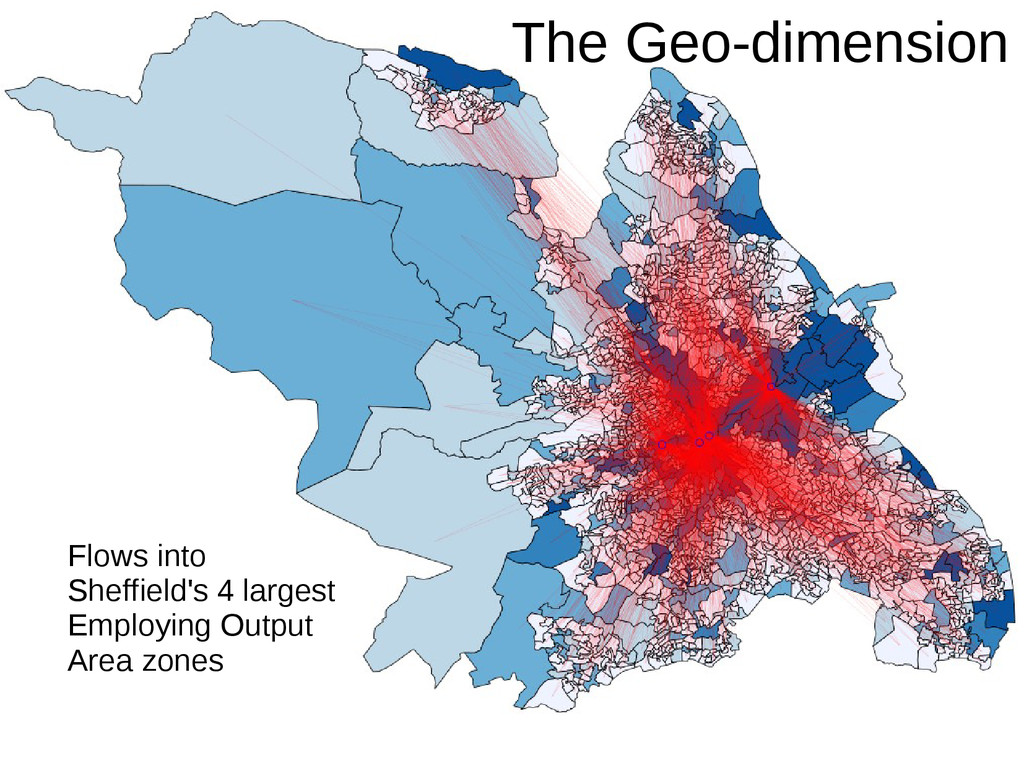
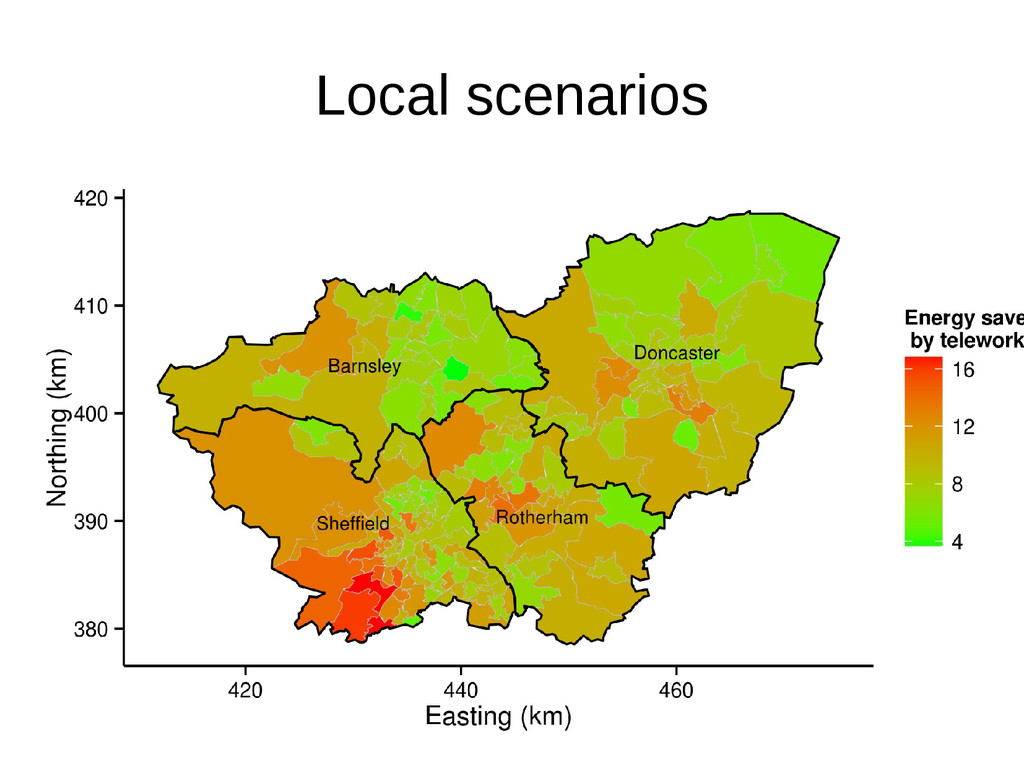
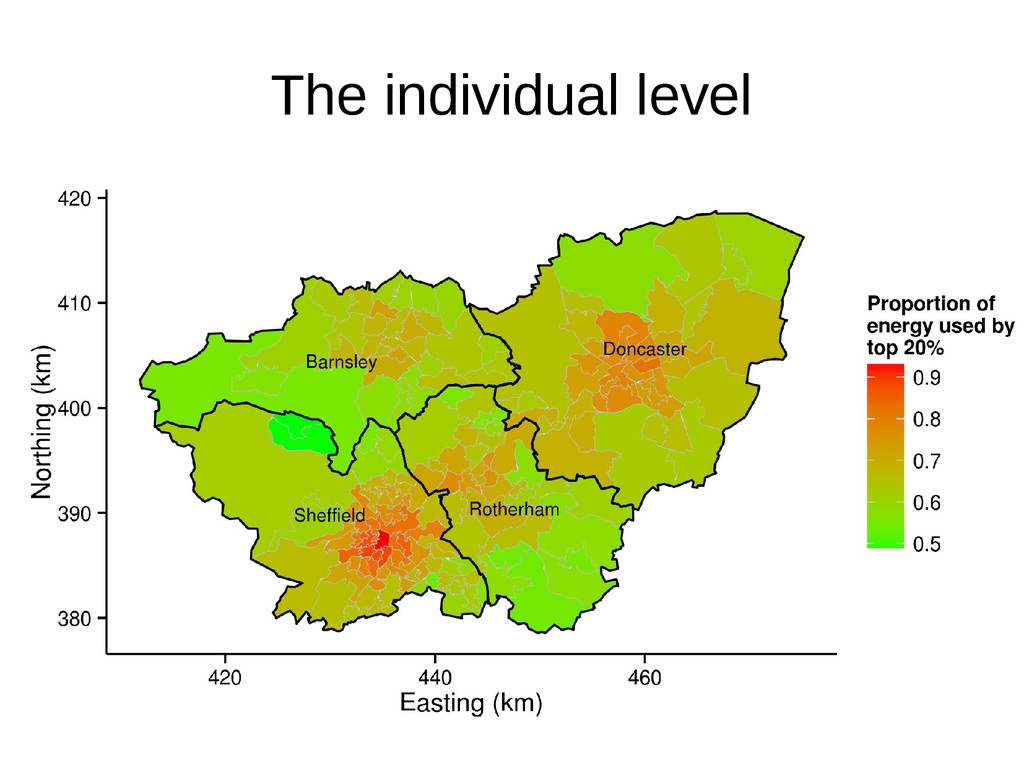
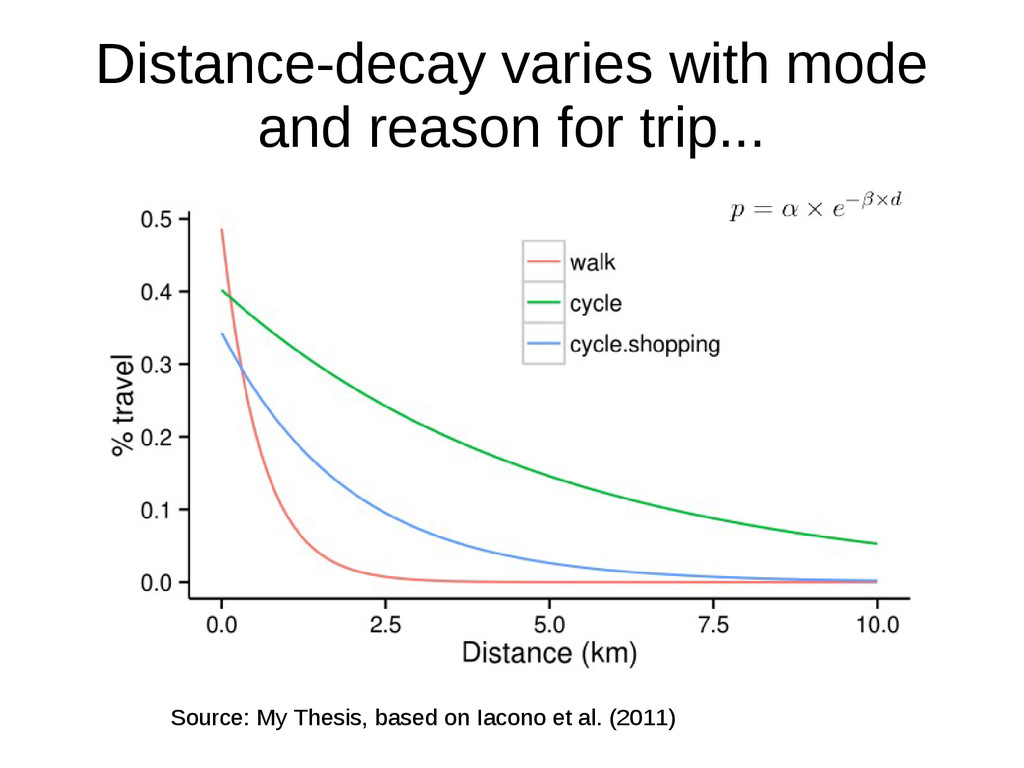
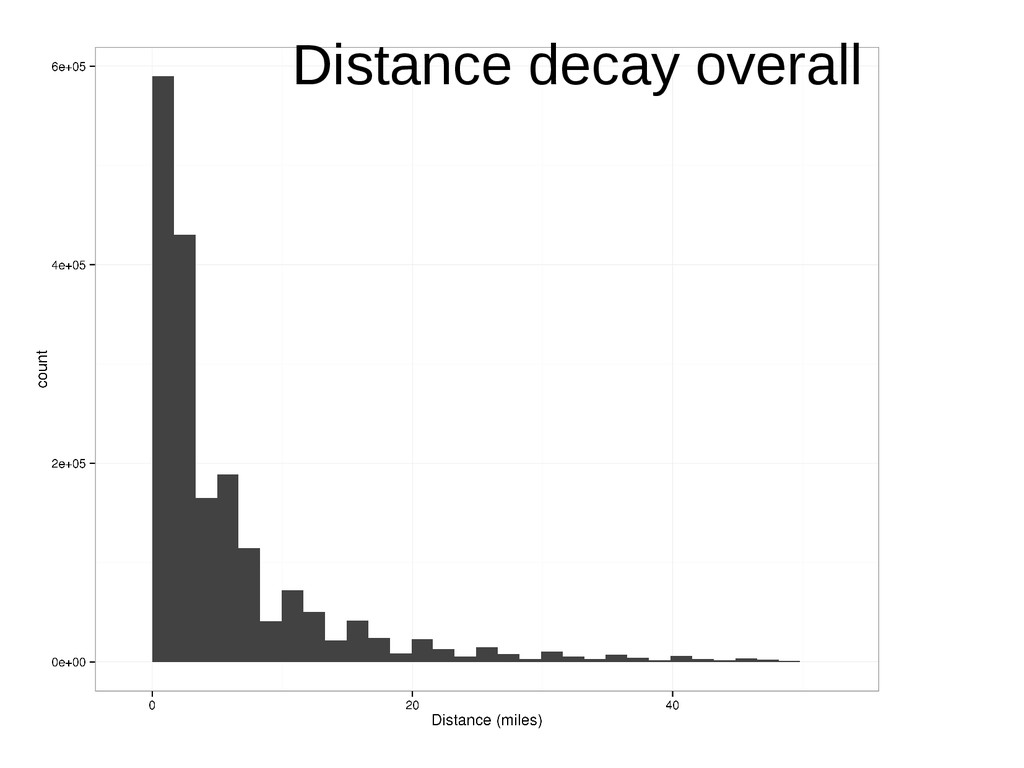
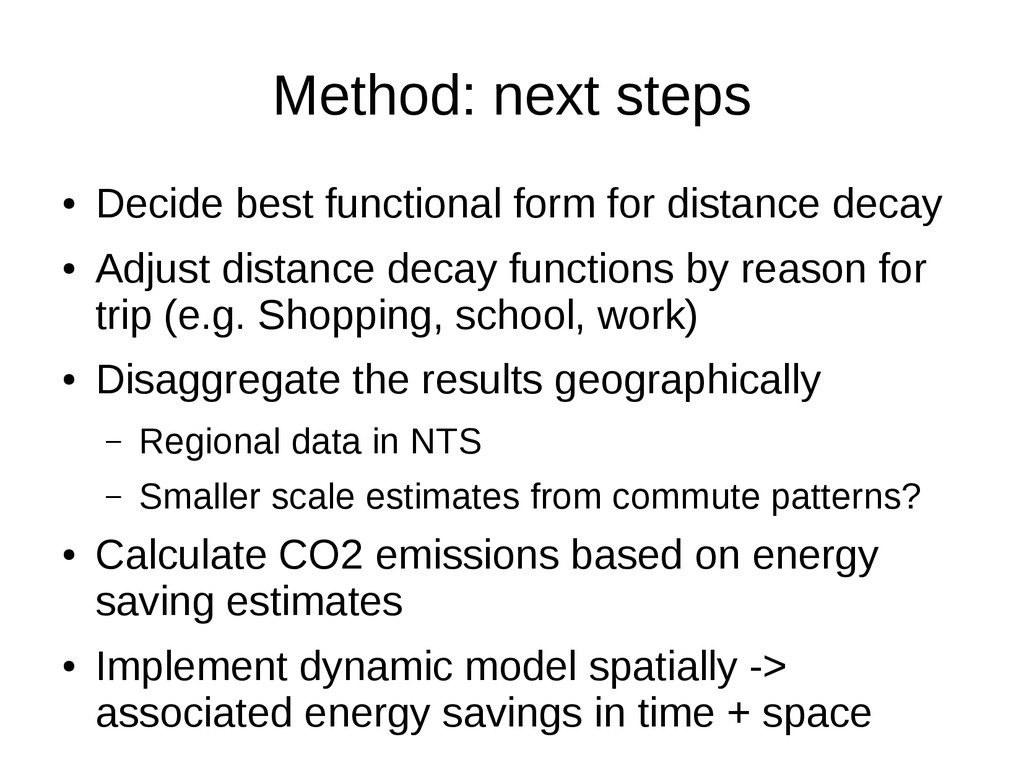
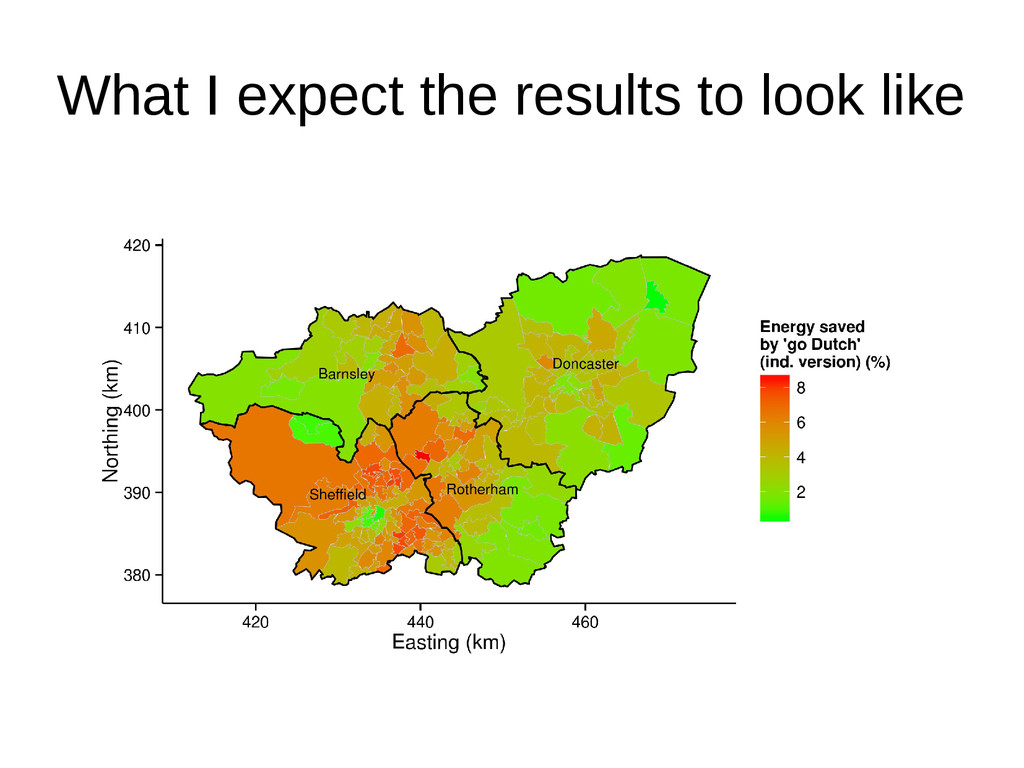
decay • Adjust distance decay functions by reason for trip (e.g. Shopping, school, work) • Disaggregate the results geographically – Regional data in NTS – Smaller scale estimates from commute patterns? • Calculate CO2 emissions based on energy saving estimates • Implement dynamic model spatially -> associated energy savings in time + space
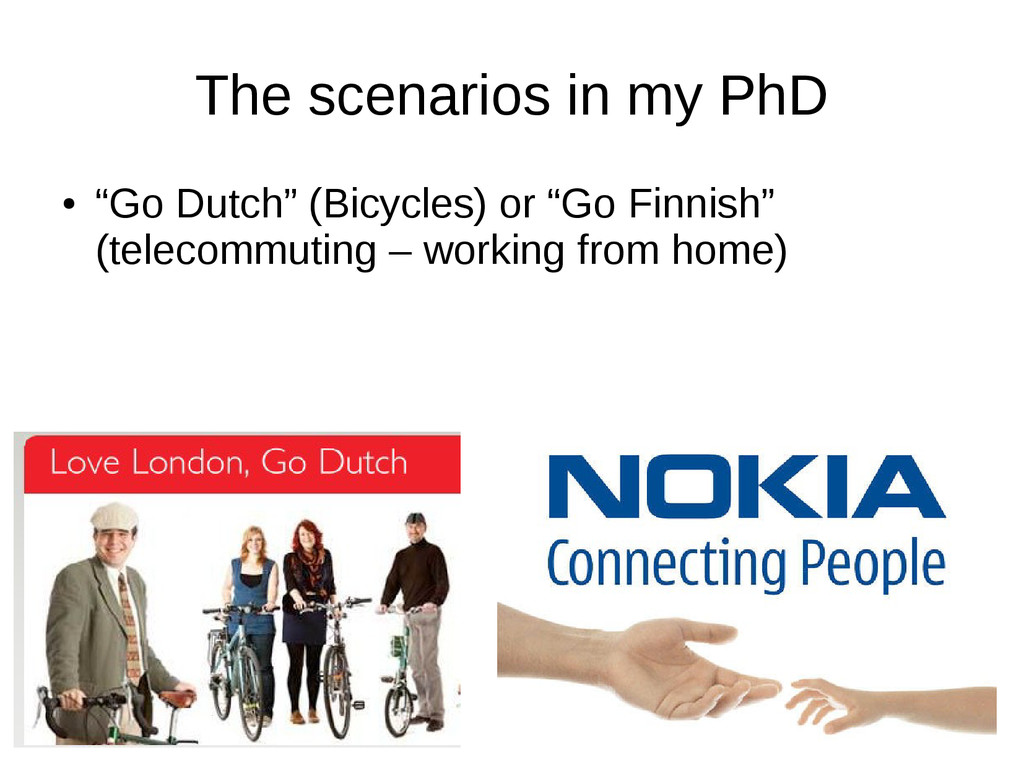
People cycling further, telecommuting) • The “Amazon effect” - people shopping less outside • Electric bicycles: elephant in the room • Impact of demographic shift -> spatial microsimulation model
model, a future of very high cycling uptake • Logistic growth seems most plausible • The National Transport Model should be reconciled with trends and the GBC scenario • The energy savings of cycling depends primarily on what modes cycling replaces • Modelling process has 2 major benefits: – Making visions of the future more tangible – Identification of long-term needs
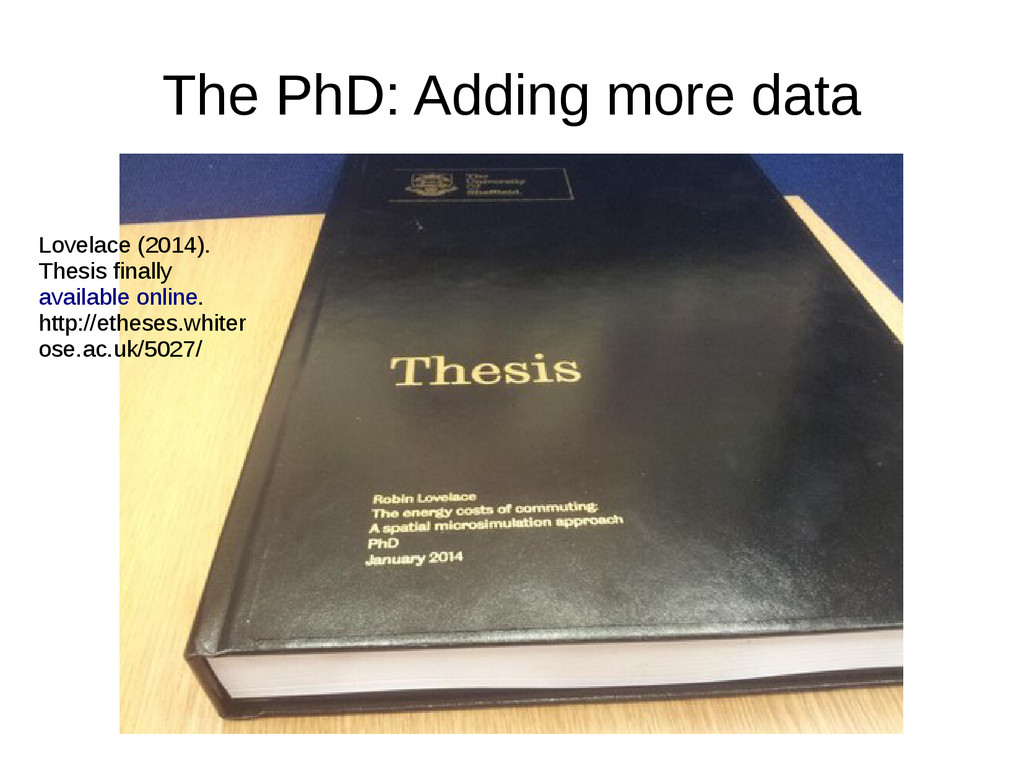
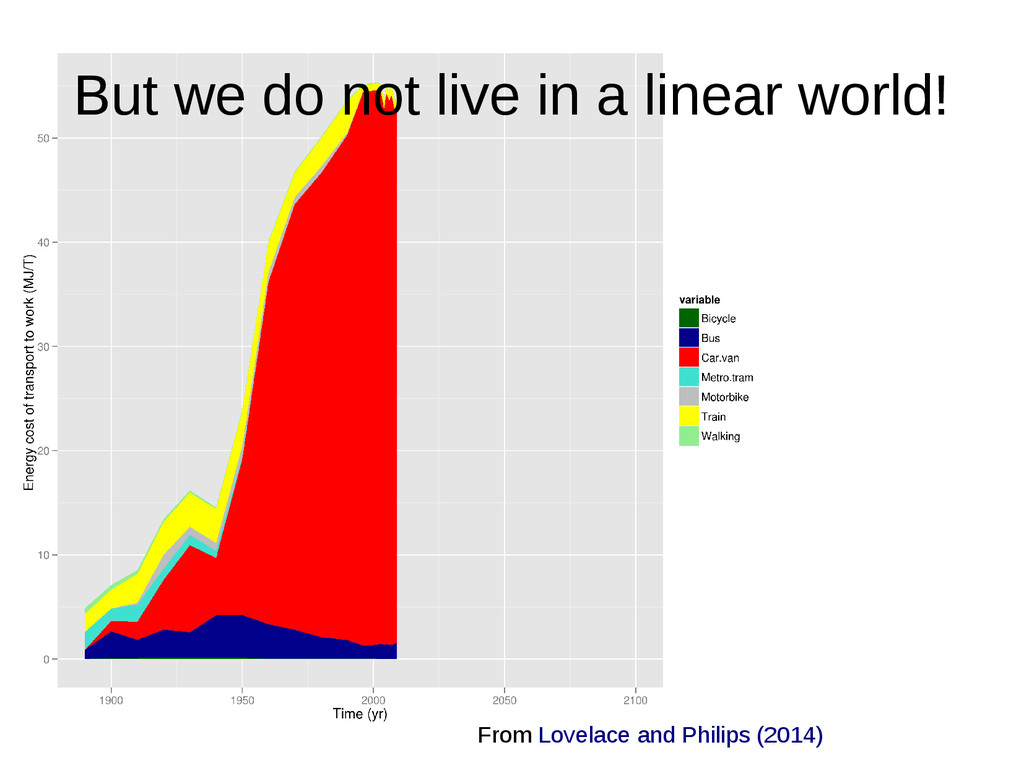
the inquiry. London. Retrieved from http://allpartycycling.files.wordpress.com/2013/04/get-britain-cycling_goodwi n-report.pdf • Lovelace, R., Beck, S. B. M. B. M., Watson, M., & Wild, A. (2011). Assessing the energy implications of replacing car trips with bicycle trips in Sheffield, UK. Energy Policy, 39(4), 2075–2087. doi:10.1016/j.enpol.2011.01.051 • Lovelace, R., & Philips, I. (2014). The “oil vulnerability” of commuter patterns: A case study from Yorkshire and the Humber, UK. Geoforum, 51(0), 169–182. doi:http://dx.doi.org/10.1016/j.geoforum.2013.11.005 • Lovelace, R. (2014). The energy costs of commuting: a spatial microsimulation approach. University of Sheffield. Retrieved from http://etheses.whiterose.ac.uk/5027/