Upgrade to Pro — share decks privately, control downloads, hide ads and more …

Analyzing Core Dump Generated By Go Program

Analyzing Core Dump Generated By Go Program

The brief introduction to analyze core dump generated by go program.

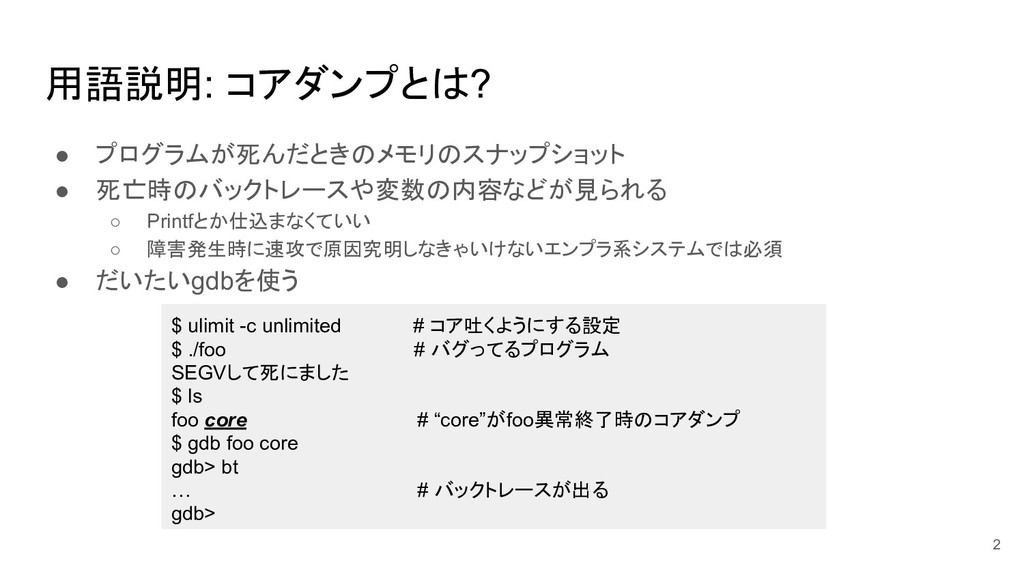
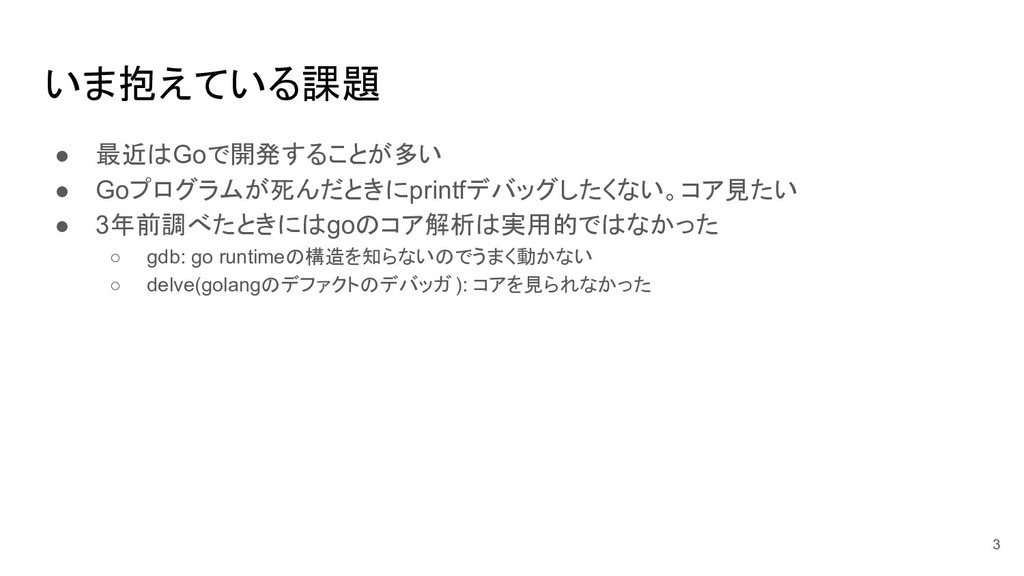
Debugging with core dump is very useful. However, debugging core dump
generated by go program was a bit difficult. It's because gdb can't interpret
go program's structure properly.

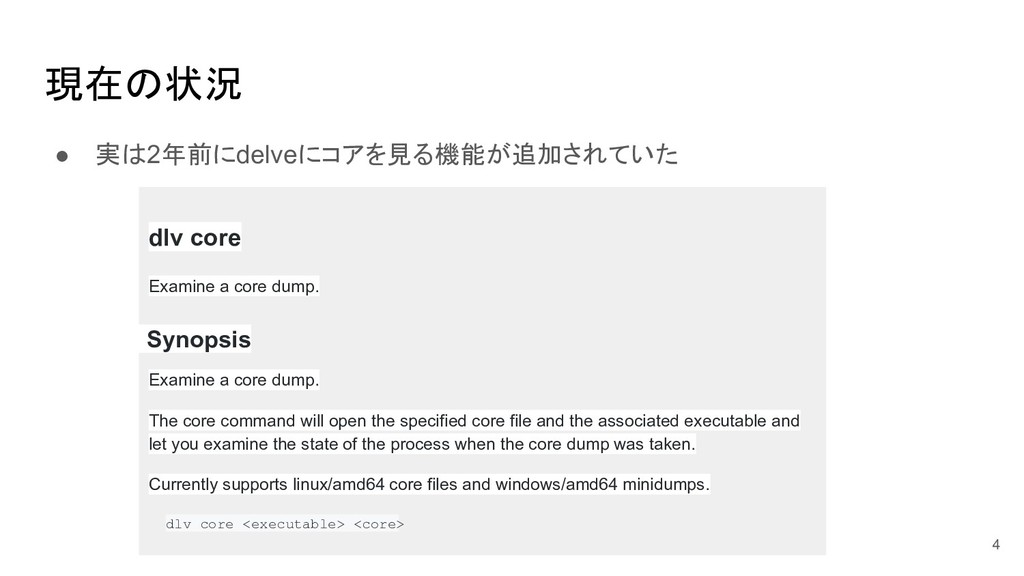
For several years ago, delve, the go program's de facto debugging tool,
implements the core dump analyzing subcommand. This slide introduces
this subcommand.

Satoru Takeuchi

August 17, 2019
Tweet

More Decks by Satoru Takeuchi

Other Decks in Technology

Transcript

  1. 用語説明: コアダンプとは? • プログラムが死んだときのメモリのスナップショット • 死亡時のバックトレースや変数の内容などが見られる ◦ Printfとか仕込まなくていい ◦ 障害発生時に速攻で原因究明しなきゃいけないエンプラ系システムでは必須

    • だいたいgdbを使う $ ulimit -c unlimited # コア吐くようにする設定 $ ./foo # バグってるプログラム SEGVして死にました $ ls foo core # “core”がfoo異常終了時のコアダンプ $ gdb foo core gdb> bt … # バックトレースが出る gdb> 2
  2. 現在の状況 • 実は2年前にdelveにコアを見る機能が追加されていた dlv core Examine a core dump. Synopsis

    Examine a core dump. The core command will open the specified core file and the associated executable and let you examine the state of the process when the core dump was taken. Currently supports linux/amd64 core files and windows/amd64 minidumps. dlv core <executable> <core> 4
  3. 使ってみる: まずは絶対死ぬプログラム作る $ export GOTRACEBACK=crash # goプログラムでコア吐かす設定 $ cat main.go

    package main func main() { var p *int p = nil *p = 1 # ぬるぽ踏んで死ぬ } $ go build main.go $ 5
  4. プログラム動かしてコア吐かせる $ ./main panic: runtime error: invalid memory address or

    nil pointer dereference [signal SIGSEGV: segmentation violation code=0x1 addr=0x0 pc=0x44f932] ... created by runtime.gcenable /usr/local/go/src/runtime/mgc.go:208 +0x58 Aborted (core dumped) $ ls core main main.go 6
  5. バックトレース出す $ dlv core main core Type 'help' for list

    of commands. (dlv) bt 0 0x000000000044af41 in runtime.raise at /usr/local/go/src/runtime/sys_linux_amd64.s:150 1 0x00000000004350fb in runtime.dieFromSignal at /usr/local/go/src/runtime/signal_unix.go:424 ... 11 0x000000000044f932 in main.main at ./main.go:6 12 0x0000000000424e1c in runtime.main at /usr/local/go/src/runtime/proc.go:200 13 0x0000000000449631 in runtime.goexit at /usr/local/go/src/runtime/asm_amd64.s:1337 $ 7
  6. ローカル変数を見る (dlv) frame 11 > runtime.raise() /usr/local/go/src/runtime/sys_linux_amd64.s:150 (PC: 0x44af41) Warning:

    debugging optimized function Frame 11: ./main.go:6 (PC: 44f932) 1: package main 2: 3: func main() { 4: var p *int 5: p = nil => 6: *p = 1 7: } 8: (dlv) locals p = (unreadable empty OP stack) # 最適化されてたのでメモリ上に無かった 8
  7. レジスタから変数の中身を見る (dlv) disass TEXT main.main(SB) /home/sat/go/src/sat/delve-coredump-tutorial/main.go main.go:6 0x44f930 31c0 xor

    eax, eax # pの値はraxに対応 main.go:6 0x44f932 48c70001000000 mov qword ptr [rax], 0x1 main.go:7 0x44f939 c3 ret (dlv) regs ... Rax = 0x0000000000000000 # ぬるぽ ... (dlv) 9
  8. goroutine(Go固有の軽量スレッド)一覧を見る (dlv) goroutines * Goroutine 1 - User: ./main.go:6 main.main

    (0x44f932) (thread 53425) Goroutine 2 - User: /usr/local/go/src/runtime/proc.go:242 runtime.forcegchelper (0x424ff0) Goroutine 3 - User: /usr/local/go/src/runtime/proc.go:302 runtime.gopark (0x4251ff) [3 goroutines] (dlv) 10