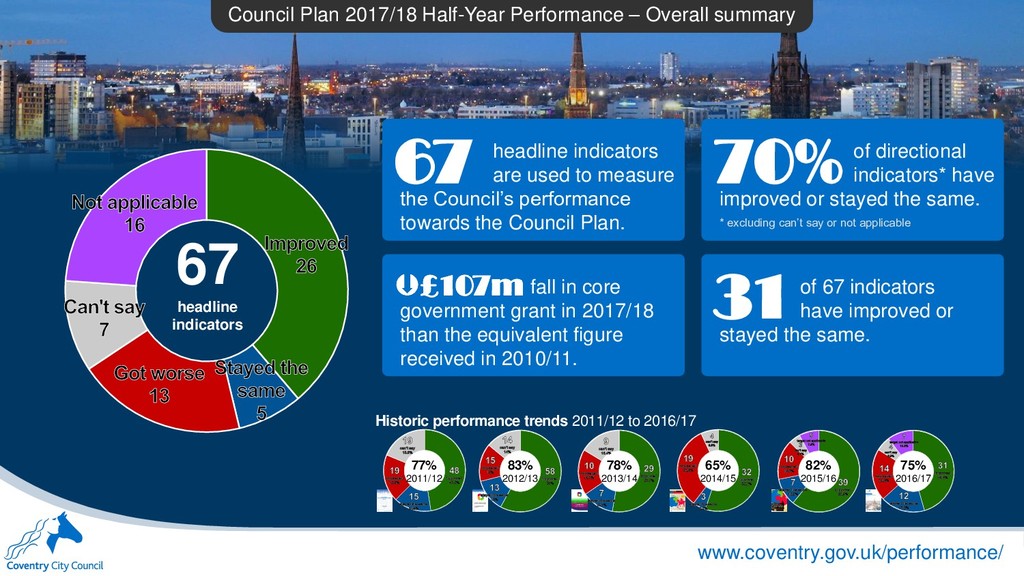
67 headline indicators 101 headline indicators 2011/12 100 headline indicators 2012/13 55 headline indicators 2013/14 77% 2011/12 83% 2012/13 78% 2013/14 58 headline indicators 2014/15 64 headline indicators 2015/16 68 headline indicators 2016/17 65% 2014/15 82% 2015/16 75% 2016/17 Historic performance trends 2011/12 to 2016/17 the Council’s performance towards the Council Plan. headline indicators are used to measure 70% improved or stayed the same. * excluding can’t say or not applicable of directional indicators* have £107m government grant in 2017/18 than the equivalent figure received in 2010/11. fall in core 31 stayed the same. of 67 indicators have improved or
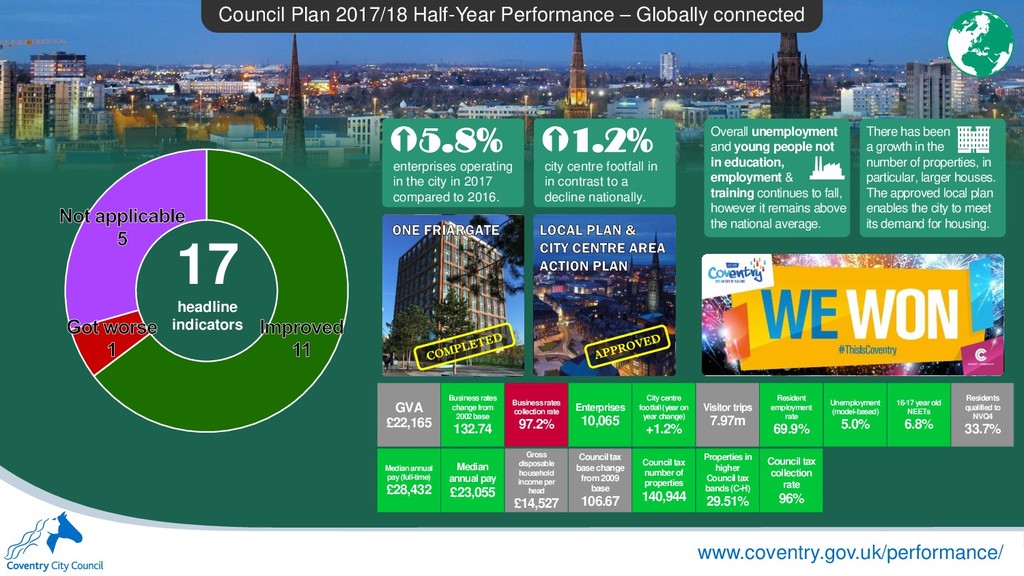
headline indicators GVA £22,165 Business rates change from 2002 base 132.74 Business rates collection rate 97.2% Enterprises 10,065 City centre footfall (year on year change) +1.2% Visitor trips 7.97m Resident employment rate 69.9% Unemployment (model-based) 5.0% 16-17 year old NEETs 6.8% Residents qualified to NVQ4 33.7% Median annual pay (full-time) £28,432 Median annual pay £23,055 Gross disposable household income per head £14,527 Council tax base change from 2009 base 106.67 Council tax number of properties 140,944 Properties in higher Council tax bands (C-H) 29.51% Council tax collection rate 96% 5.8% enterprises operating in the city in 2017 compared to 2016. 1.2% city centre footfall in in contrast to a decline nationally. Overall unemployment and young people not in education, employment & training continues to fall, however it remains above the national average. There has been a growth in the number of properties, in particular, larger houses. The approved local plan enables the city to meet its demand for housing.
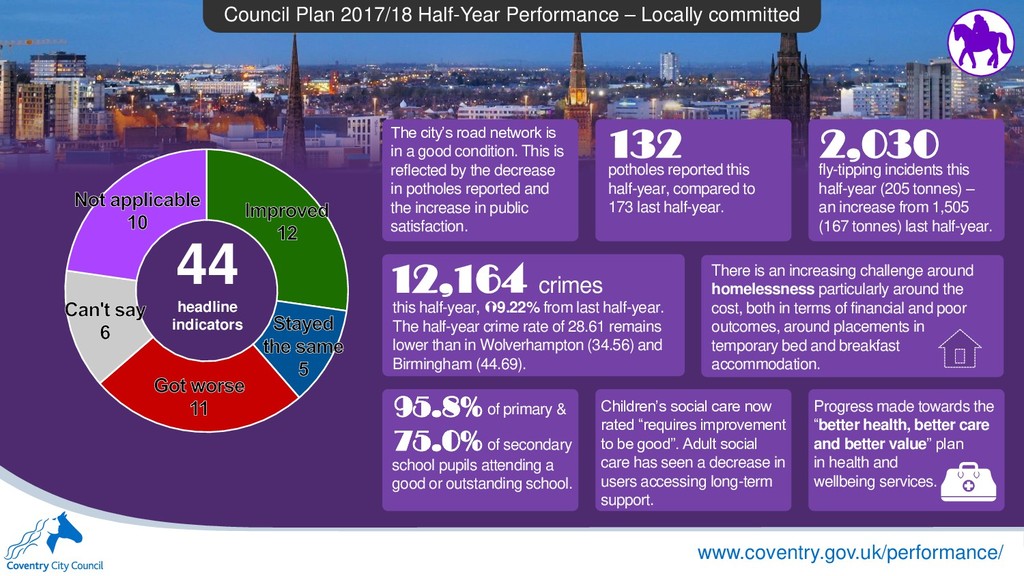
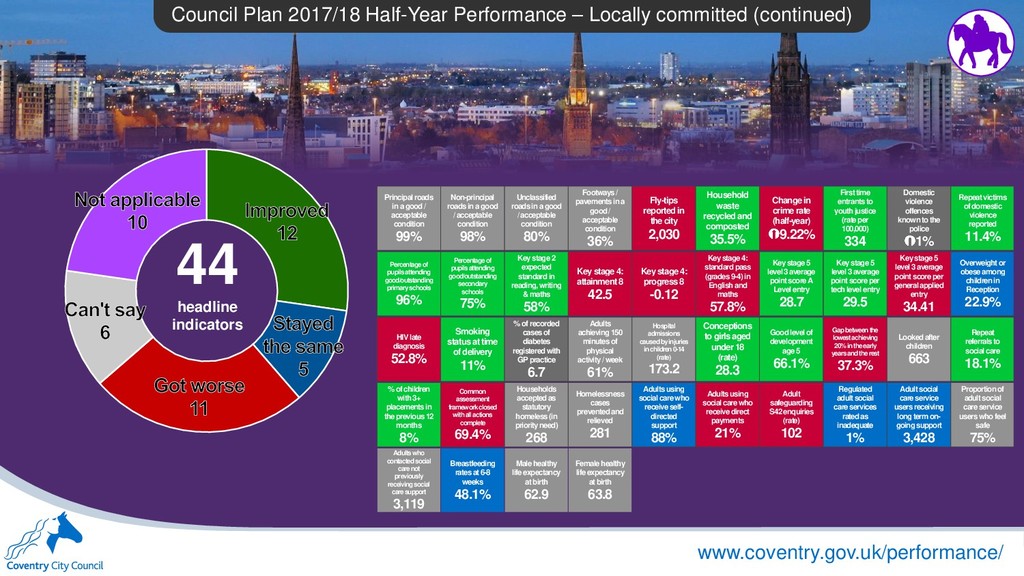
www.coventry.gov.uk/performance/ 44 headline indicators 12,164 this half-year, 9.22% from last half-year. The half-year crime rate of 28.61 remains lower than in Wolverhampton (34.56) and Birmingham (44.69). crimes There is an increasing challenge around homelessness particularly around the cost, both in terms of financial and poor outcomes, around placements in temporary bed and breakfast accommodation. The city’s road network is in a good condition. This is reflected by the decrease in potholes reported and the increase in public satisfaction. potholes reported this half-year, compared to 173 last half-year. fly-tipping incidents this half-year (205 tonnes) – an increase from 1,505 (167 tonnes) last half-year. 95.8% 75.0% Children’s social care now rated “requires improvement to be good”. Adult social care has seen a decrease in users accessing long-term support. of primary & of secondary school pupils attending a good or outstanding school. Progress made towards the “better health, better care and better value” plan in health and wellbeing services.
44 headline indicators Principal roads in a good / acceptable condition 99% Non-principal roads in a good / acceptable condition 98% Unclassified roads in a good / acceptable condition 80% Footways / pavements in a good / acceptable condition 36% Fly-tips reported in the city 2,030 Household waste recycled and composted 35.5% Change in crime rate (half-year) 9.22% First time entrants to youth justice (rate per 100,000) 334 Domestic violence offences known to the police 1% Repeat victims of domestic violence reported 11.4% Percentage of pupils attending good/outstanding primary schools 96% Percentage of pupils attending good/outstanding secondary schools 75% Key stage 2 expected standard in reading, writing & maths 58% Key stage 4: attainment 8 42.5 Key stage 4: progress 8 -0.12 Key stage 4: standard pass (grades 9-4) in English and maths 57.8% Key stage 5 level 3 average point score A Level entry 28.7 Key stage 5 level 3 average point score per tech level entry 29.5 Key stage 5 level 3 average point score per general applied entry 34.41 Overweight or obese among children in Reception 22.9% HIV late diagnosis 52.8% Smoking status at time of delivery 11% % of recorded cases of diabetes registered with GP practice 6.7 Adults achieving 150 minutes of physical activity / week 61% Hospital admissions caused by injuries in children 0-14 (rate) 173.2 Conceptions to girls aged under 18 (rate) 28.3 Good level of development age 5 66.1% Gap between the lowest achieving 20% in the early years and the rest 37.3% Looked after children 663 Repeat referrals to social care 18.1% % of children with 3+ placements in the previous 12 months 8% Common assessment framework closed with all actions complete 69.4% Households accepted as statutory homeless (in priority need) 268 Homelessness cases prevented and relieved 281 Adults using social care who receive self- directed support 88% Adults using social care who receive direct payments 21% Adult safeguarding S42 enquiries (rate) 102 Regulated adult social care services rated as inadequate 1% Adult social care service users receiving long term on- going support 3,428 Proportion of adult social care service users who feel safe 75% Adults who contacted social care not previously receiving social care support 3,119 Breastfeeding rates at 6-8 weeks 48.1% Male healthy life expectancy at birth 62.9 Female healthy life expectancy at birth 63.8
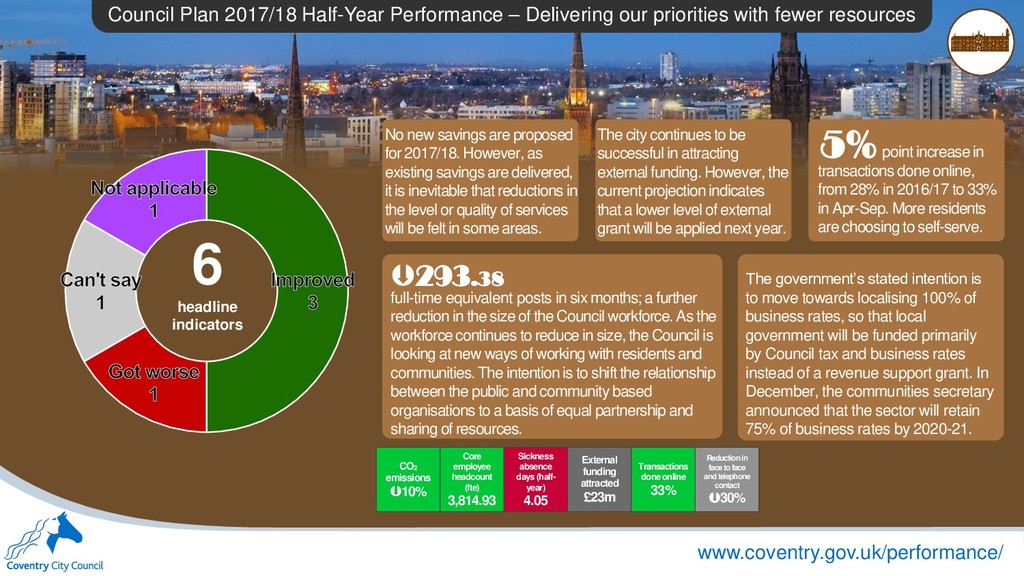
with fewer resources 6 headline indicators CO2 emissions 10% Core employee headcount (fte) 3,814.93 Sickness absence days (half- year) 4.05 External funding attracted £23m Transactions done online 33% Reduction in face to face and telephone contact 30% 293.38 The government’s stated intention is to move towards localising 100% of business rates, so that local government will be funded primarily by Council tax and business rates instead of a revenue support grant. In December, the communities secretary announced that the sector will retain 75% of business rates by 2020-21. 5% No new savings are proposed for 2017/18. However, as existing savings are delivered, it is inevitable that reductions in the level or quality of services will be felt in some areas. The city continues to be successful in attracting external funding. However, the current projection indicates that a lower level of external grant will be applied next year. point increase in transactions done online, from 28% in 2016/17 to 33% in Apr-Sep. More residents are choosing to self-serve. full-time equivalent posts in six months; a further reduction in the size of the Council workforce. As the workforce continues to reduce in size, the Council is looking at new ways of working with residents and communities. The intention is to shift the relationship between the public and community based organisations to a basis of equal partnership and sharing of resources.