Upgrade to Pro — share decks privately, control downloads, hide ads and more …

Interactive Web Application of 3D ArcGIS Structural Mapping of Edwards Aquifer, Balcones Fault Zone, Texas, USA

Interactive Web Application of 3D ArcGIS Structural Mapping of Edwards Aquifer, Balcones Fault Zone, Texas, USA

Presented by:
Sarah Eason, GISP - Edwards Aquifer Authority

More Decks by Texas Natural Resources Information System

Other Decks in Technology

Transcript

  1. Interactive Web Application of 3D ArcGIS Structural Mapping of Edwards

    Aquifer, Balcones Fault Zone, Texas, USA Texas GIS Forum, Thursday, October 23, 2014 Sarah Eason, GISP GIS Analyst Edwards Aquifer Authority (EAA)
  2. OUTLINE • Intro to Edwards Aquifer • Problem Statement •

    Scope and Data • Software Used • Methods • Results: WEB MAP APP!! • Accuracy and Limitations • Conclusions and Future Work
  3. LIFE IN THE AQUIFER • Water supply for 2 million

    South Texans • Home to 40 million species • Eight threatened/ endangered species
  4. HISTORY OF THE AQUIFER • Marine animals, 100 mya •

    Balcones Fault Zone, 17 mya CaCO3
  5. WATER USES • 95% discharge is combined springflow, municipal and

    irrigation uses • 100 gallons of water, per person, each day
  6. The Edwards Aquifer Authority is a political subdivision of the

    State of Texas that was created to manage, enhance, and protect the Edwards Aquifer system.
  7. AQUIFER MANAGEMENT Groundwater permits issued by the EAA allow non-exempt

    well owners to withdraw Edwards groundwater for municipal, industrial, and irrigation purposes.
  8. THE BIG QUESTION: WHERE DOES THE AQUIFER START? • Drillers

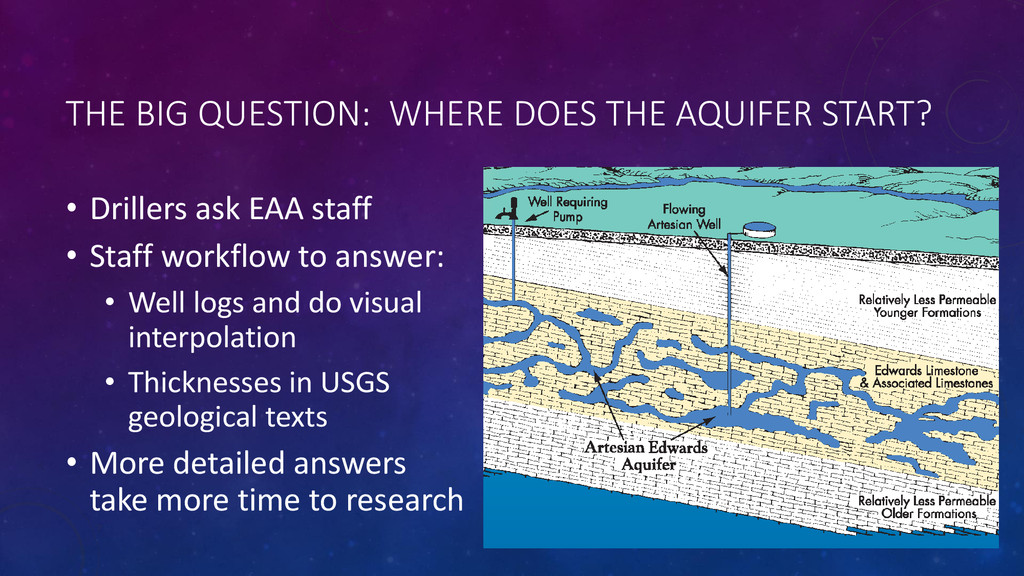
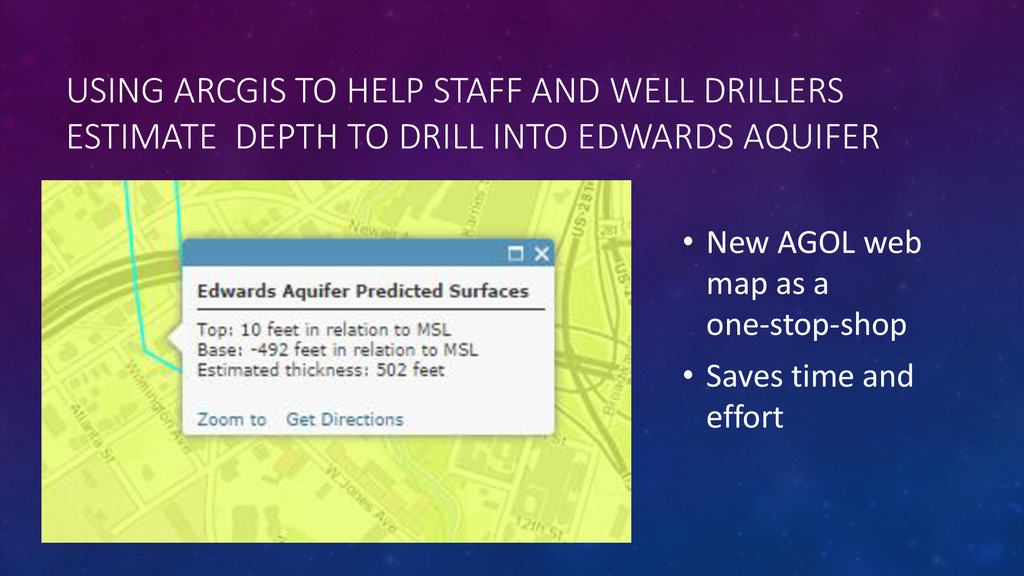
    ask EAA staff • Staff workflow to answer: • Well logs and do visual interpolation • Thicknesses in USGS geological texts • More detailed answers take more time to research
  9. USING ARCGIS TO HELP STAFF AND WELL DRILLERS ESTIMATE DEPTH

    TO DRILL INTO EDWARDS AQUIFER • New AGOL web map as a one-stop-shop • Saves time and effort
  10. DATA • DEM surface elevations • Measured formation elevations from

    well logs • Generalized USGS geologic formation estimated thicknesses
  11. SOFTWARE • ArcGIS Desktop Advanced License • ArcGIS Spatial Analyst

    Extension • ArcGIS for Server • ArcGIS Online Platform
  12. INTERACTIVE WEB MAP • Click anywhere on map • Or

    enter an address and click on property • Pop-up displays values for: • Top of Edwards • Base of Edwards • Estimated thickness of Edwards
  13. INTERACTIVE WEB MAPS • Beta version for the first year

    • Use drillers to test • Afterward, go public
  14. LIMITATIONS • Data • Limited well data in many areas

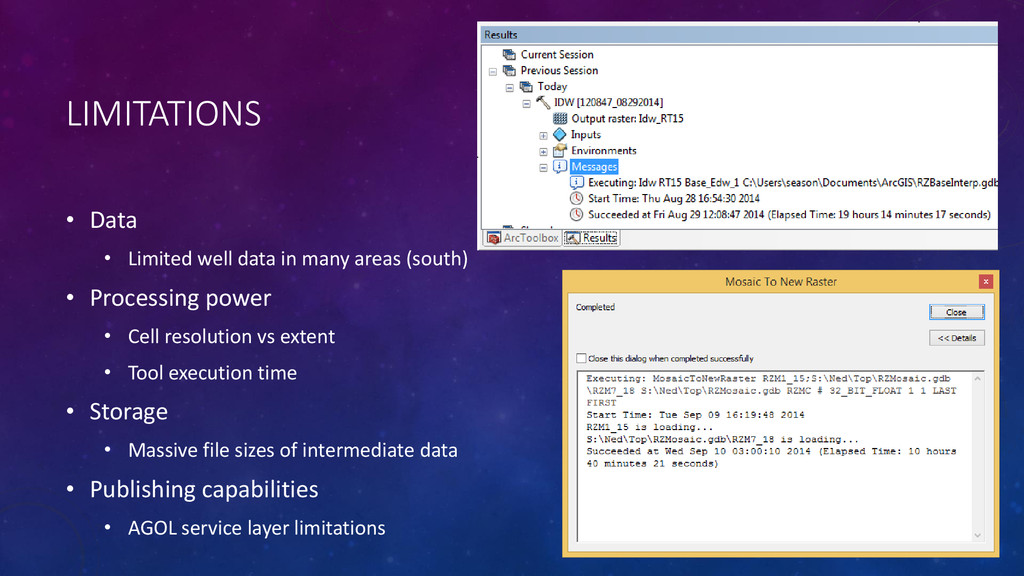
    (south) • Processing power • Cell resolution vs extent • Tool execution time • Storage • Massive file sizes of intermediate data • Publishing capabilities • AGOL service layer limitations
  15. CONCLUSIONS AND FUTURE WORK • More data will produce higher

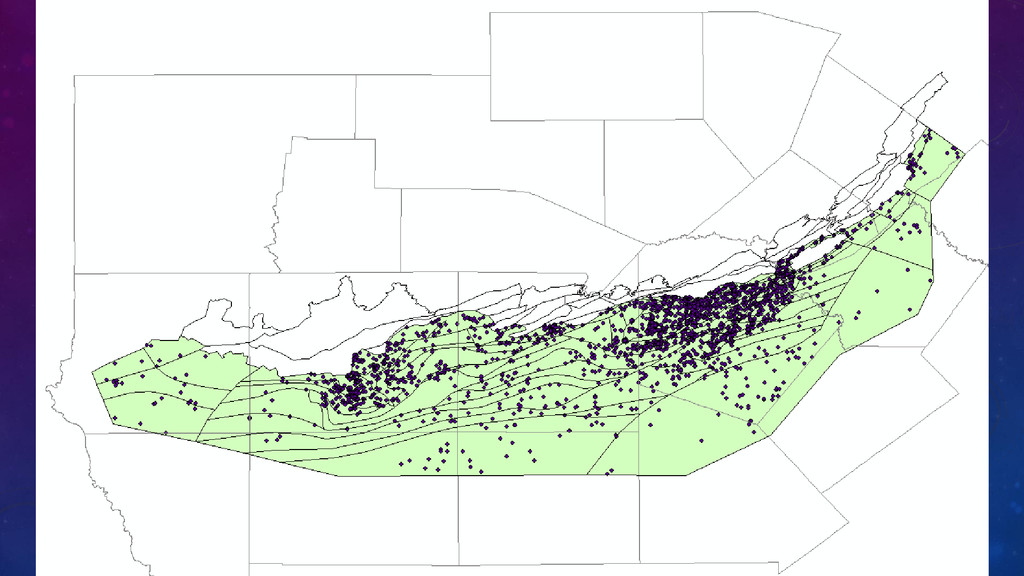
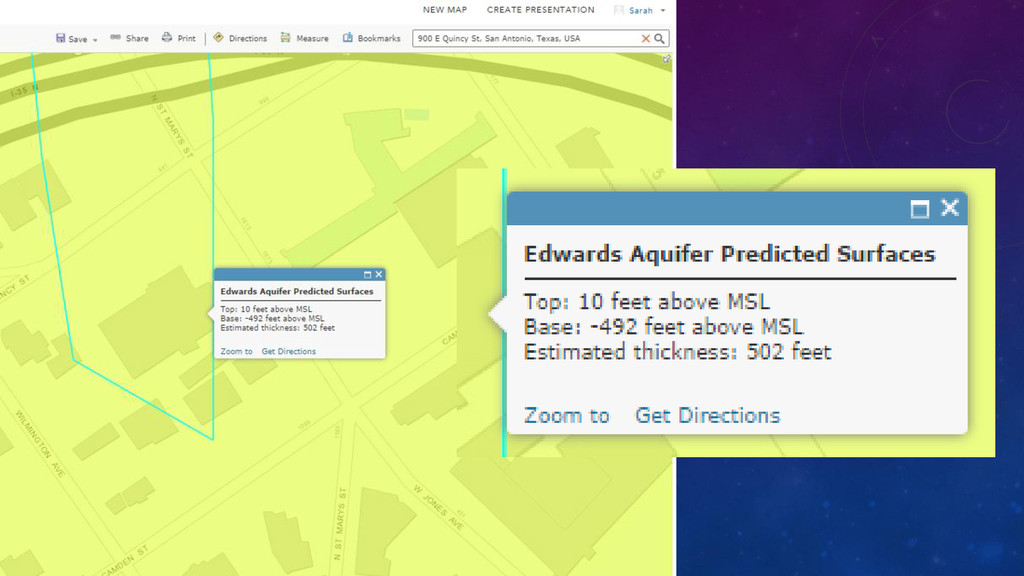
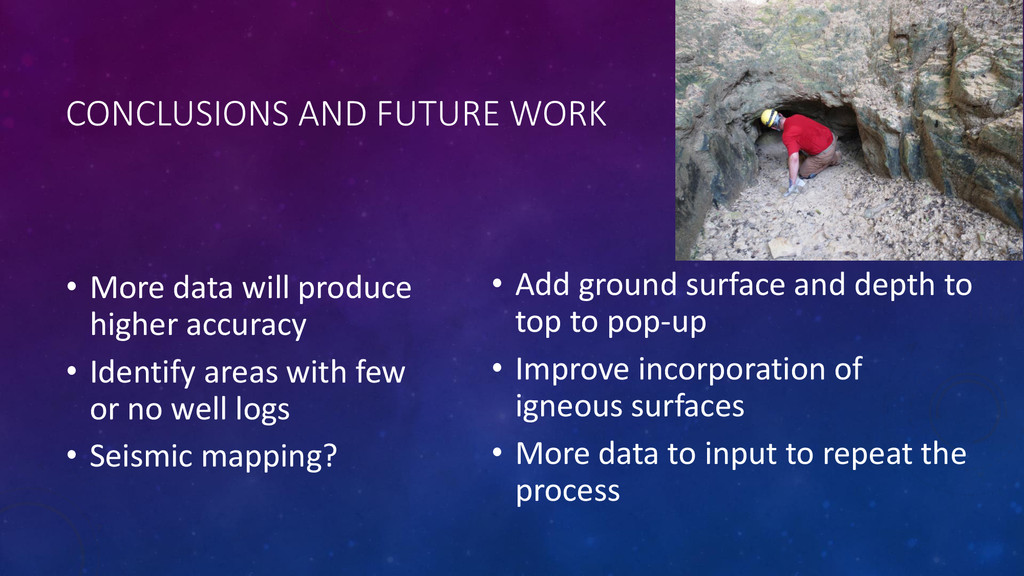
    accuracy • Identify areas with few or no well logs • Seismic mapping? • Add ground surface and depth to top to pop-up • Improve incorporation of igneous surfaces • More data to input to repeat the process
  16. REFERENCES • Edwards Aquifer Authority http://www.edwardsaquifer.org/ • ArcGIS image: https://encrypted-tbn3.gstatic.com/images?q=tbn:ANd9GcSGyU7YCCj05uCmmMMB4pAwffB7JYrCWa1RNf-liRNAQPVnVeET

    • ArcGIS Online image: http://giscentric.files.wordpress.com/2012/08/arcgis_lp_cloud.png?w=300&h=168 • ArcGIS Spatial Analyst image: https://encrypted-tbn0.gstatic.com/images?q=tbn:ANd9GcQp4oB3aZrl2lTKtKvc5ut4disfq-hfrsQxQ-W87R8heFMXcVc87A • Peck’s Cave Amphipod image: http://www.biologicaldiversity.org/species/invertebrates/Pecks_cave_amphipod/images/PecksCaveAmphipod_(c)JoeNFries.jpg • Comal Springs Riffle Beetle image: http://newswatch.nationalgeographic.com/files/2012/10/comal-springs-riffle-beetle.jpg • Comal Springs Dryopid Beetle image: https://encrypted-tbn0.gstatic.com/images?q=tbn:ANd9GcTofRhugtKSJ7DmNa0HQ97J5qhWImkcPC_MhXKeXyhPRd3Ad2LM