Upgrade to Pro — share decks privately, control downloads, hide ads and more …

Texas Mapping Systems: Application and Dissemination of Big Data

Texas Mapping Systems: Application and Dissemination of Big Data

Presented by:
Amie Treuer-Kuehn,
Texas Parks & Wildlife

More Decks by Texas Natural Resources Information System

Other Decks in Technology

Transcript

  1. Texas Mapping Systems: Application and Dissemination of Big Data ž 

    Ecological Systems Project —  Background —  Methods —  Results ž  Application —  Species Habitat Modeling —  Conservation Opportunity Areas —  Riparian Conservation ž  Delivery —  Difficulties —  Professional Delivery —  TEAM Application ž  Questions
  2. Background ž  GOAL- Better land cover for Texas —  Increase

    spatial resolution(10 m vs 30 m) and thematic resolution (18 classes vs 399 classes) —  Better accuracy (overall 85%) —  Better ecological interpretation ž  Multi-Agency, many Partners. —  MoRAP, University of Missouri —  TNC, Texas —  NatureServe, Southeast Region —  TNRIS —  NRCS, TXFS, USFS , & USFWS —  Private landowners others
  3. Field Data Phase 1 Phase 2 Phase 3 Phase 4

    Phase 5 Phase 6 •  Sampled roadside, private & public land •  Dominant species, land cover types, and classes of % composition
  4. Results- Landcover L a n d cover  C la sses

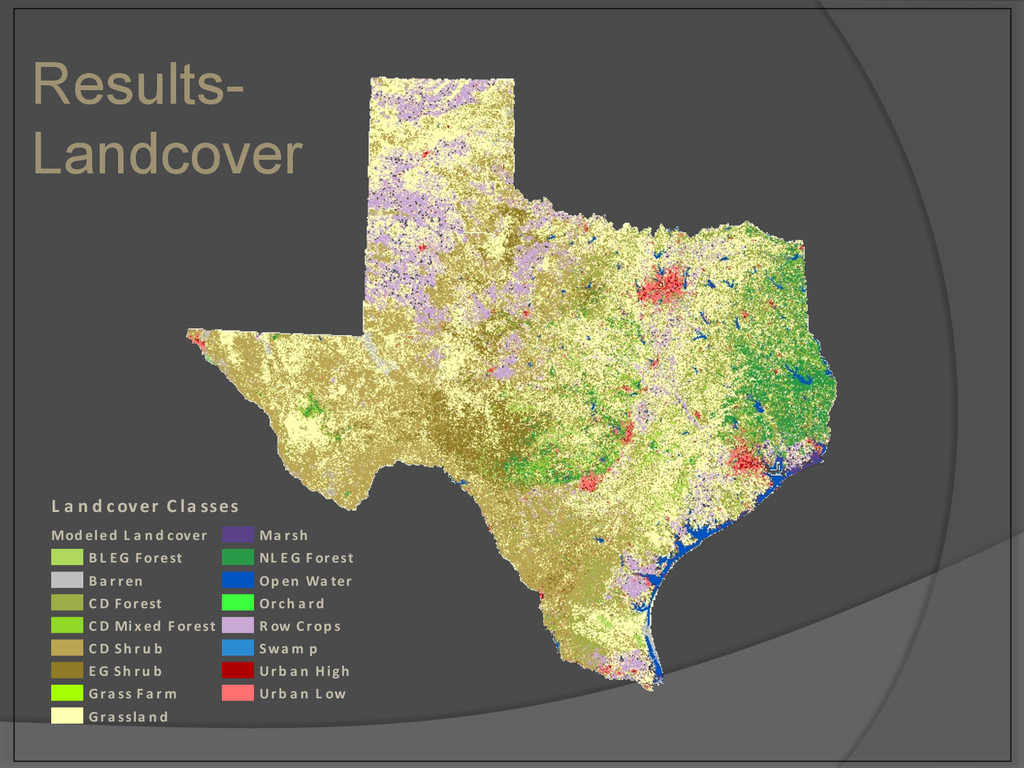
    Mod eled  L a n d cover BL E G  F orest Ba r ren C D  F orest C D  Mix ed  F orest C D  Sh r u b E G  Sh r u b Gra ss  F a r m Gra ssla n d Ma r sh NL E G  F orest Op en  Wa ter Orch a rd R ow  C rop s Swa m p Ur b a n  High Ur b a n  L ow
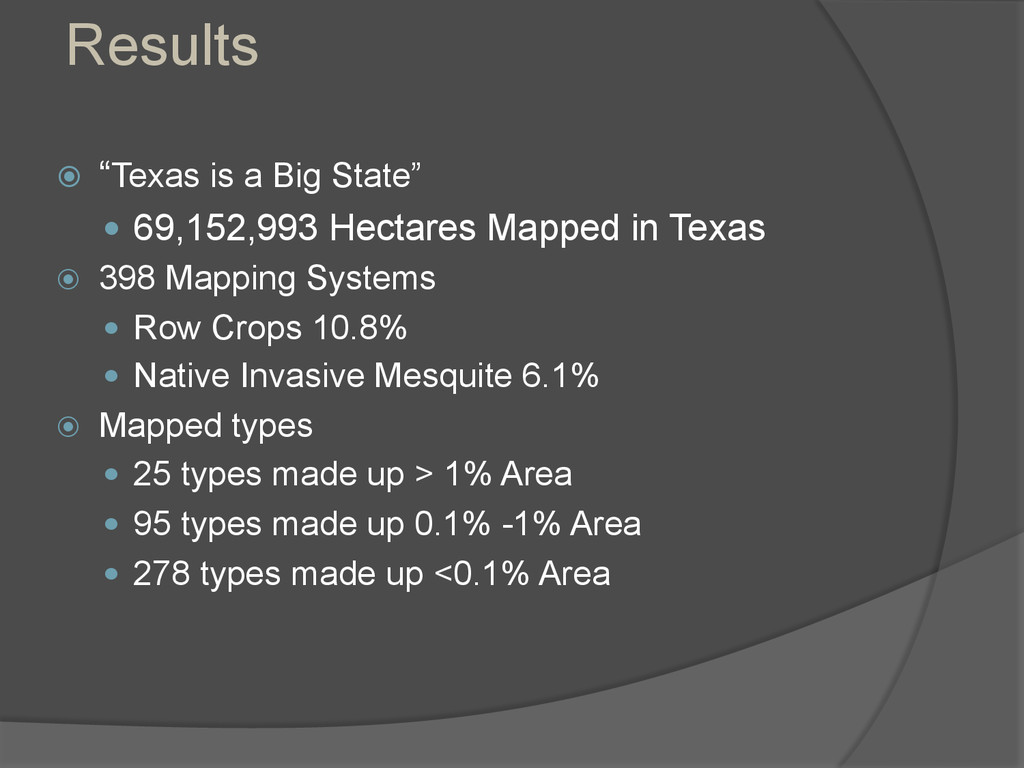
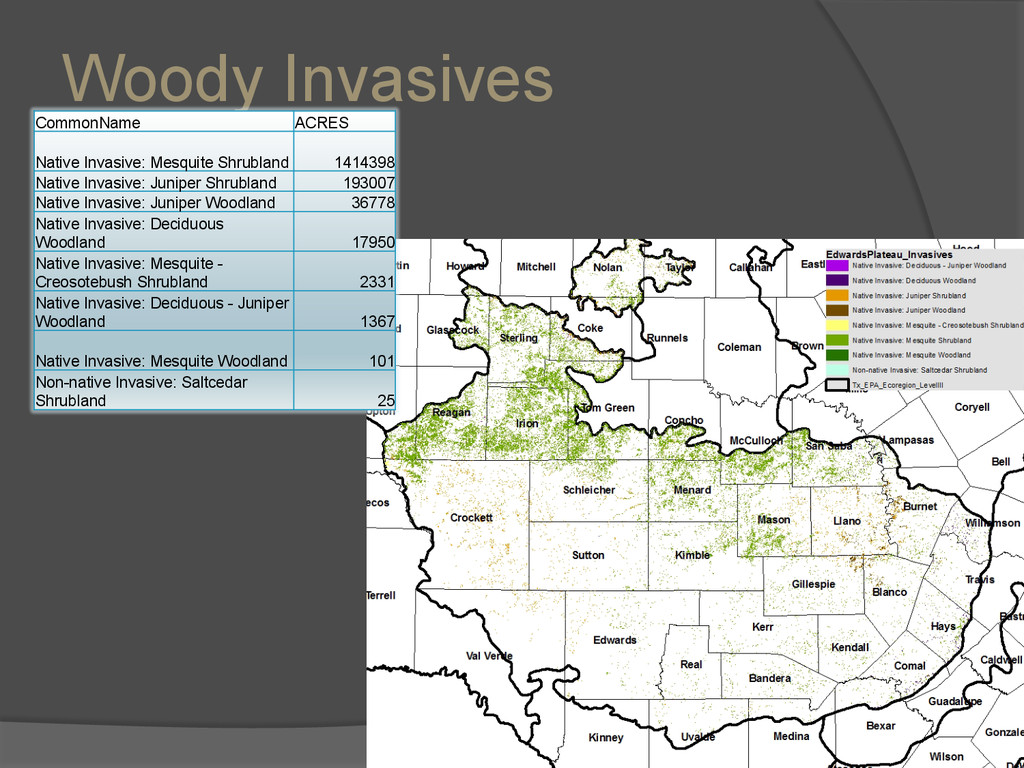
  5. Results •  Higher Spatial Resolution •  polygons at 10m from

    resampled aerial imagery •  Higher Thematic Resolution •  398 types •  Field Collected Data •  >14,000 points collected •  Agreement with ground data •  74% to 90% •  Mapped 19 Invasive Types
  6. ž  “Texas is a Big State” —  69,152,993 Hectares Mapped

    in Texas ž  398 Mapping Systems —  Row Crops 10.8% —  Native Invasive Mesquite 6.1% ž  Mapped types —  25 types made up > 1% Area —  95 types made up 0.1% -1% Area —  278 types made up <0.1% Area Results
  7. Results 0 2 4 6 8 10 12 % Land

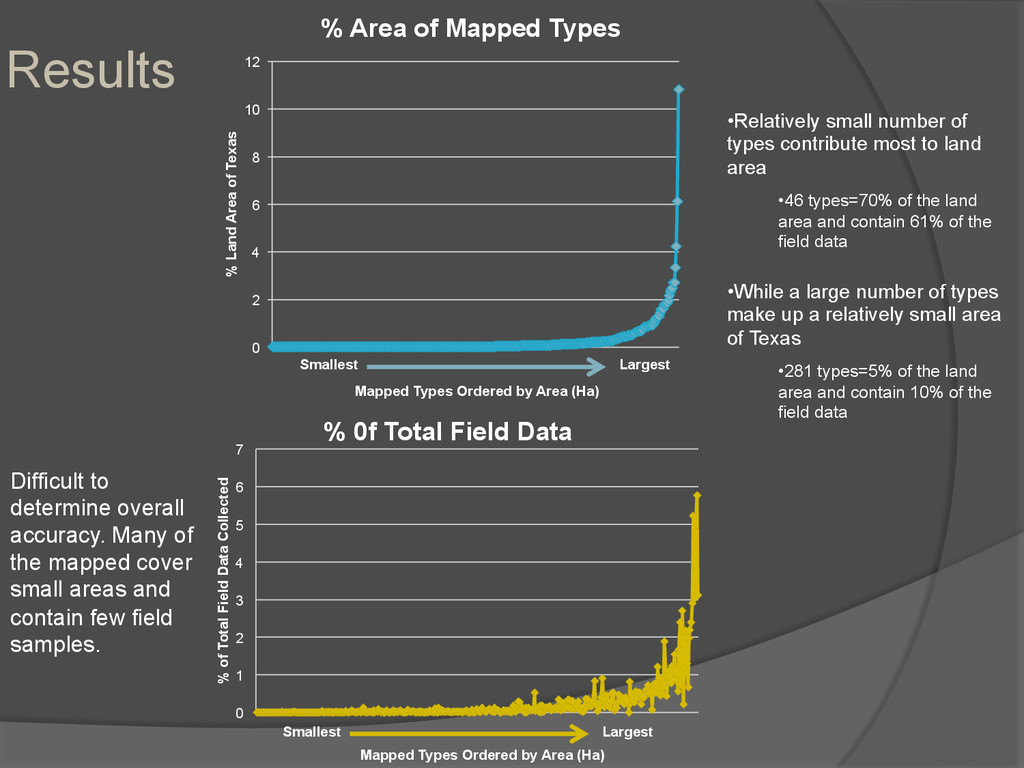
    Area of Texas Mapped Types Ordered by Area (Ha) % Area of Mapped Types 0 1 2 3 4 5 6 7 % of Total Field Data Collected % 0f Total Field Data Largest • Relatively small number of types contribute most to land area • 46 types=70% of the land area and contain 61% of the field data • While a large number of types make up a relatively small area of Texas • 281 types=5% of the land area and contain 10% of the field data Difficult to determine overall accuracy. Many of the mapped cover small areas and contain few field samples. Mapped Types Ordered by Area (Ha) Smallest Smallest Largest
  8. Application ž  TPWD and Users ž  Development of educational and

    interpretive materials ž  Enduring Features ž  Species habitat modeling ž  Louisiana Black Bear ž  Golden Cheeked Warbler ž  Eastern Red Turkey ž  Change detection ◦  Natural Disturbance —  Wildfires & Drought – Texas A & M and others ◦  Climate change ◦  Urbanization ž  Impact & Mitigation for development projects ž  TxDOT ž  Environmental Site Assements ž  Agricluture Analysis ž  Watershed Analysis ž  Texas Conservation Opportunity Areas ž  Land Management options ž  T.E.A.M Tool ž  Invasive Species
  9. Number  of   Pixels Mapping  Sub-­‐System Total  Area  (Ha) 212

    Post  Oak  Savanna:    Live  Oak  Motte  and  Woodland 2.1 511,217 Post  Oak  Savanna:    Post  Oak  Motte  and  Woodland 5,112.2 412,505 Post  Oak  Savanna:    Post  Oak  Savanna  Grassland 4,125.1 21,252 Post  Oak  Savanna:    Post  Oak-­‐Yaupon  Motte  and  Woodland 212.5 132 Post  Oak  Savanna:    Deciduous  Slope  Woodland  and  Forest 1.3 1,579 Southeastern  Great  Plains  Floodplain  Mixed  Deciduous  -­‐  Evergreen  Forest  an* 15.8 1,102,338 Southeastern  Great  Plains  Floodplain  Deciduous  Forest  and  Woodland 11,023.4 75 Southeastern  Great  Plains  Floodplain  Evergreen  Shrubland 0.8 101,717 Southeastern  Great  Plains  Floodplain  Deciduous  Shrubland 1,017.2 422,848 Southeastern  Great  Plains  Floodplain  Herbaceous  Vegetation 4,228.5 636 Southeastern  Great  Plains  Floodplain  Baldcypress  Swamp 6.4 13,429 Southeastern  Great  Plains  Floodplain  Seasonally  Flooded  Hardwood  Forest 134.3 506 Southeastern  Great  Plains  Riparian  Mixed  Deciduous  -­‐  Evergreen  Forest  and  * 5.1 12,268 Southeastern  Great  Plains  Riparian  Deciduous  Forest  and  Woodland 122.7 1,925 Southeastern  Great  Plains  Riparian  Deciduous  Shrubland 19.3 25,711 Southeastern  Great  Plains  Riparian  Herbaceous  Vegetation 257.1 11 Pineywoods:  Riparian  Temporarily  Flooded  Live  Oak  Forest 0.1 3,423 Blackland  Prairie  Disturbance  or  Tame  Grassland 34.2 149 Post  Oak  Savanna:    Xeric  Sandyland  Woodland  and  Shrubland 1.5 179 Post  Oak  Savanna:    Xeric  Sandyland  Herbaceous  Vegetation 1.8 1,578 Native  Invasive:  Deciduous  Woodland 15.8 36 Native  Invasive:  Juniper  Woodland 0.4 203 Native  Invasive:  Juniper  Shrubland 2.0 5,034 Native  Invasive:  Mesquite  Shrubland 50.3 13 Native  Invasive:  Deciduous  Shrubland 0.1 273 Marsh 2.7 85 Swamp 0.9 770 Barren 7.7 16,114 Open  Water 161.1 2,345 Row  Crops 23.5 879 Urban  High  Intensity 8.8 5,655 Urban  Low  Intensity 56.6 Rapid Analysis of Potential Impact Site
  10. Woody Invasives CommonName   ACRES   Native Invasive: Mesquite Shrubland

      1414398   Native Invasive: Juniper Shrubland   193007   Native Invasive: Juniper Woodland   36778   Native Invasive: Deciduous Woodland   17950   Native Invasive: Mesquite - Creosotebush Shrubland   2331   Native Invasive: Deciduous - Juniper Woodland   1367   Native Invasive: Mesquite Woodland   101   Non-native Invasive: Saltcedar Shrubland   25  
  11. Conservation Opportunity Areas ž  Goals ž  Identify areas that provide

    best conservation value ž  Landowner incentives & stewardship have high impact ž  Transportation or development ž  Avoid site impacts to sensitive areas ž  Ecological equality or integrity in mitigation ž  Create baseline for future modeling and decision-making
  12. Species Terrestrial Ecological Index SpTEI (per EMS Poly) = Occupancy

    Confidence Rating x Potential Habitat Score Big  Horn   Sheep   Sonoran   Bumblebee   Ferruginous   Hawk       Cassin’s   Sparrow       Ornate  Box   Turtle   Massasagua       Mule   Deer   Pronghorn  
  13. Terrestrial Flora Ecological Index # of SGCN Species & Assoc.

    in an EMS Area of EMS Max # of SGCN Species & Assoc. Total Are of Ecoregion Raw TFLEI =
  14. Aquatic Ecological Index ž  HUC-12 Ranked based on SGCN Focal

    Species Distribution ž  EMS_T ranked 0 – 5 based on contribution to water quality
  15. ž  Delivery ž  Challenges ž  Desktop limitations ž  Processing &

    Storage ž  GIS Software ž  Expensive ž  Not user friendly ž  Solutions ž  Expert – Google Drive ž  Vector files ž  Phase ž  Ecoregion ž  Layperson – Google Maps Application ž  T.E.A.M. ž  Google Maps Delivery – Ecological Systems and Products
  16. Texas Ecosystem Analytical Mapper T.E.A.M Application ž  Goals —  Efficiently

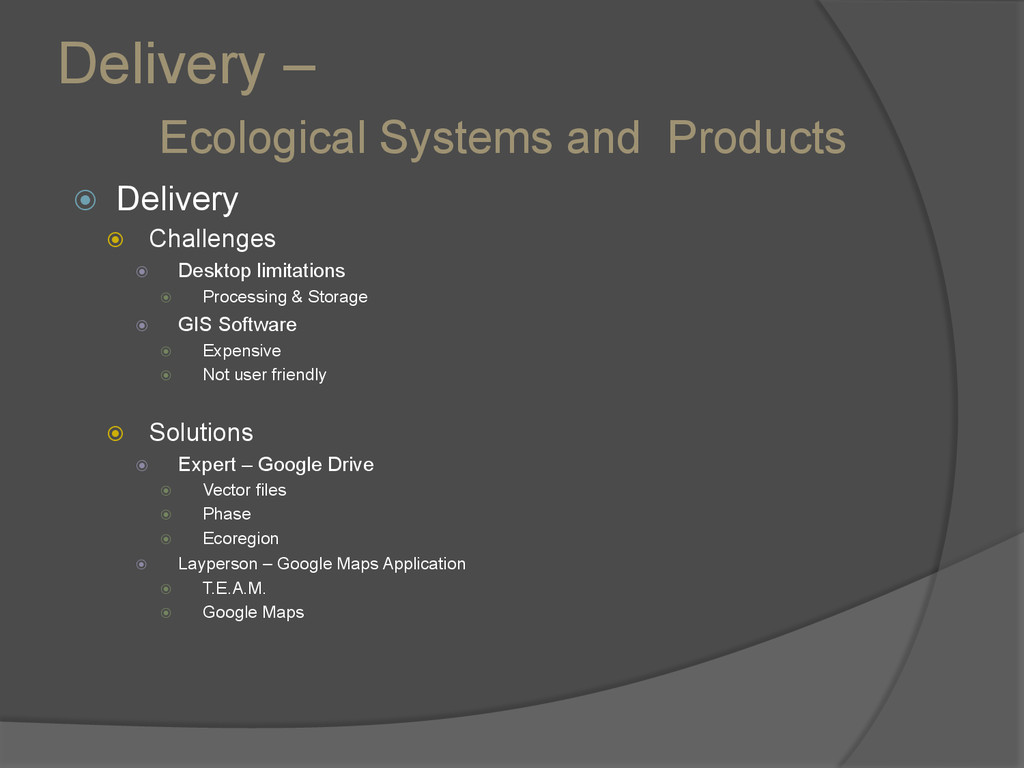
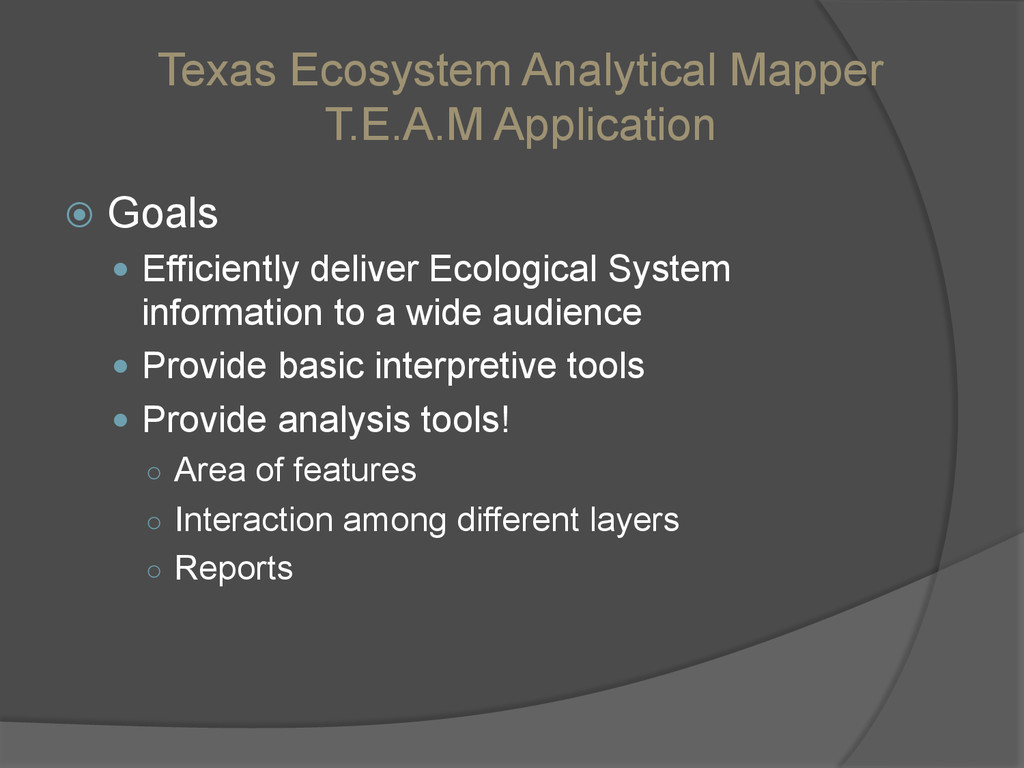
    deliver Ecological System information to a wide audience —  Provide basic interpretive tools —  Provide analysis tools! ◦  Area of features ◦  Interaction among different layers ◦  Reports
  17. Data available on TPWD website: http://www.tpwd.texas.gov/gis/gallery/ click (On right): Texas

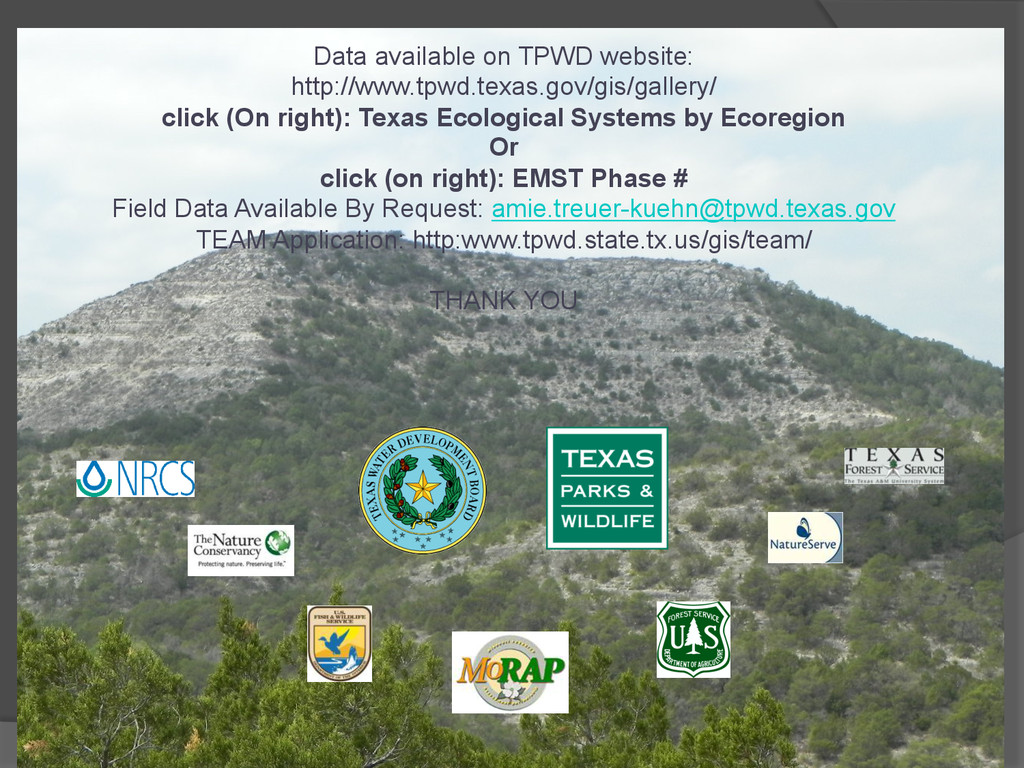
    Ecological Systems by Ecoregion Or click (on right): EMST Phase # Field Data Available By Request: [email protected] TEAM Application: http:www.tpwd.state.tx.us/gis/team/ THANK YOU