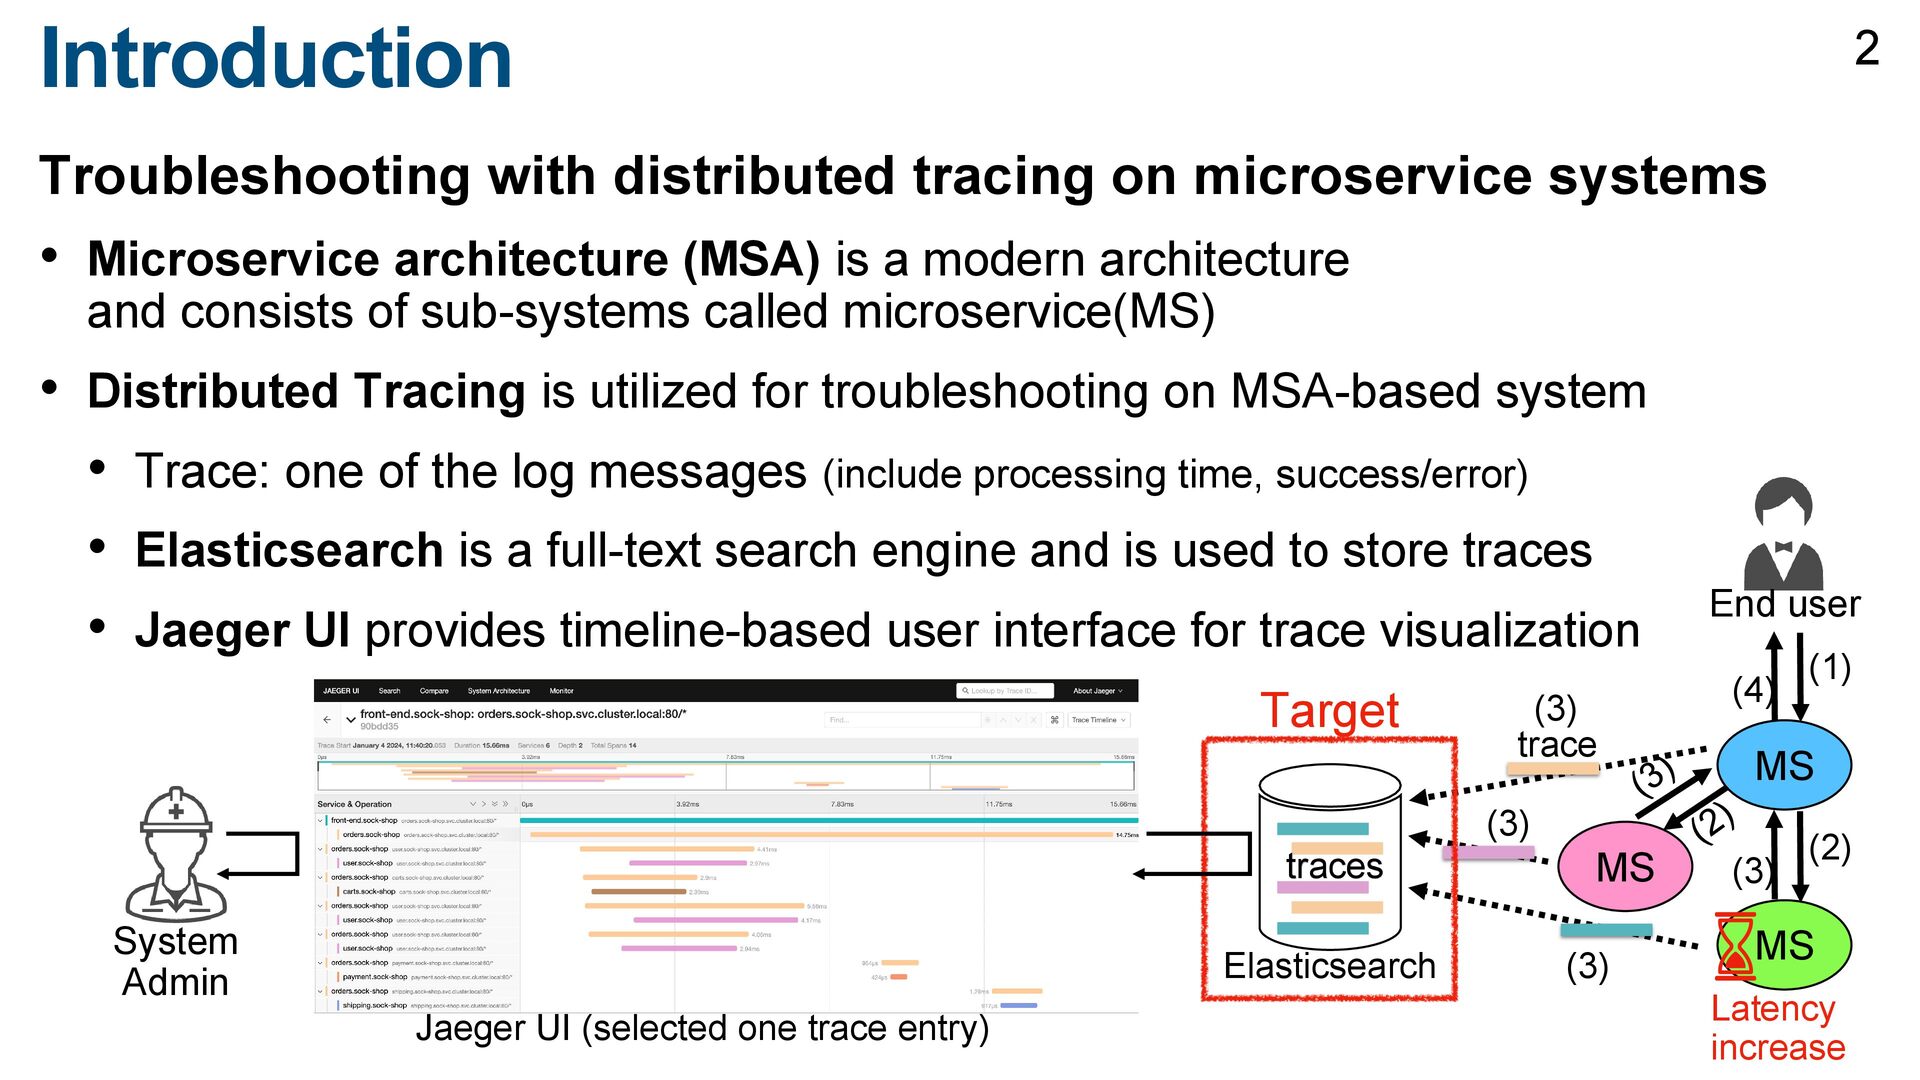
architecture (MSA) is a modern architecture and consists of sub-systems called microservice(MS) • Distributed Tracing is utilized for troubleshooting on MSA-based system • Trace: one of the log messages (include processing time, success/error) • Elasticsearch is a full-text search engine and is used to store traces • Jaeger UI provides timeline-based user interface for trace visualization MS MS MS End user (1) (2) (3) Elasticsearch Jaeger UI (selected one trace entry) Target trace traces System Admin 2 (4) (3) (3) (3) Latency increase
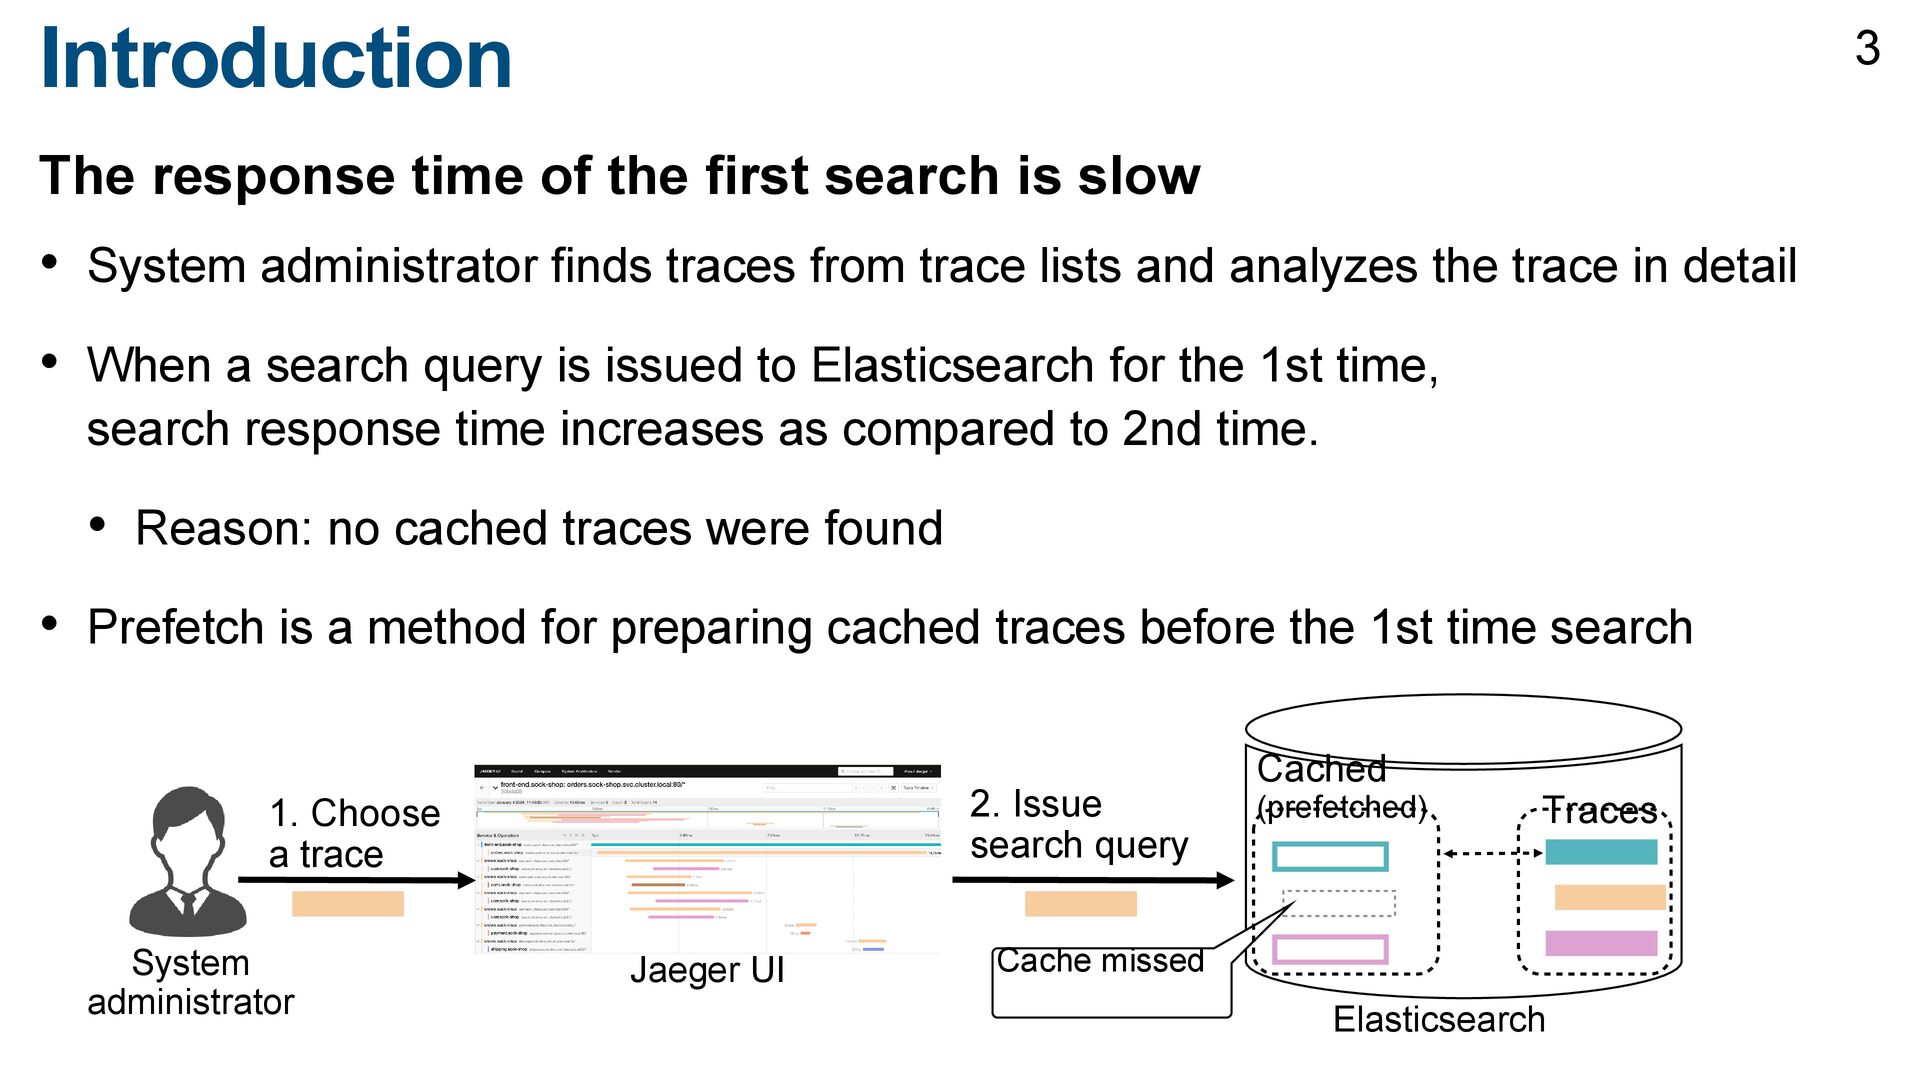
• System administrator finds traces from trace lists and analyzes the trace in detail • When a search query is issued to Elasticsearch for the 1st time, search response time increases as compared to 2nd time. • Reason: no cached traces were found • Prefetch is a method for preparing cached traces before the 1st time search 3 Elasticsearch System administrator Jaeger UI 1. Choose a trace 2. Issue search query Cache missed Traces Cached (prefetched)
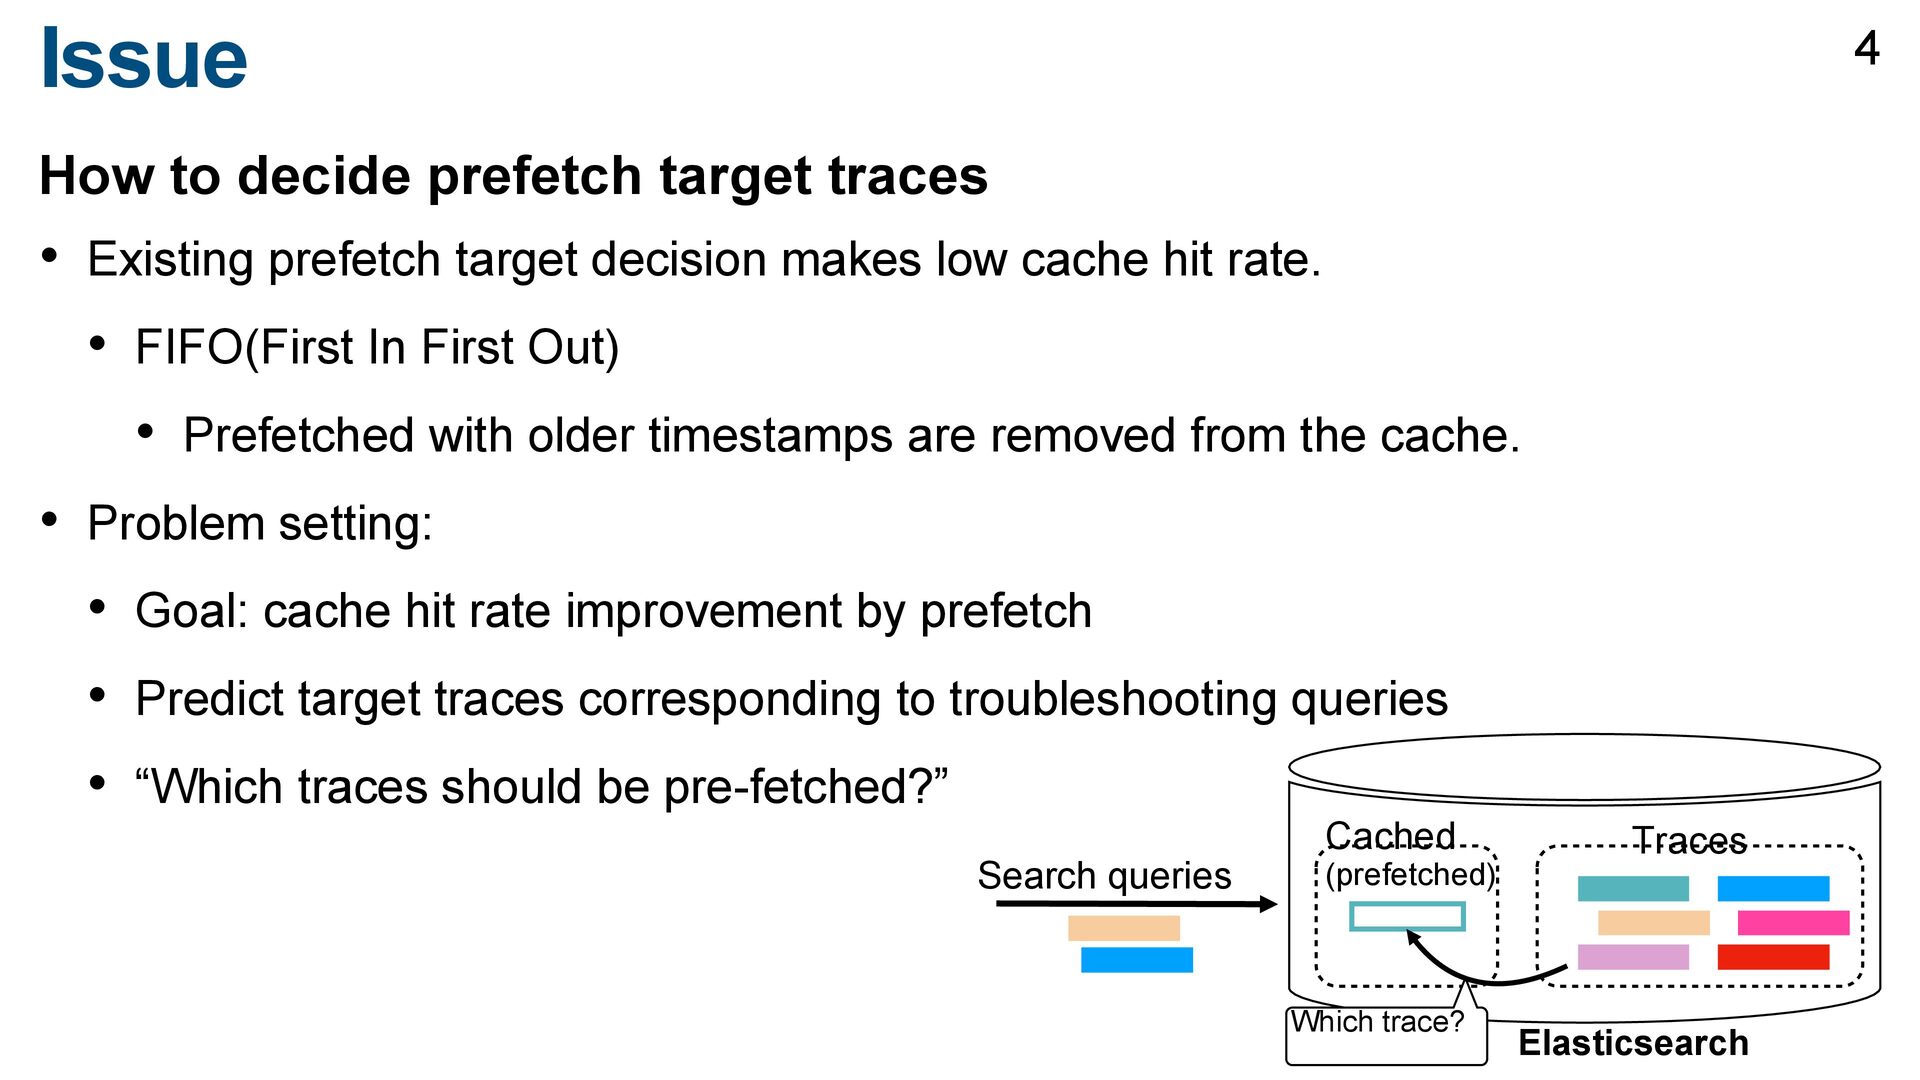
target decision makes low cache hit rate. • FIFO(First In First Out) • Prefetched with older timestamps are removed from the cache. • Problem setting: • Goal: cache hit rate improvement by prefetch • Predict target traces corresponding to troubleshooting queries • “Which traces should be pre-fetched?” 4 Elasticsearch Search queries Traces Cached (prefetched) Which trace?
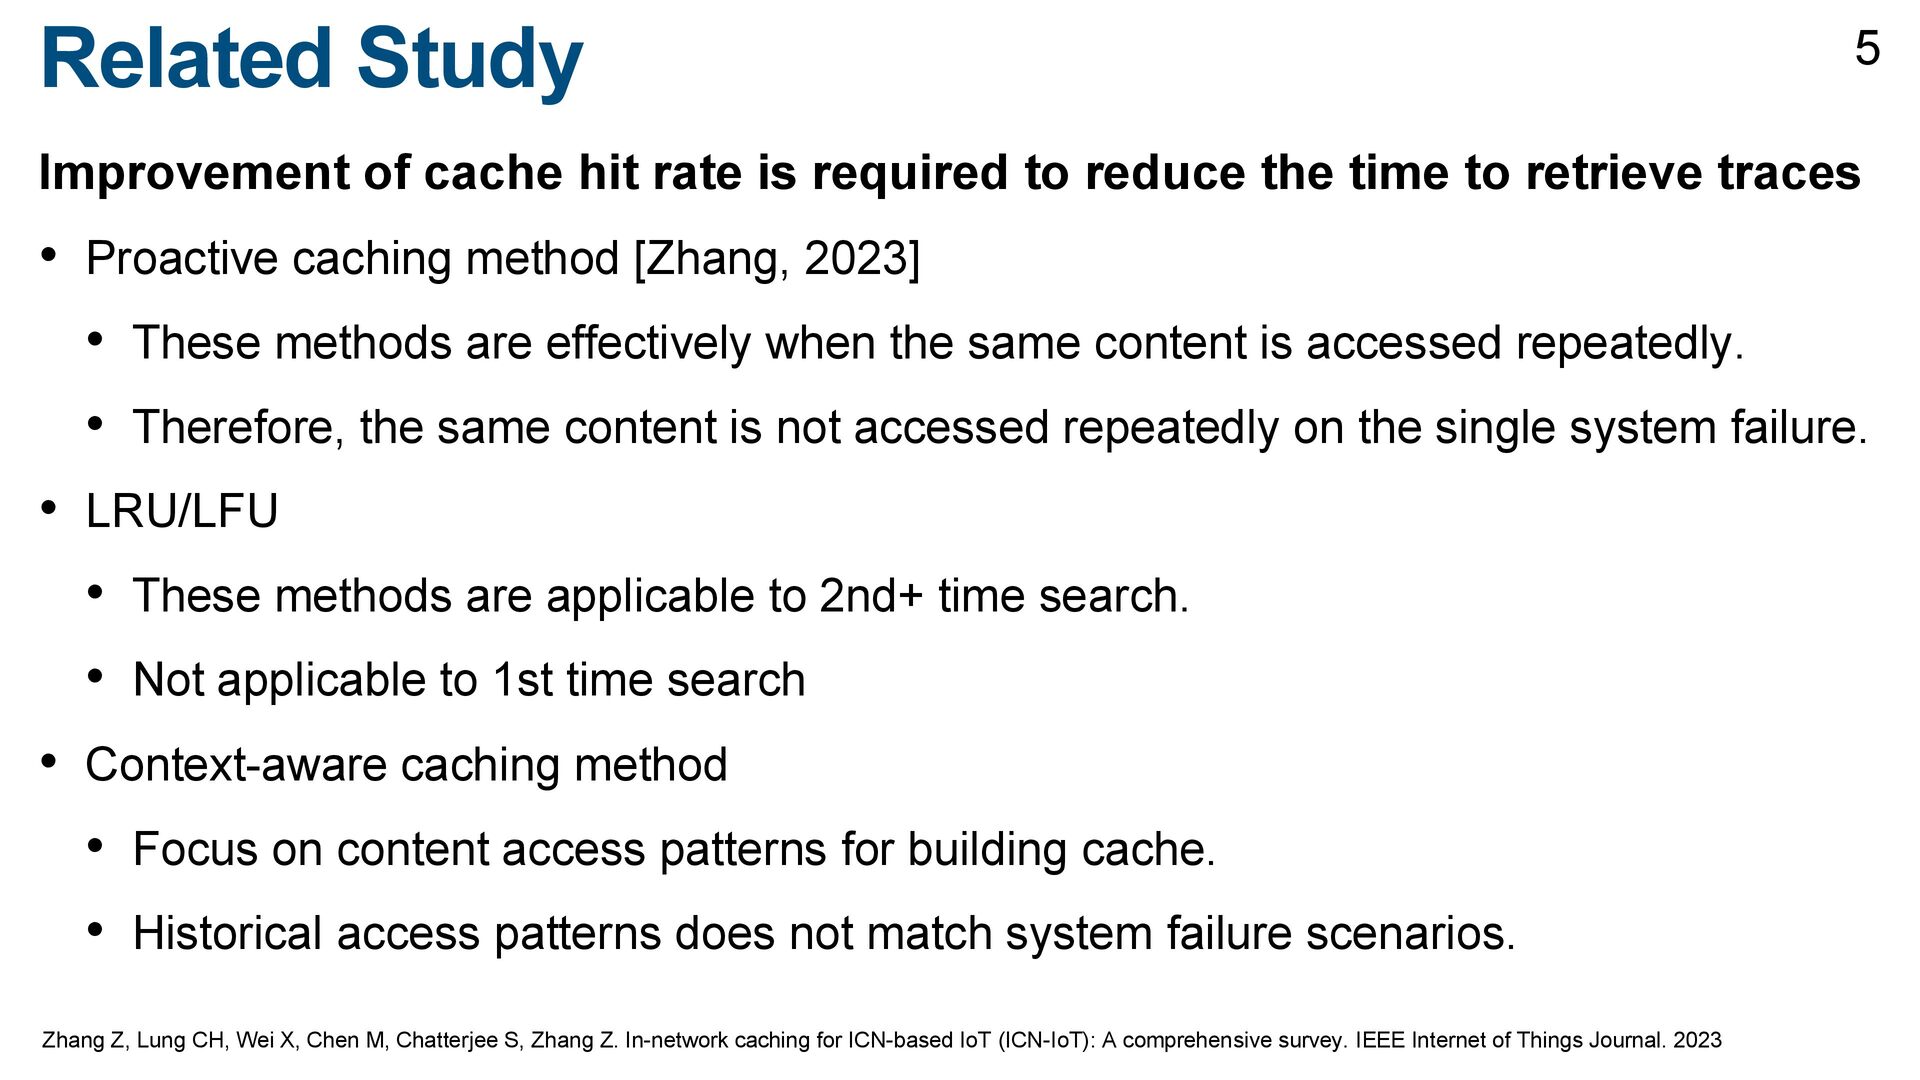
reduce the time to retrieve traces • Proactive caching method [Zhang, 2023] • These methods are effectively when the same content is accessed repeatedly. • Therefore, the same content is not accessed repeatedly on the single system failure. • LRU/LFU • These methods are applicable to 2nd+ time search. • Not applicable to 1st time search • Context-aware caching method • Focus on content access patterns for building cache. • Historical access patterns does not match system failure scenarios. Zhang Z, Lung CH, Wei X, Chen M, Chatterjee S, Zhang Z. In-network caching for ICN-based IoT (ICN-IoT): A comprehensive survey. IEEE Internet of Things Journal. 2023 5
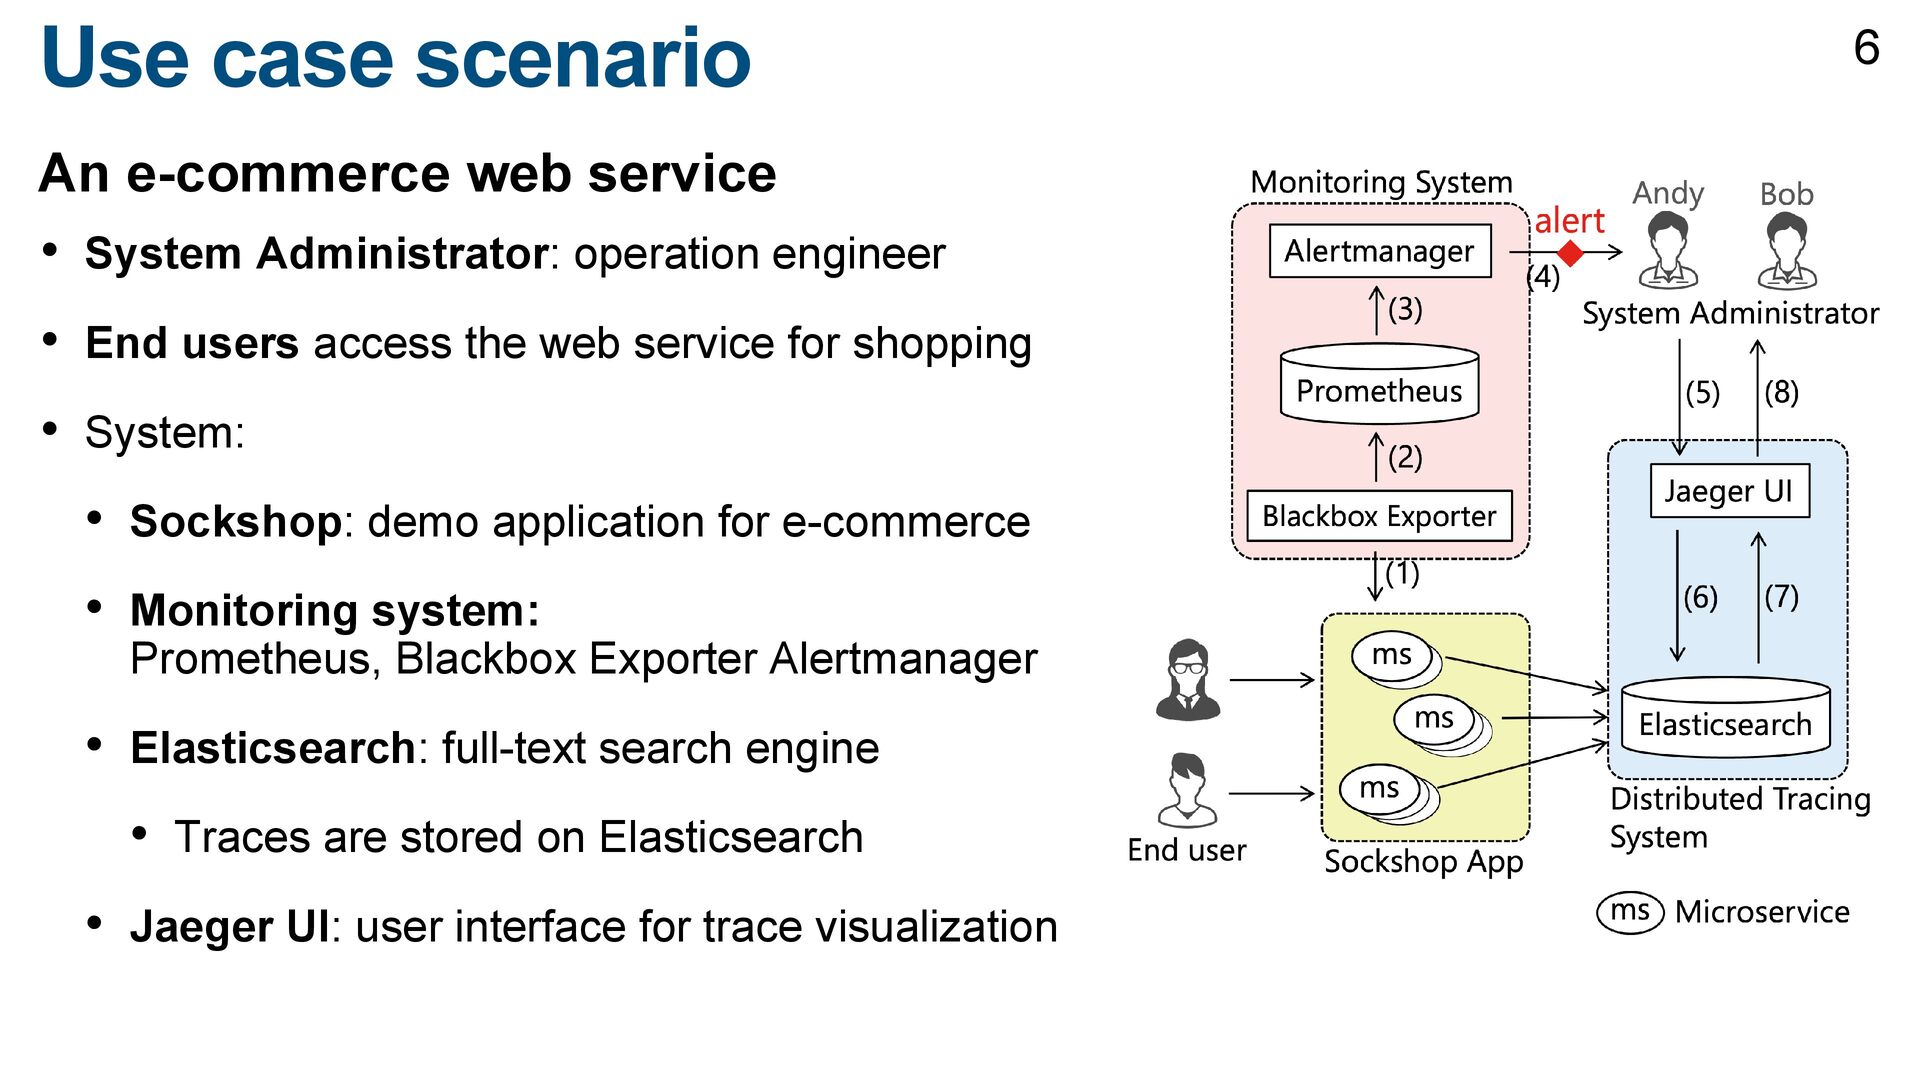
End users access the web service for shopping • System: • Sockshop: demo application for e-commerce • Monitoring system: Prometheus, Blackbox Exporter Alertmanager • Elasticsearch: full-text search engine • Traces are stored on Elasticsearch • Jaeger UI: user interface for trace visualization Use case scenario 6
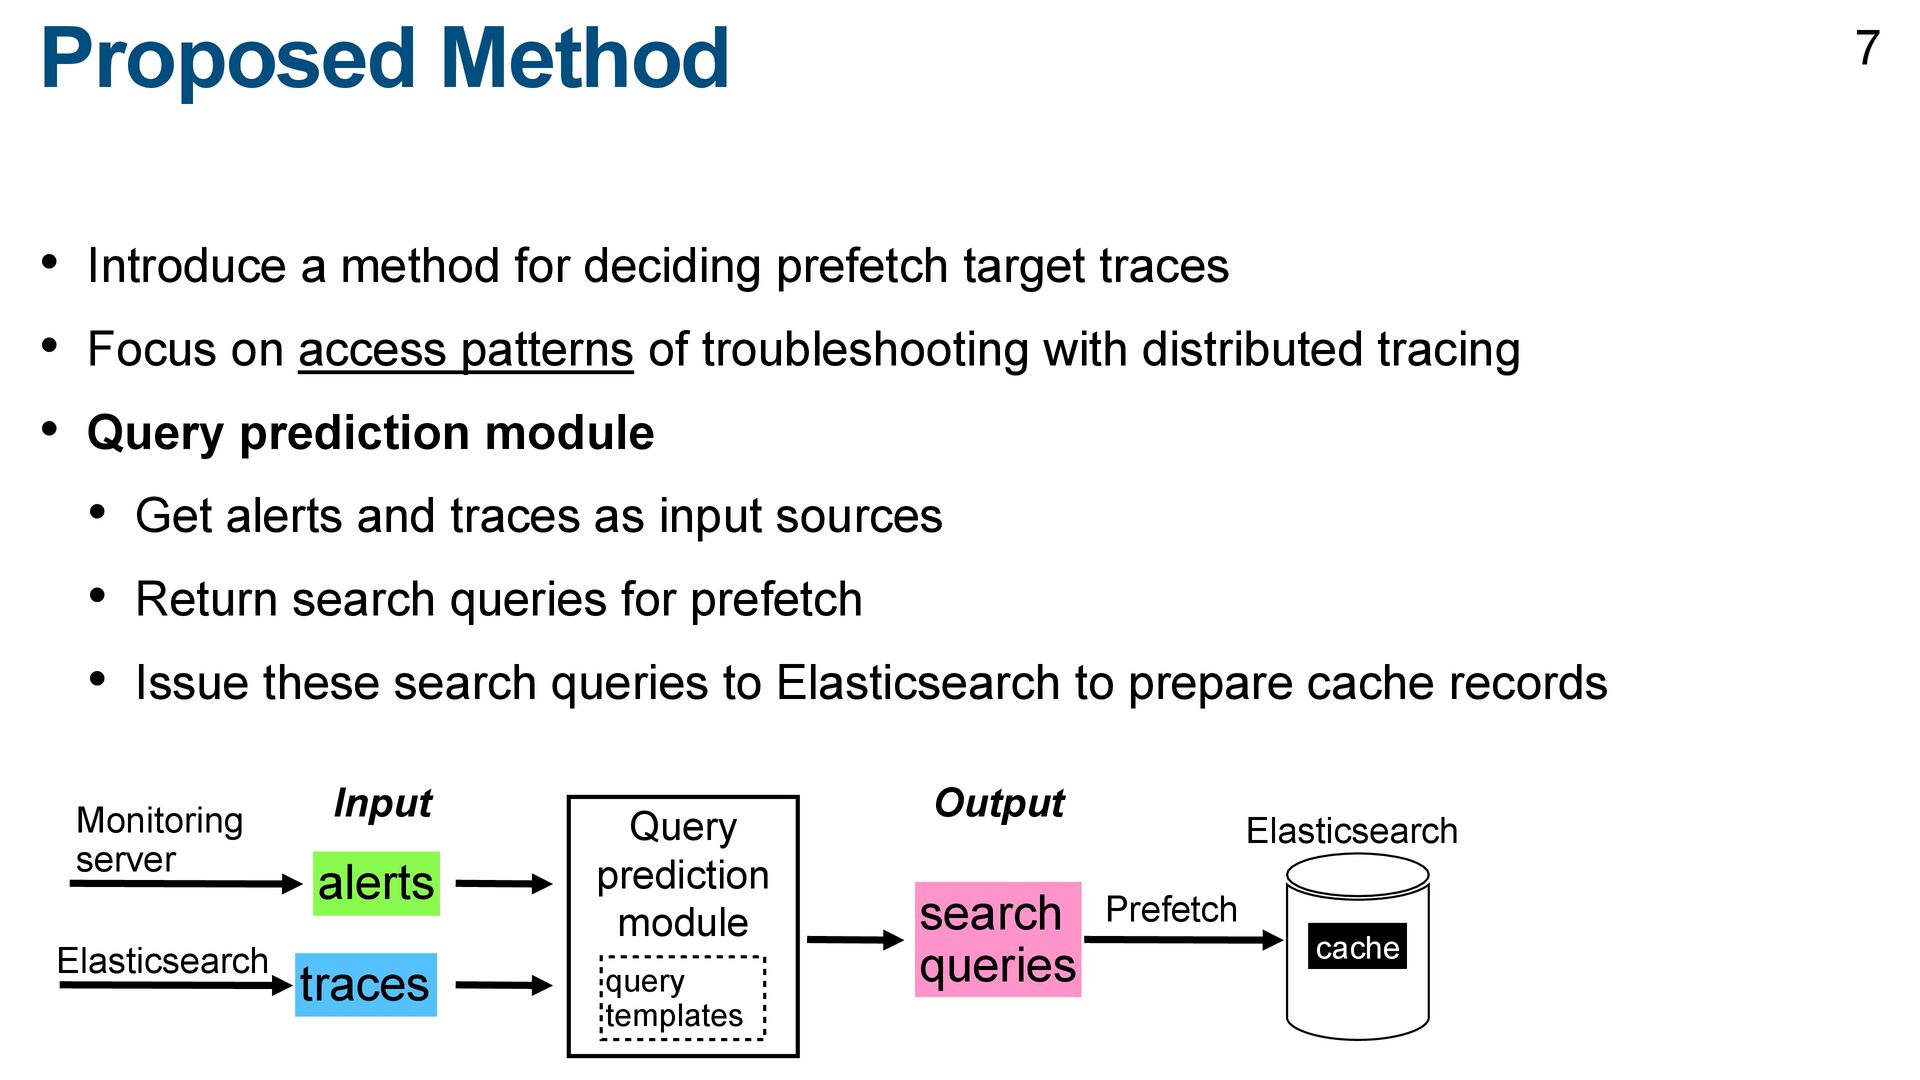
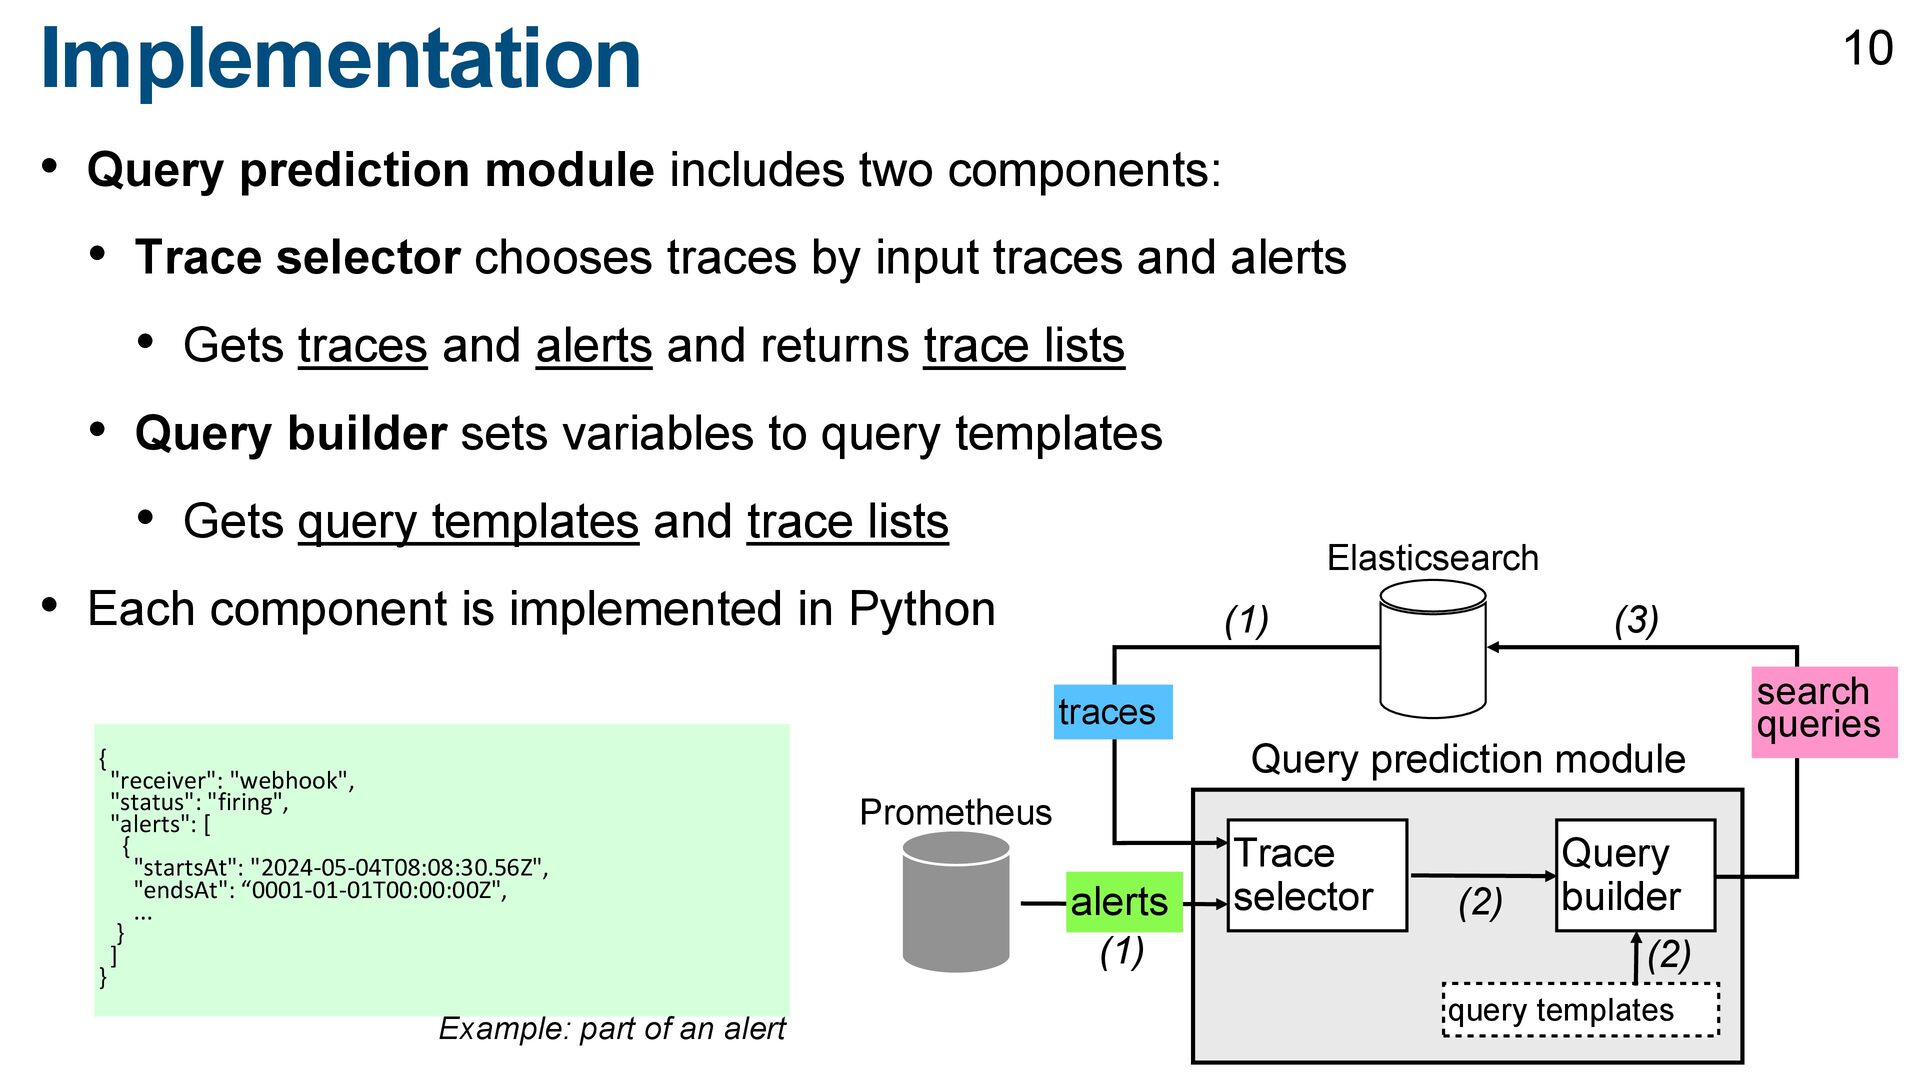
traces • Focus on access patterns of troubleshooting with distributed tracing • Query prediction module • Get alerts and traces as input sources • Return search queries for prefetch • Issue these search queries to Elasticsearch to prepare cache records Query prediction module alerts traces Output Input search queries Monitoring server Elasticsearch Prefetch Elasticsearch query templates cache 7
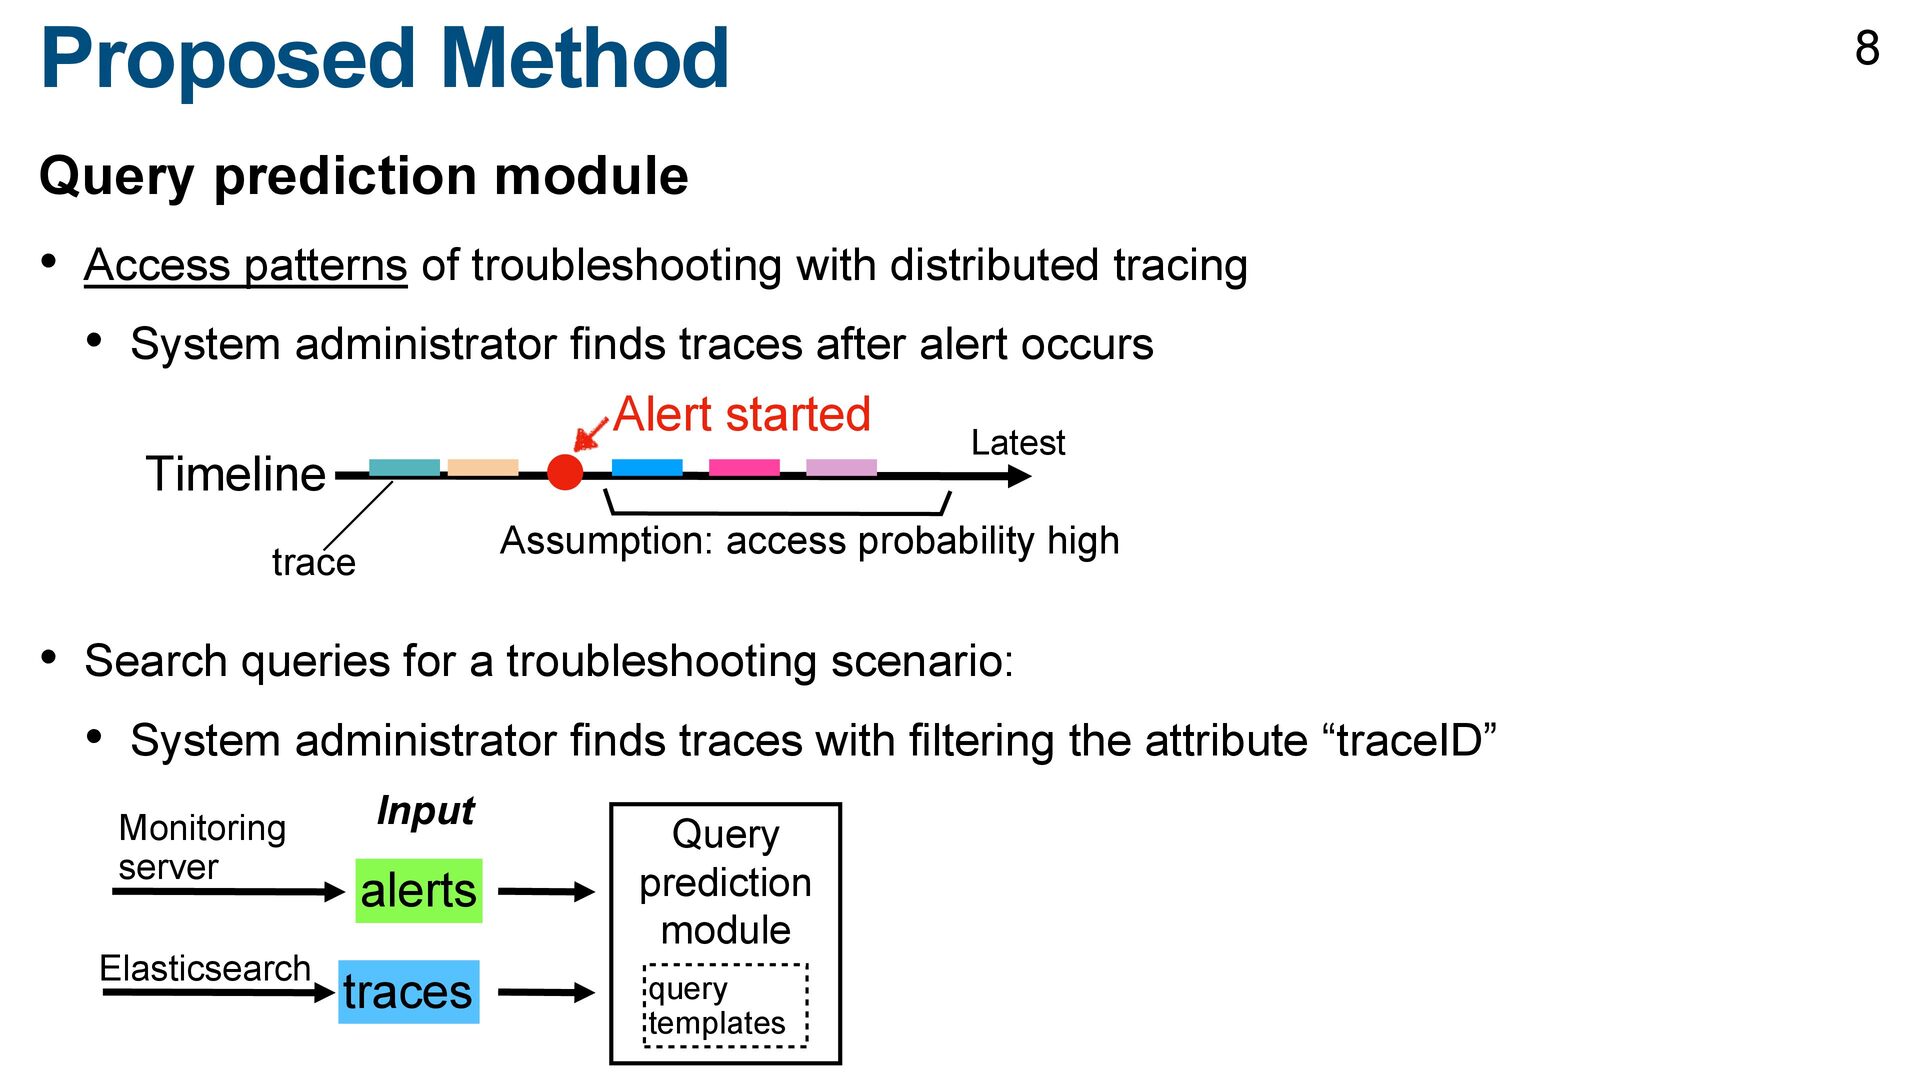
with distributed tracing • System administrator finds traces after alert occurs • Search queries for a troubleshooting scenario: • System administrator finds traces with filtering the attribute “traceID” Query prediction module alerts traces Input Monitoring server Elasticsearch query templates 8 Timeline Alert started Latest Assumption: access probability high trace
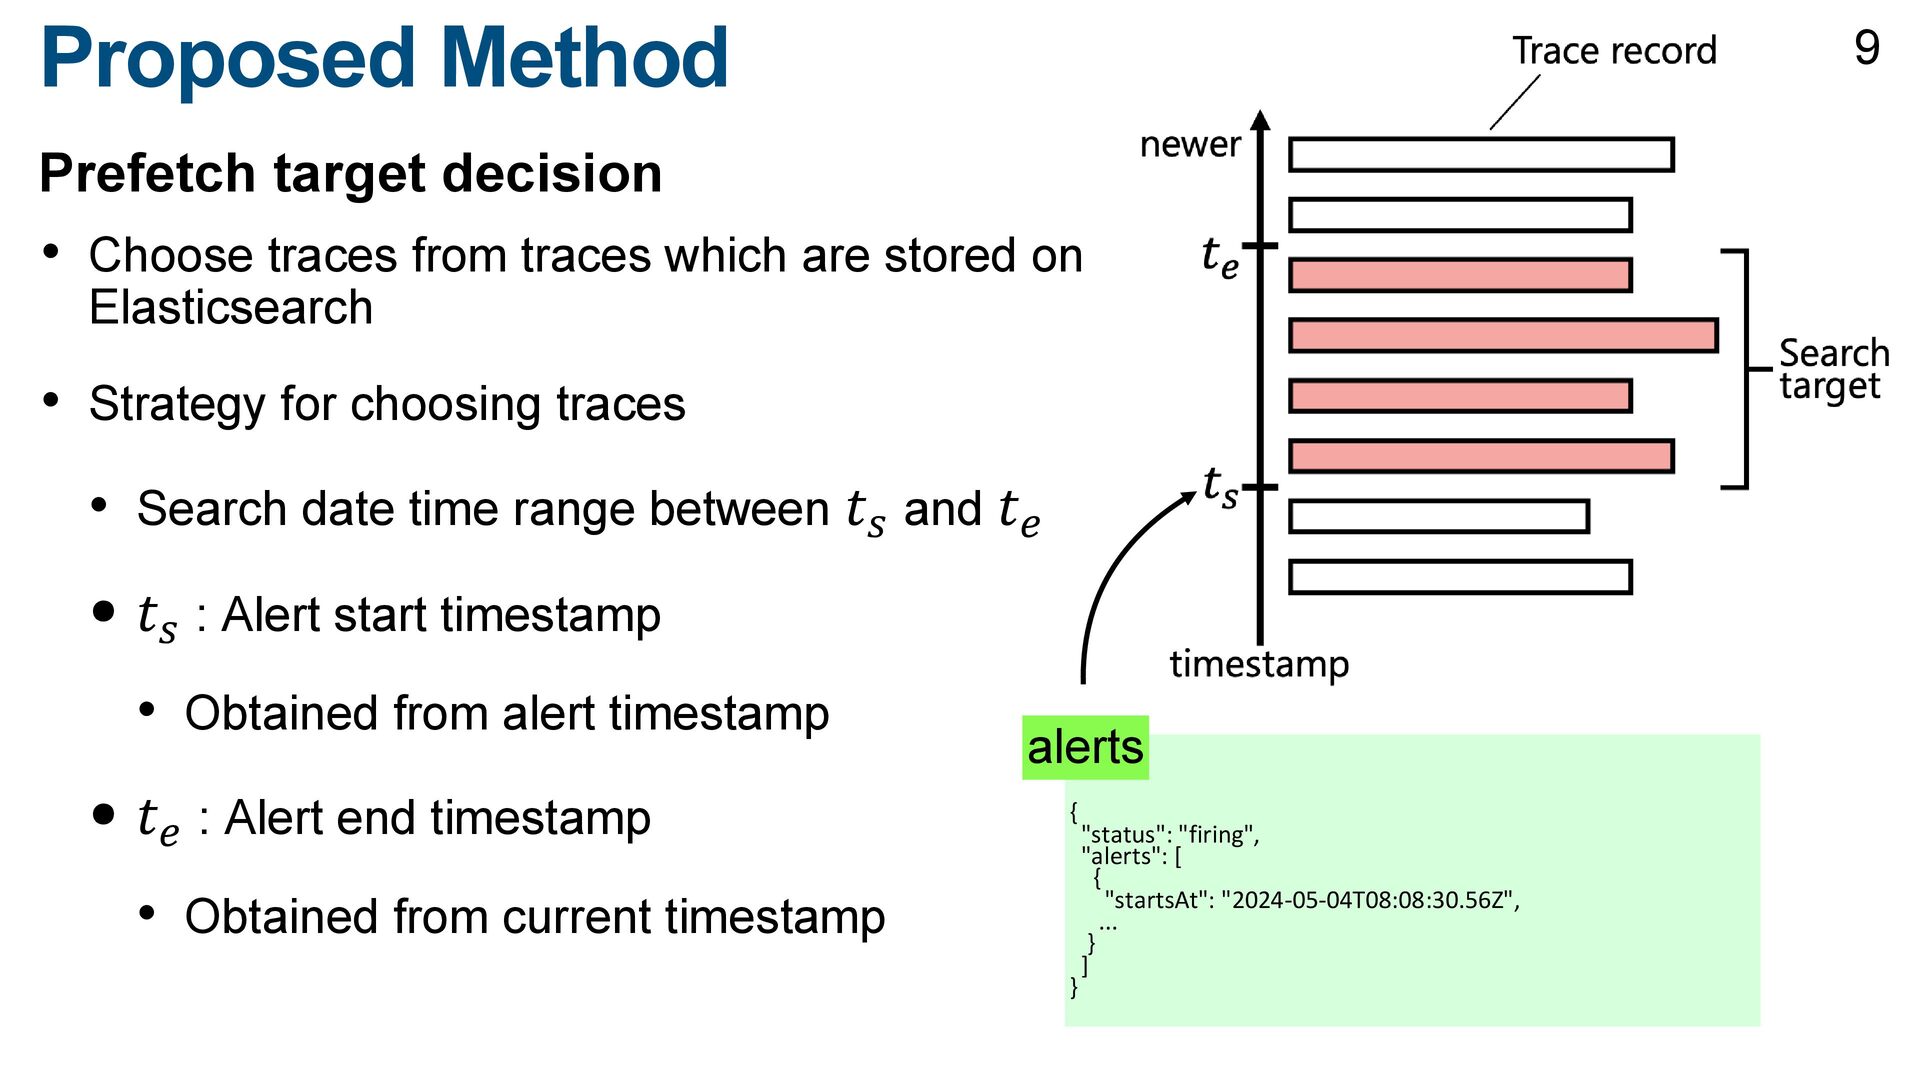
stored on Elasticsearch • Strategy for choosing traces • Search date time range between 𝑡𝑠 and 𝑡𝑒 • 𝑡𝑠 : Alert start timestamp • Obtained from alert timestamp • 𝑡𝑒 : Alert end timestamp • Obtained from current timestamp Proposed Method 9 { "status": "firing", "alerts": [ { "startsAt": "2024-05-04T08:08:30.56Z", ... } ] } alerts
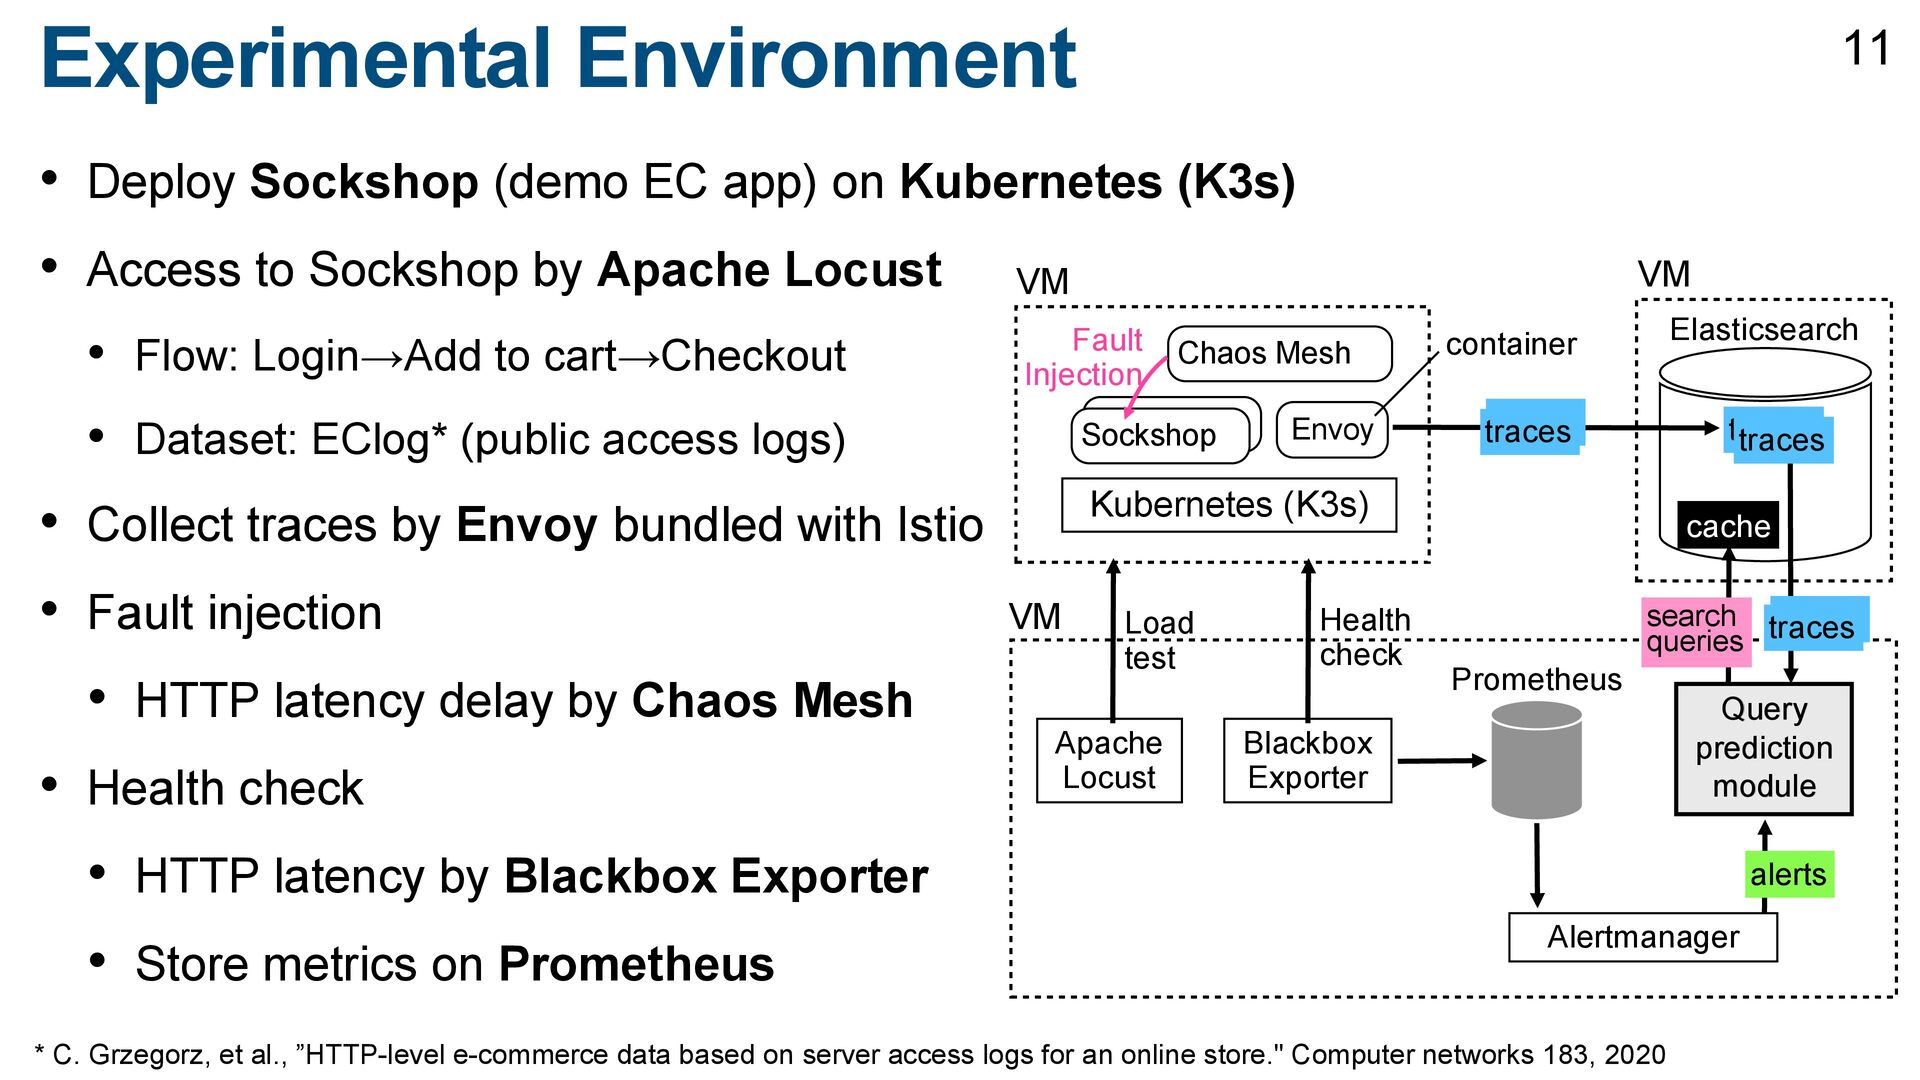
(K3s) • Access to Sockshop by Apache Locust • Flow: Login→Add to cart→Checkout • Dataset: EClog* (public access logs) • Collect traces by Envoy bundled with Istio • Fault injection • HTTP latency delay by Chaos Mesh • Health check • HTTP latency by Blackbox Exporter • Store metrics on Prometheus 11 * C. Grzegorz, et al., ”HTTP-level e-commerce data based on server access logs for an online store." Computer networks 183, 2020 Query prediction module Elasticsearch cache Prometheus Apache Locust Blackbox Exporter alerts Alertmanager Kubernetes (K3s) Sockshop Envoy Sockshop traces search queries VM container Health check Load test traces traces traces traces traces Chaos Mesh Fault Injection VM VM
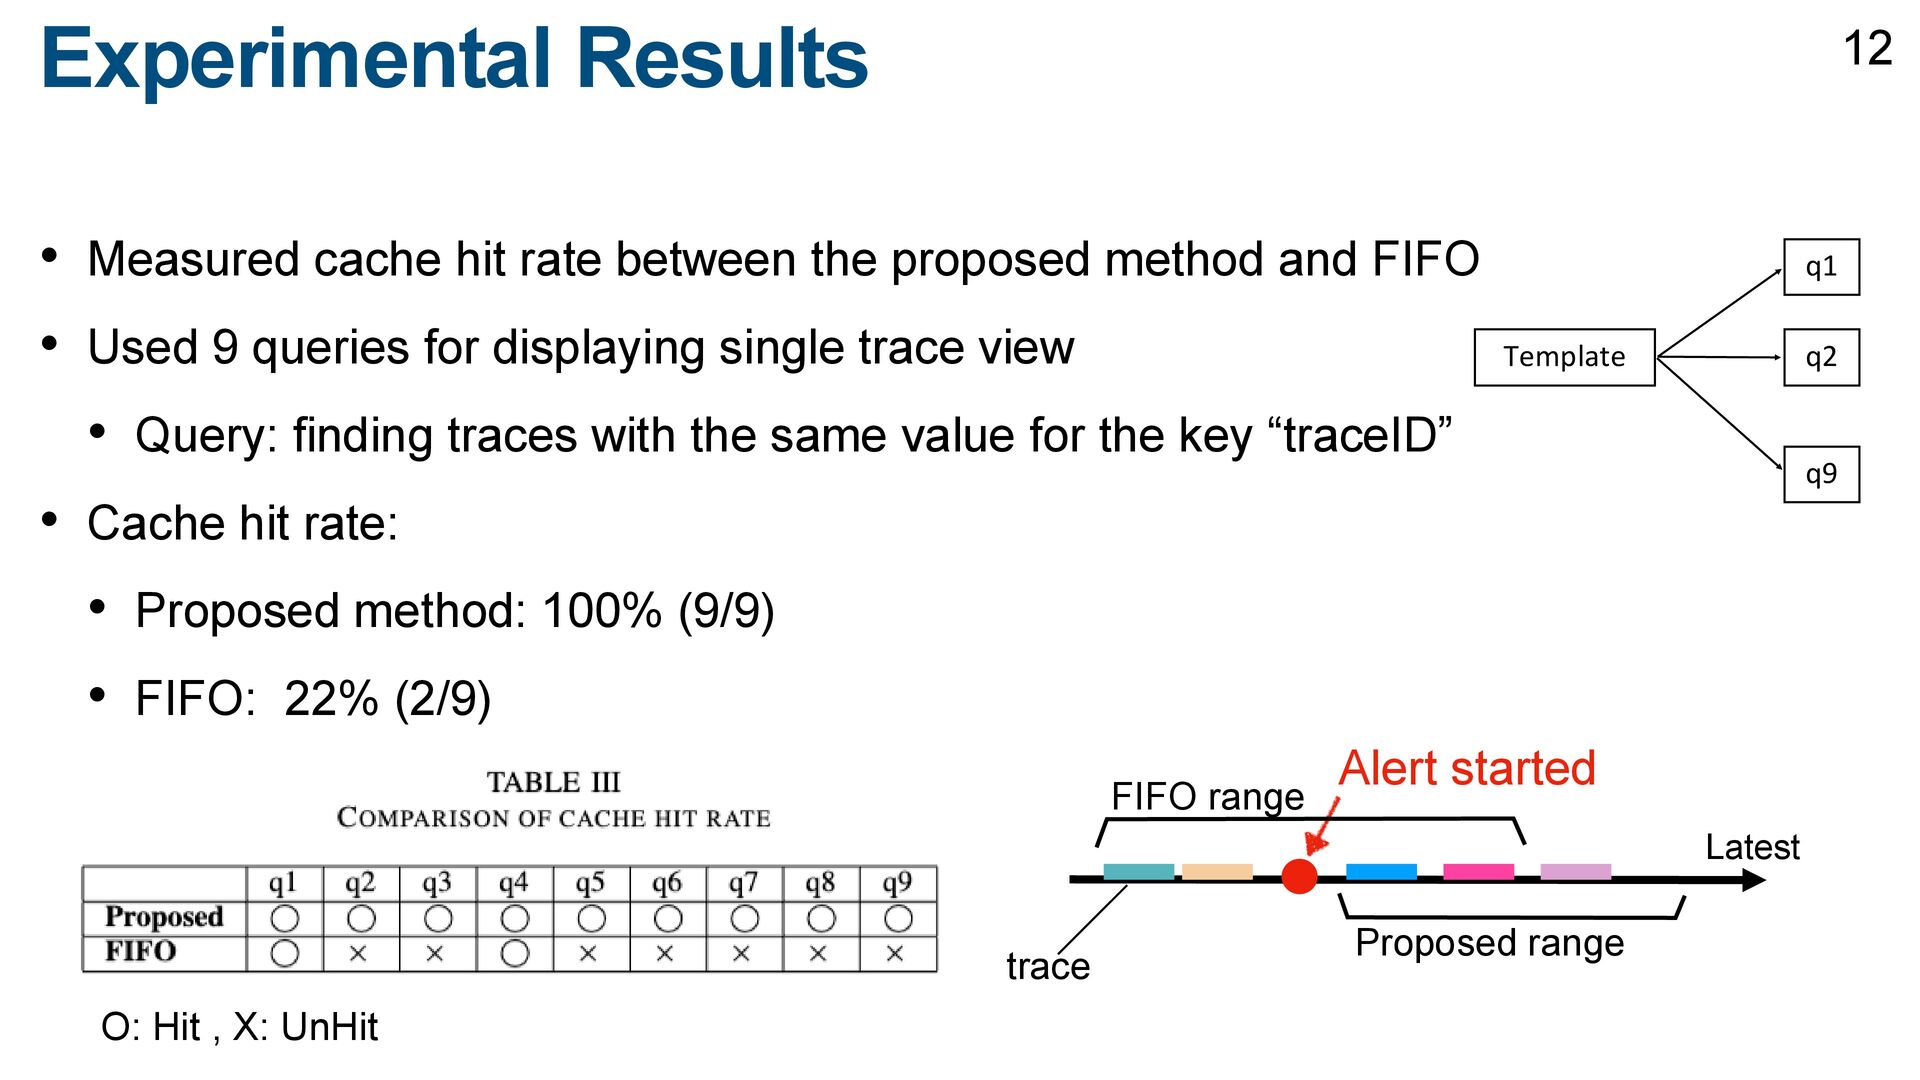
method and FIFO • Used 9 queries for displaying single trace view • Query: finding traces with the same value for the key “traceID” • Cache hit rate: • Proposed method: 100% (9/9) • FIFO: 22% (2/9) q1 Template O: Hit , X: UnHit 12 q2 q9 Alert started Latest trace FIFO range Proposed range
on the first search • Achieve this by preparing cache before queries are issued • Issue • The cache hit rate is low for the first search because of prefetching methods • Proposed method • Determined prefetch target queries using alerts and traces • Results • The proposed method improved 78% compared with FIFO 13