Upgrade to Pro — share decks privately, control downloads, hide ads and more …

Genetic Algorithms for Propensity Score Matching: Evaluation of Project Lead The Way in College Persistence

Genetic Algorithms for Propensity Score Matching: Evaluation of Project Lead The Way in College Persistence

Presented at American Education Research Association (AERA) 2012 in Vancouver. CA.

Tom Schenk Jr

May 24, 2012
Tweet

More Decks by Tom Schenk Jr

Other Decks in Research

Transcript

  1. Community College Leadership Program
    Office of Community College Research and Policy
    Genetic Algorithms for Propensity
    Score Matching
    Evaluation of Project Lead the Way in College
    Persistence
    Iowa State University
    Soko S. Starobin; Frankie Santos Laanan; Darin
    Moeller; Yu Chen
    Statistical Consultant
    Tom Schenk, Jr.
    University of Iowa
    David Rethwisch
    Evaluation Consultant
    Melissa Chapman-Haynes

    View Slide

  2. www.cclp.hs.iastate.edu
    The “Recent” STEM Focus


    View Slide

  3. www.cclp.hs.iastate.edu
    Project Lead the Way


    View Slide

  4. www.cclp.hs.iastate.edu
    Project Lead the Way in Iowa


    View Slide

  5. www.cclp.hs.iastate.edu
    Previous Findings


    View Slide

  6. www.cclp.hs.iastate.edu
    Data Sources & Methods

    View Slide

  7. www.cclp.hs.iastate.edu
    Hypothetical Model
    Demographic
    Characteristics
    Ethnicity
    Gender
    Free/Reduced
    Lunch
    Gifted/Talented
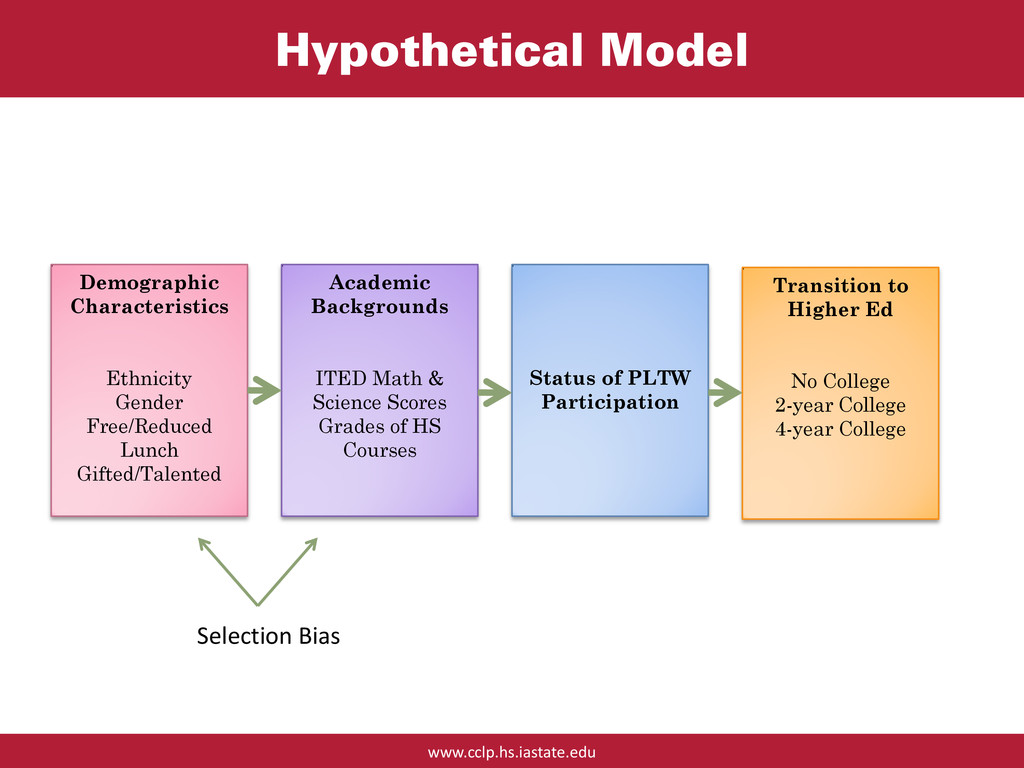
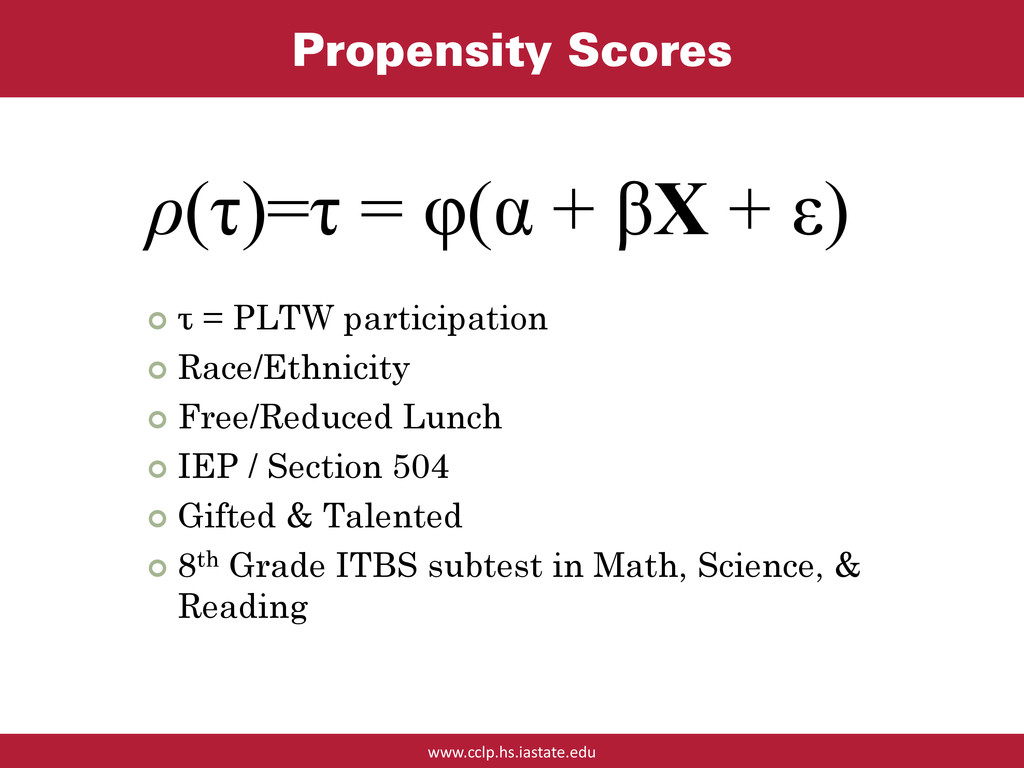
    Academic
    Backgrounds
    ITED Math &
    Science Scores
    Grades of HS
    Courses
    Status of PLTW
    Participation
    Transition to
    Higher Ed
    No College
    2-year College
    4-year College
    Selection Bias

    View Slide

  8. www.cclp.hs.iastate.edu
    Pre-enrollment Characteristics
    20
    40
    60
    80
    100
    Non-PLTW PLTW
    Gifted & Talented
    20
    40
    60
    80
    100
    Non-PLTW PLTW
    Male
    20
    40
    60
    80
    100
    Non-PLTW PLTW
    Caucasian
    20
    40
    60
    80
    100
    Non-PLTW PLTW
    IEP
    20
    40
    60
    80
    100
    Non-PLTW PLTW
    Section 504
    20
    40
    60
    80
    100
    Non-PLTW PLTW
    Free/Reduced Lunch

    View Slide

  9. www.cclp.hs.iastate.edu
    Transition to Higher Education
    Postsecondary
    Enrollment
    PLTW Participation
    Total
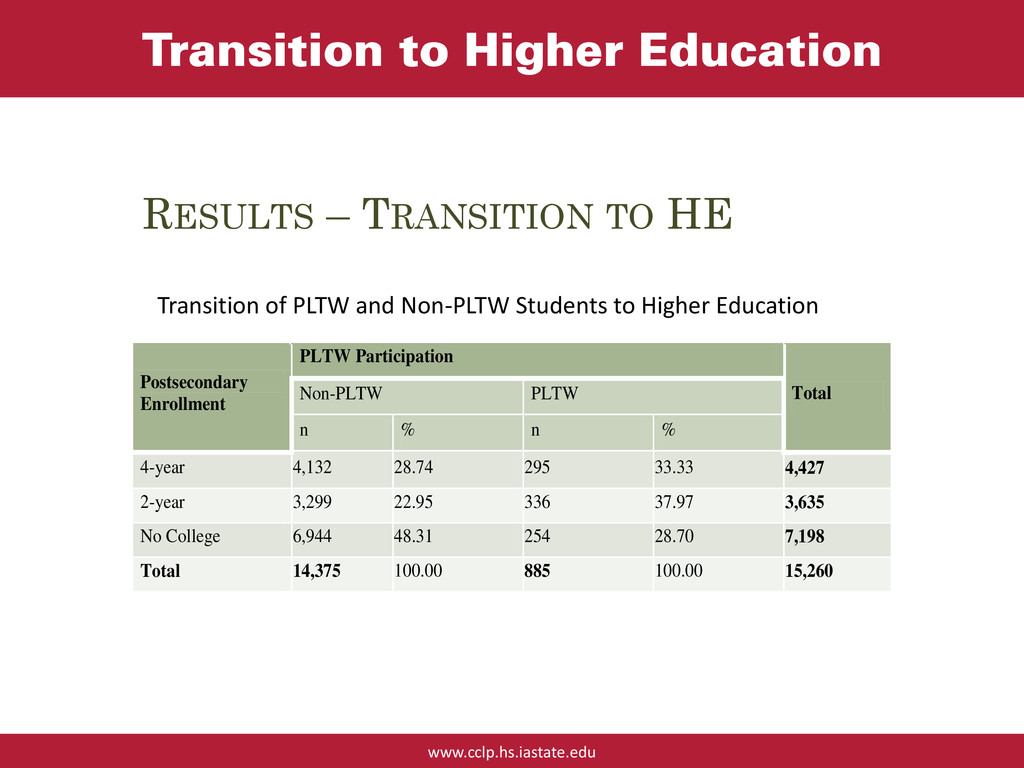
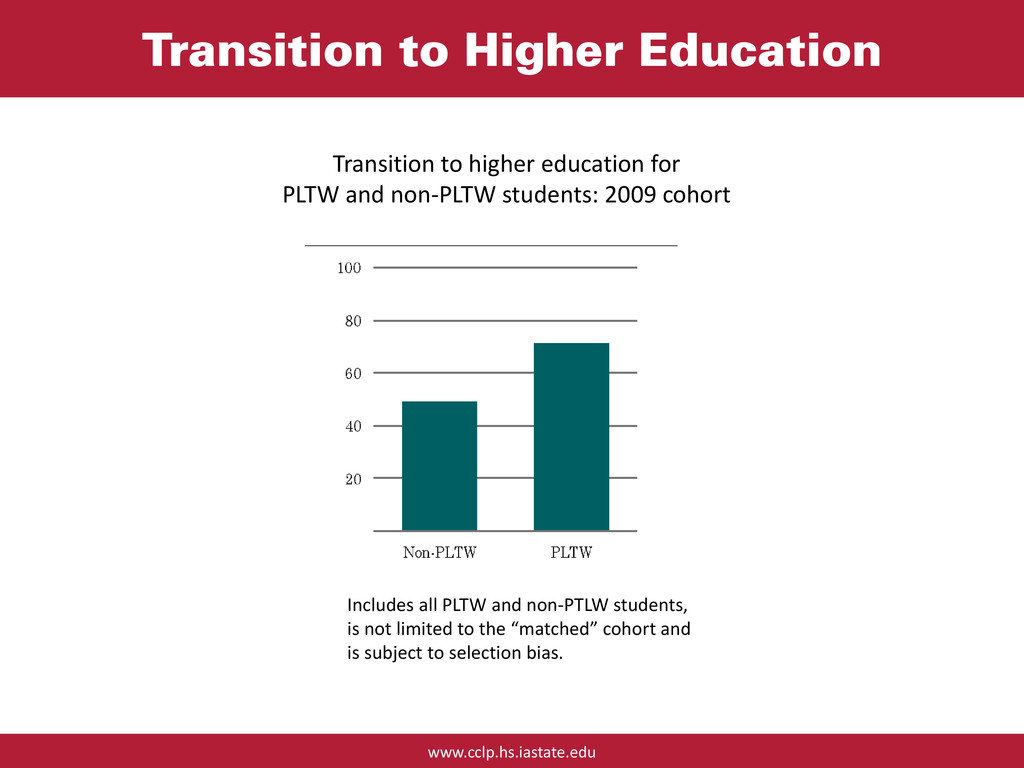
    Non-PLTW PLTW
    n % n %
    4-year 4,132 28.74 295 33.33 4,427
    2-year 3,299 22.95 336 37.97 3,635
    No College 6,944 48.31 254 28.70 7,198
    Total 14,375 100.00 885 100.00 15,260
    Transition of PLTW and Non-PLTW Students to Higher Education
    RESULTS – TRANSITION TO HE

    View Slide

  10. www.cclp.hs.iastate.edu
    Transition to Higher Education
    Includes all PLTW and non-PTLW 
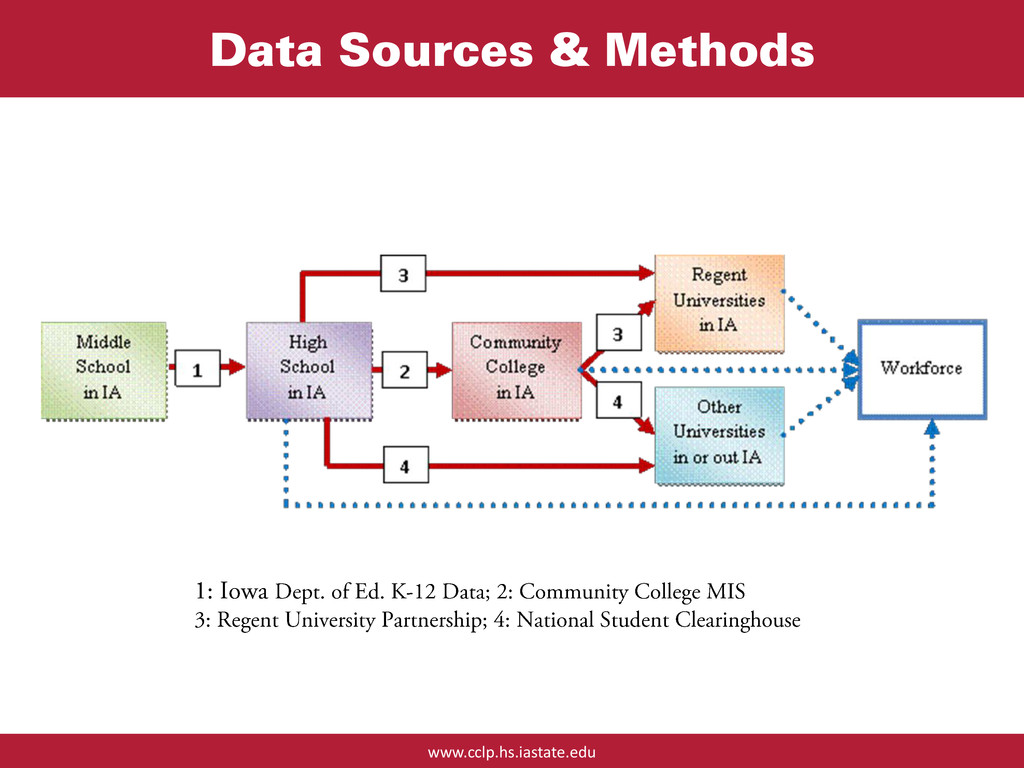
students,
    is not limited to the “matched” cohort and
    is subject to selection bias.
    Transition to higher education for
    PLTW and non-PLTW students: 2009 cohort

    View Slide

  11. www.cclp.hs.iastate.edu
    Propensity Scores
     τ = PLTW participation
     Race/Ethnicity
     Free/Reduced Lunch
     IEP / Section 504
     Gifted & Talented
     8th Grade ITBS subtest in Math, Science, &
    Reading
    ρ(τ)=τ = φ(α + βX + ε)

    View Slide

  12. www.cclp.hs.iastate.edu
    Nearest Neighbor Matching
    0
    0.1
    0.2
    0.3
    0.4
    0.5
    0.6
    Estimated propensity E[p(X)]: PLTW: solid, non-PLTW: dashed
    Treated Units from lowest to highest estimated propensity score

    View Slide

  13. Matching Methods
    Participants
    Non-participants
    dNN,i
    = ║xτ,i
    – x τ’,i

    D = Σ di
    Local minima
    dG,i
    = wi
    ║xτ,i
    – x τ’,i

    D = Σ di
    Global minima
    NEAREST NEIGHBOR GENETIC ALGORITHMS
    w = {w1
    ,…,wn
    }

    View Slide

  14. www.cclp.hs.iastate.edu
    Generalized Mahalanobis Distance
    GMD
    ,
    , =


    −1
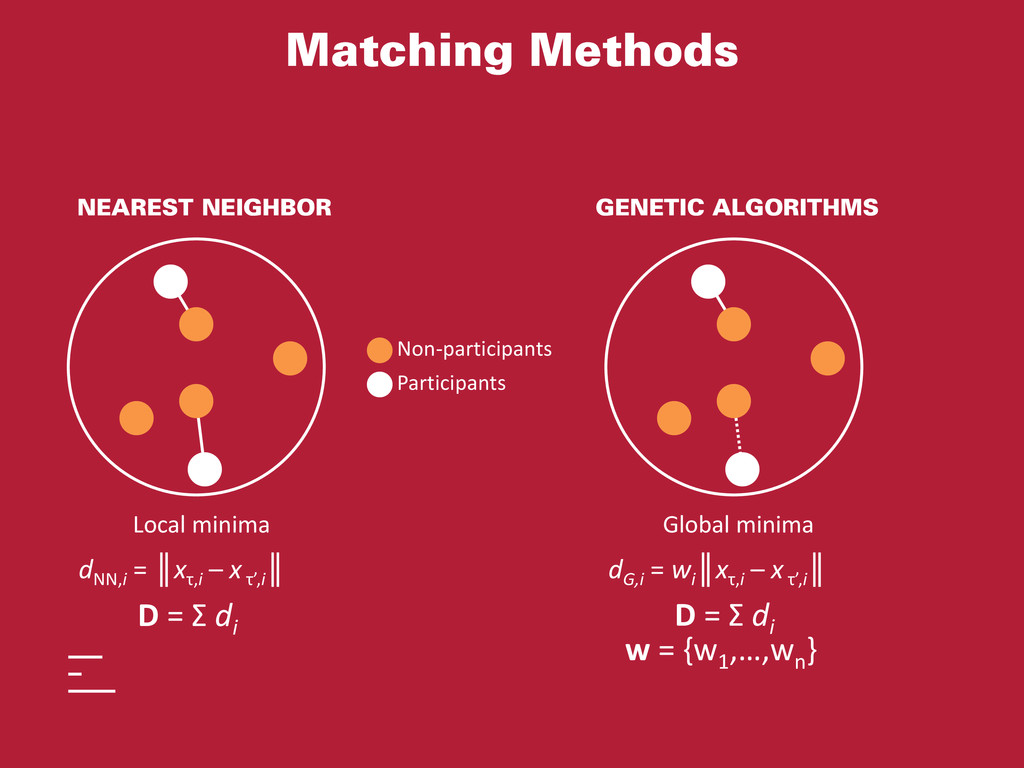
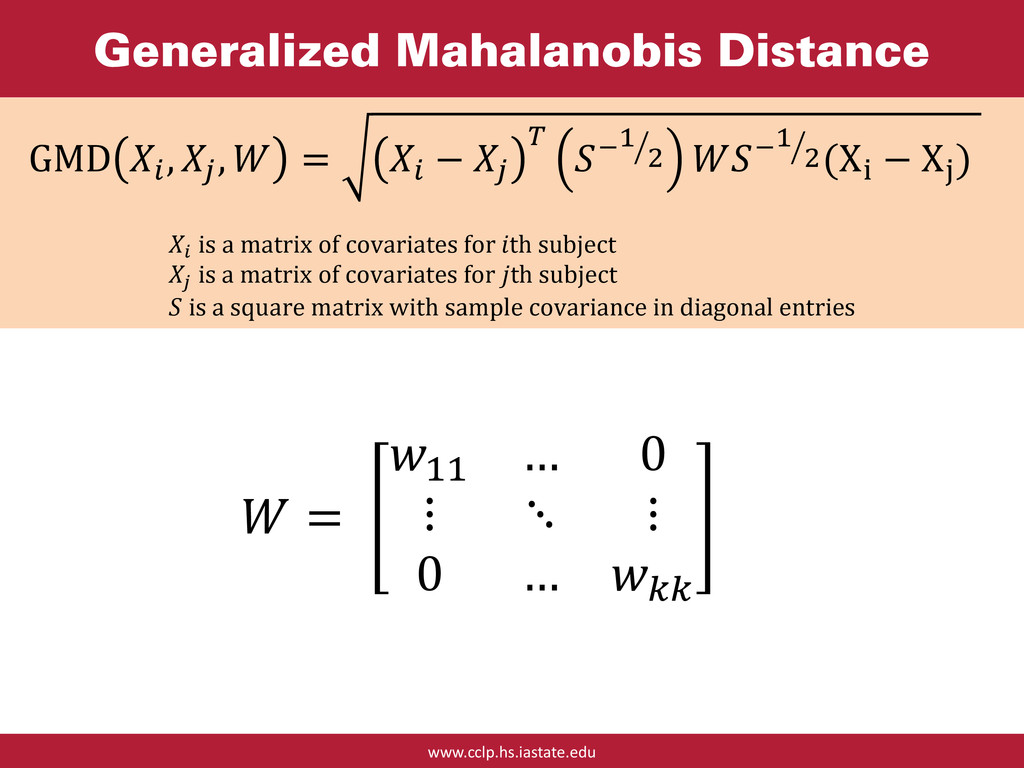
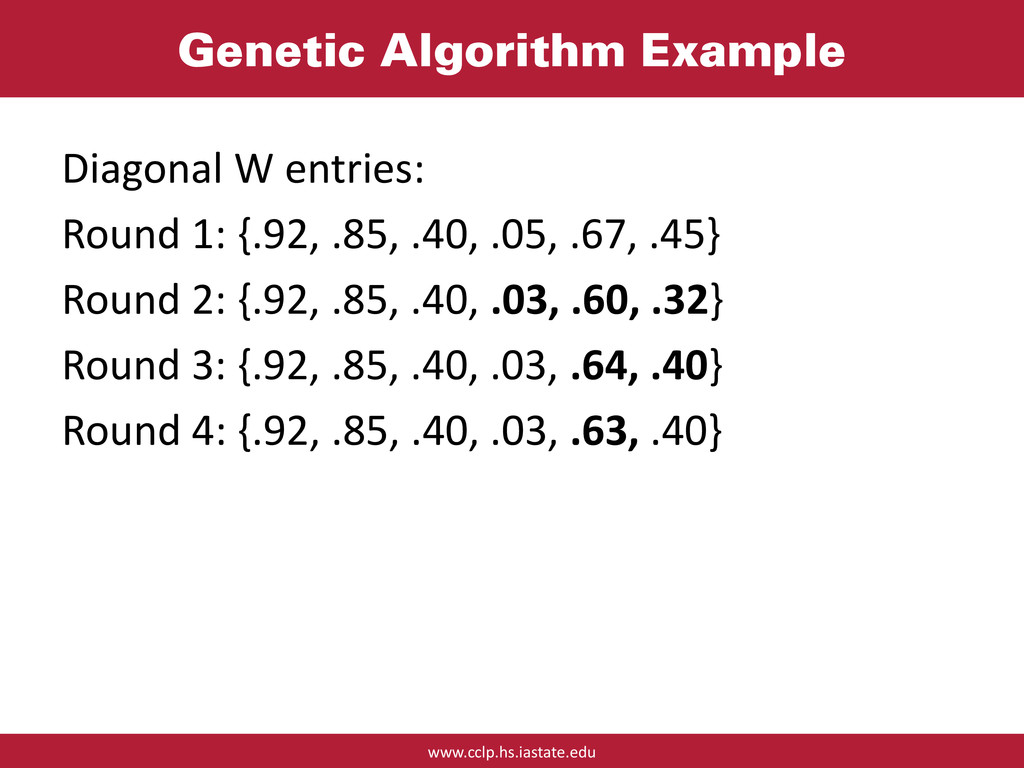
    2 −1
    2 (Xi
    − Xj
    )

    is a matrix of covariates for th subject

    is a matrix of covariates for th subject
    is a square matrix with sample covariance in diagonal entries
    =
    11
    … 0
    ⋮ ⋱ ⋮
    0 …

    View Slide

  15. www.cclp.hs.iastate.edu
    Asymmetric Double Claw
    = Σ=0
    1
    46
    100
    2 − 1,
    2
    3
    + Σ=1
    3
    1
    300


    2
    ,
    1
    100
    + Σ=1
    3
    7
    100


    2
    ,
    7
    100

    View Slide

  16. www.cclp.hs.iastate.edu
    Sombraro Function

    View Slide

  17. www.cclp.hs.iastate.edu
    Genetic Algorithms
    1. Define distance
    2. Generate values for weights (start with
    propensity score)
    3. Measure distance
    4. Check convergence
    5. Mutate weights
    6. Measure distance
    7. Check convergence
    8. …

    View Slide

  18. www.cclp.hs.iastate.edu
    Genetic Algorithm Example
    Diagonal W entries:
    Round 1: {.92, .85, .40, .05, .67, .45}
    Round 2: {.92, .85, .40, .03, .60, .32}
    Round 3: {.92, .85, .40, .03, .64, .40}
    Round 4: {.92, .85, .40, .03, .63, .40}

    View Slide

  19. www.cclp.hs.iastate.edu
    Variations in Match Quality

    View Slide

  20. www.cclp.hs.iastate.edu
    Propensity Score Matching
    Trade-off Between Matching Algorithms

    View Slide

  21. Multinomial Regression
    Pr(2-year College) / Pr(No College) Pr(4-year College) / Pr(No College)
    Odds Ratio t-value Odds Ratio t-value
    PLTW 1.57 2.30 0.94 -0.30
    Black 1.27 0.43 0.84 -0.24
    Asian 1.14 0.23 0.72 -0.49
    Hispanic 1.10 0.16 3.79 2.11
    American Indian 7.79E-07 -8.75E+07 3.59E-07 -1.05E+08
    Male 0.58 -2.15 0.64 -1.74
    FreeLunch 0.48 -2.56 0.35 -2.90
    Reduced Lunch 0.88 -0.35 0.50 -1.54
    IEP 1.08 0.15 0.74 -2.45
    Section504 2.77 1.53 0.18 -10.41
    Gifted/Talented 0.82 -0.62 0.76 -0.99
    Homeless Status 0.82 -3.21 0.67 -8.42
    8th Grade ITS_Nat_Standard_Read 1.00 0.68 1.02 3.08
    8th Grade ITS_Nat_Standard_Math 1.00 0.44 1.01 2.19
    8th Grade ITS_Nat_Standard_Science 1.00 -0.83 1.00 -0.64
    Course_Science_EarthSciences_Cumulative 1.38 2.39 1.07 0.45
    Course_Science_Biology_Cumulative 1.04 0.28 1.01 0.07
    Course_Science_Chemistry_Cumulative 1.47 2.06 2.16 3.63
    Course_Science_Physics_Cumulative 1.02 0.11 1.64 2.74
    Course_Science_SciEngTech_Cumulative 1.38 1.01 2.25 2.34
    Course_Math_Geometry_Cumulative 0.94 -0.33 0.82 -0.86
    Course_Math_Algebra1_Cumulative 1.06 0.35 0.86 -0.78
    Course_Math_Algebra2_Cumulative 0.61 -2.65 1.09 0.42
    Course_Math_Alg3Trig_Cumulative 1.69 2.25 2.15 3.30
    Course_Math_Precalculus_Cumulative 1.23 0.72 1.49 1.45
    Course_Math_Calculus_Cumulative 2.53 3.07 4.87 5.44
    Course_Math_ProbStat_Cumulative 1.05 0.21 0.72 -1.23
    Course_Math_IBMath_Cumulative 0.78 -0.66 2.01 2.20
    Course_Math_BusinessTechnical_Cumulative 0.90 -0.40 0.50 -1.30
    Course_Math_Other_Cumulative 0.46 -2.09 1.07 0.22
    EASIER_GraduationStatusN 0.18 -4.23 0.02 -9.69

    View Slide

  22. www.cclp.hs.iastate.edu
    Estimated Impact by Matching Algorithm
    Odds Ratio and t-Statistics of PLTW Participation by
    Methods of Propensity Score Matching (No College is Reference)

    View Slide

  23. www.cclp.hs.iastate.edu
    PLTW Impact by Institution Type

    View Slide

  24. www.cclp.hs.iastate.edu
    Conclusions


    View Slide

  25. www.cclp.hs.iastate.edu
    Implications for Future Research


    View Slide

  26. Tom Schenk Jr.
    Statistical Consultant
    [email protected]
    @tomschenkjr
    Frankie Santos Laanan
    Iowa State University
    [email protected]
    Soko S. Starobin
    Iowa State University
    [email protected]
    David Rethwisch
    University of Iowa
    [email protected]
    Melissa Chapman-Haynes
    Evaluation Consultant
    Darin Moeller
    Iowa State University
    Yu Chen
    Iowa State University

    View Slide