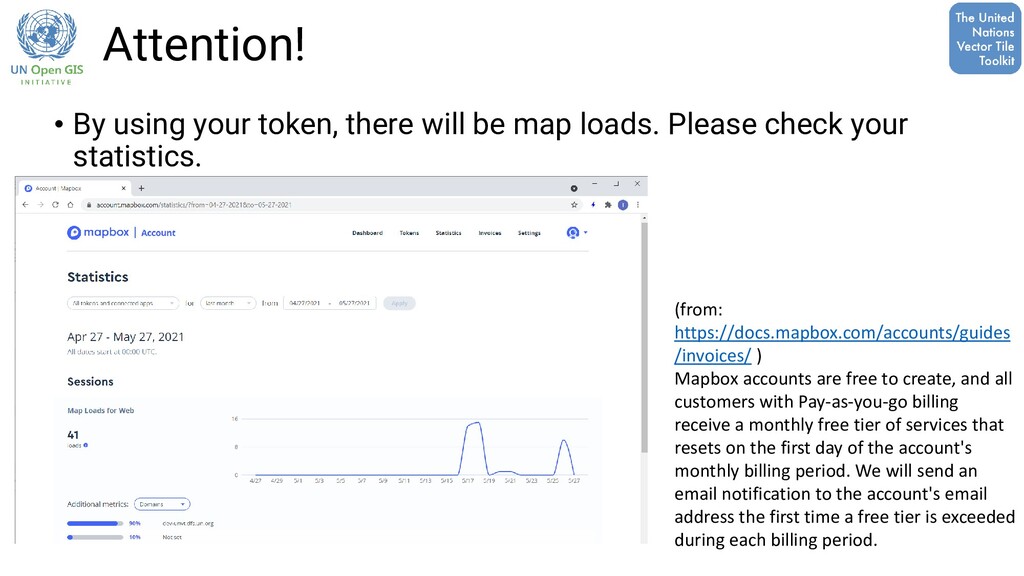
loads. Please check your statistics. (from: https://docs.mapbox.com/accounts/guides /invoices/ ) Mapbox accounts are free to create, and all customers with Pay-as-you-go billing receive a monthly free tier of services that resets on the first day of the account's monthly billing period. We will send an email notification to the account's email address the first time a free tier is exceeded during each billing period.
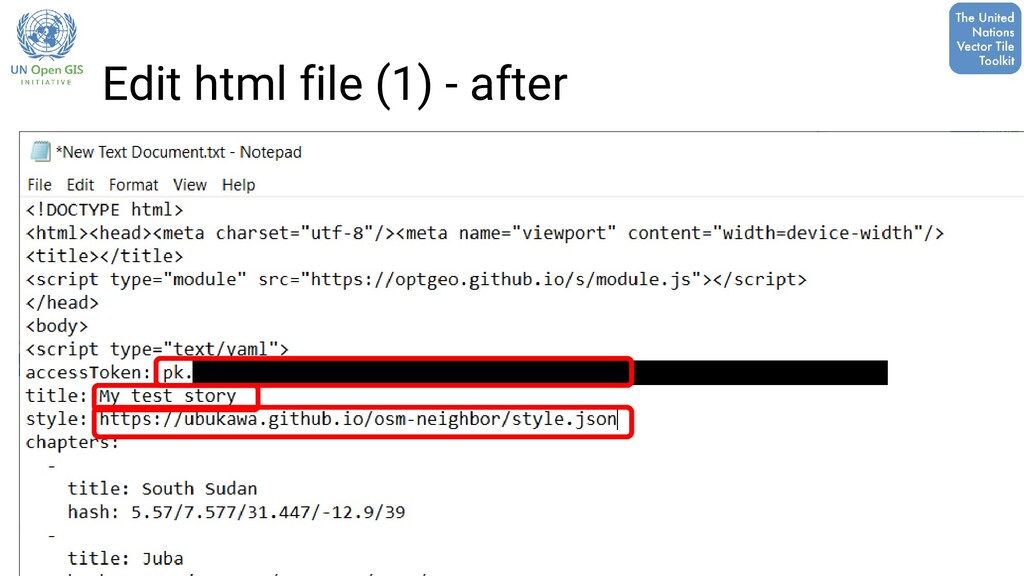
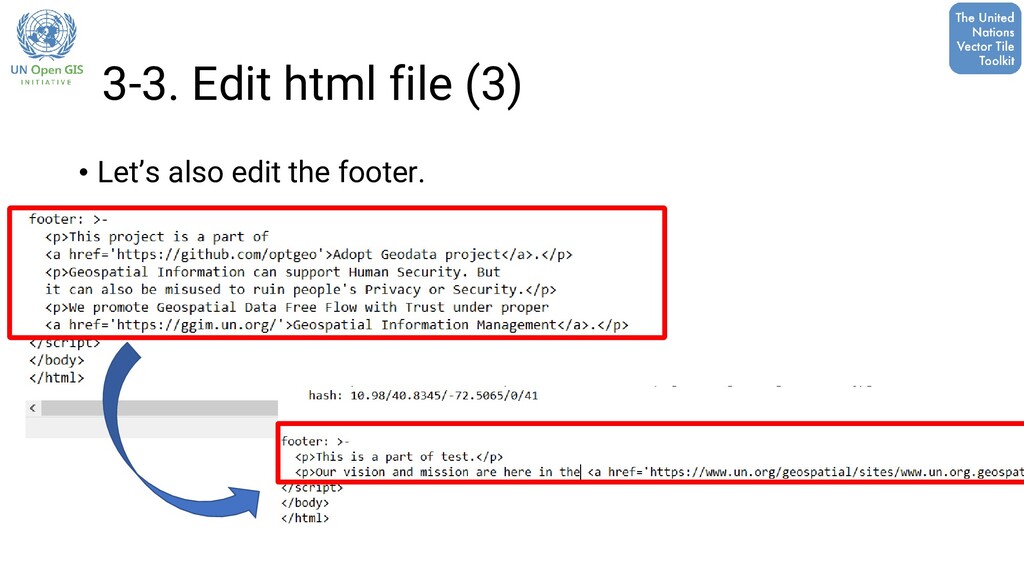
bearing: from -180 to180 Pitch: 0-60 Style file of this map: https://ubukawa.github.io/osm- neighbor/style.json You need to check the followings: • The location of the style. • Hash of each scene. • The story you want to tell. Example
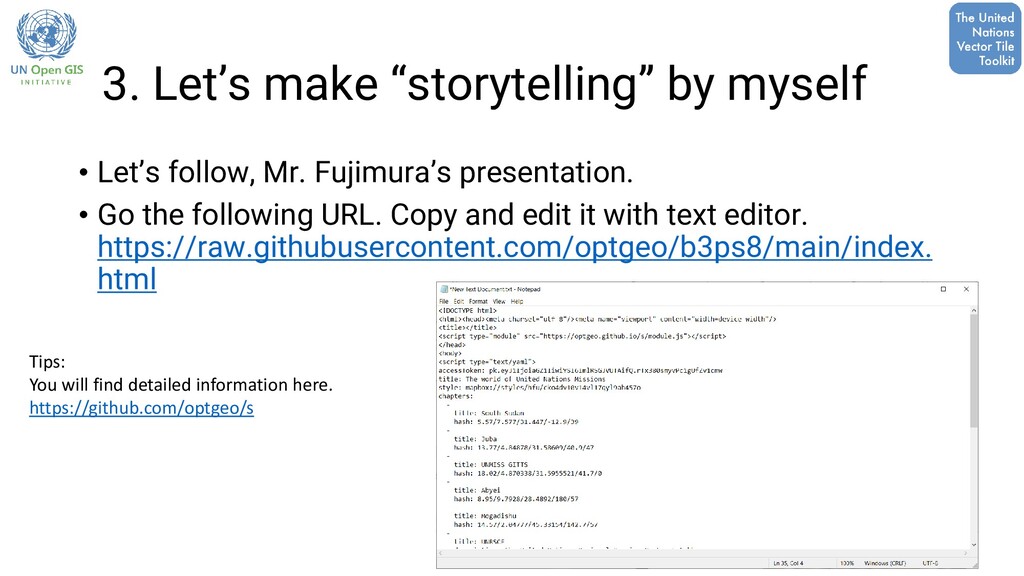
Fujimura’s presentation. • Go the following URL. Copy and edit it with text editor. https://raw.githubusercontent.com/optgeo/b3ps8/main/index. html Tips: You will find detailed information here. https://github.com/optgeo/s
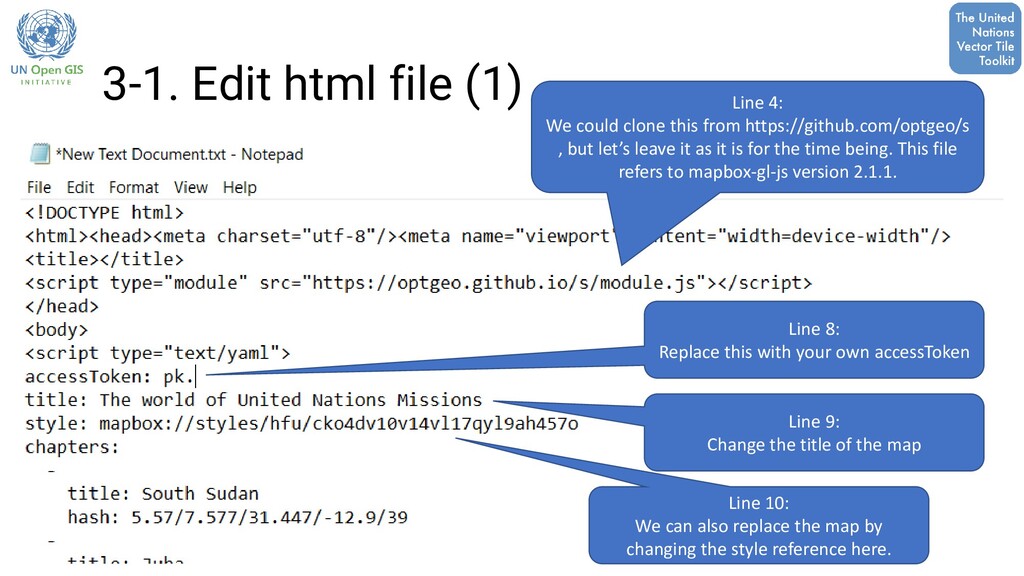
this from https://github.com/optgeo/s , but let’s leave it as it is for the time being. This file refers to mapbox-gl-js version 2.1.1. Line 8: Replace this with your own accessToken Line 9: Change the title of the map Line 10: We can also replace the map by changing the style reference here.
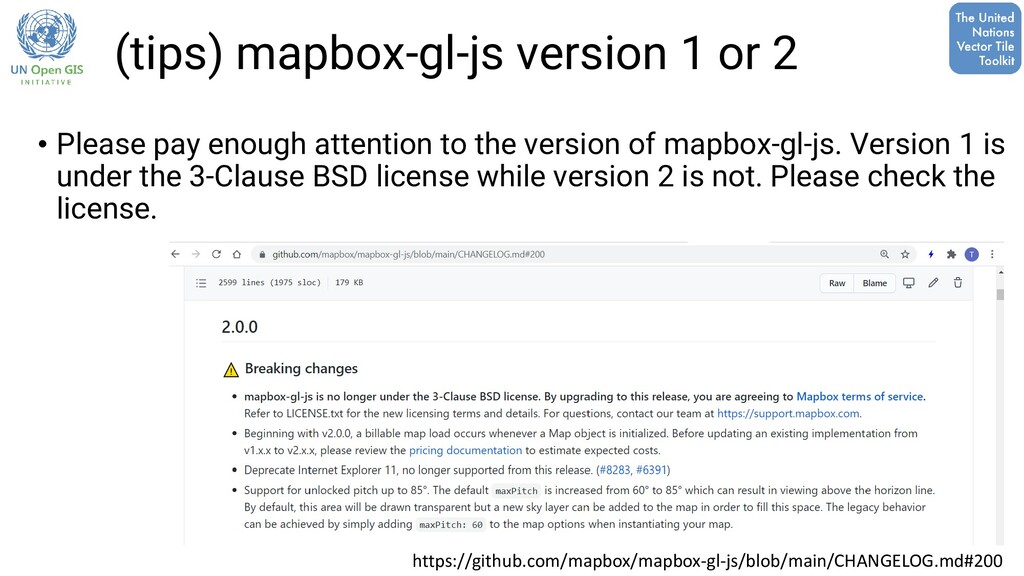
attention to the version of mapbox-gl-js. Version 1 is under the 3-Clause BSD license while version 2 is not. Please check the license. https://github.com/mapbox/mapbox-gl-js/blob/main/CHANGELOG.md#200
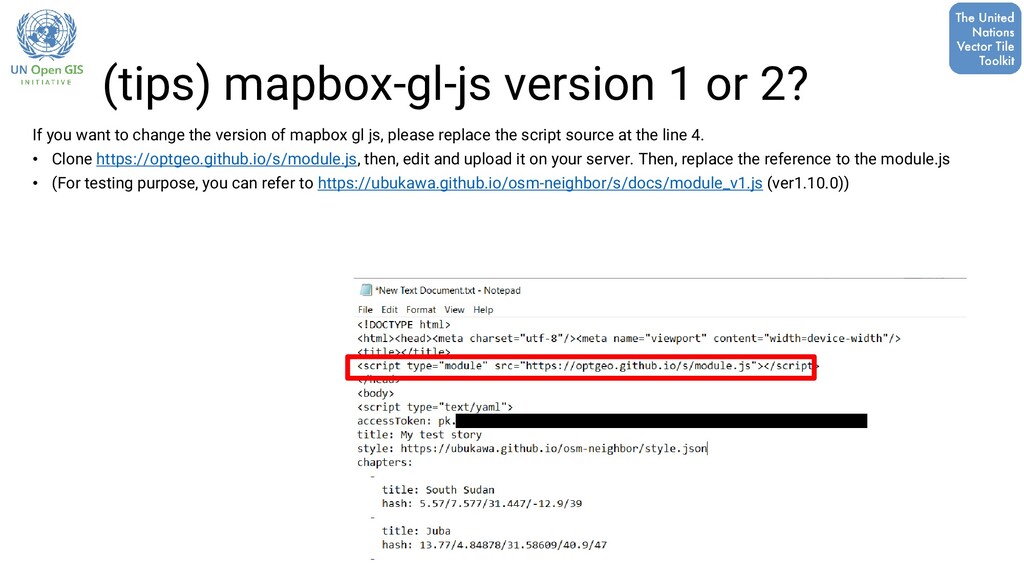
js, please replace the script source at the line 4. • Clone https://optgeo.github.io/s/module.js, then, edit and upload it on your server. Then, replace the reference to the module.js • (For testing purpose, you can refer to https://ubukawa.github.io/osm-neighbor/s/docs/module_v1.js (ver1.10.0)) (tips) mapbox-gl-js version 1 or 2?
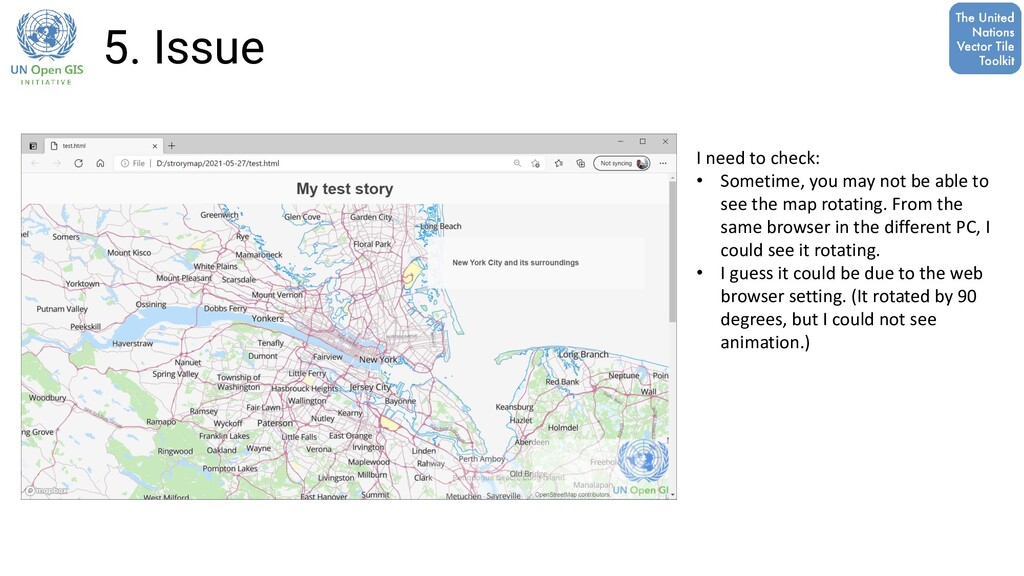
not be able to see the map rotating. From the same browser in the different PC, I could see it rotating. • I guess it could be due to the web browser setting. (It rotated by 90 degrees, but I could not see animation.)