Upgrade to Pro
— share decks privately, control downloads, hide ads and more …
Speaker Deck
Features
Speaker Deck
PRO
Sign in
Sign up for free
Search
Search
Tableau Course @DHIL - Day 3
Search
Sponsored
·
Your Podcast. Everywhere. Effortlessly.
Share. Educate. Inspire. Entertain. You do you. We'll handle the rest.
→
Alberto Lusoli
January 13, 2021
Education
46
0
Share
Embed
Copy iframe code
Copy JS code
Copy link
Start on current slide
Tableau Course @DHIL - Day 3
Alberto Lusoli
January 13, 2021
More Decks by Alberto Lusoli
See All by Alberto Lusoli
AI and Creativity - Professional Responsibility and Technical Writing (CMPT 376W)
albertolusoli
0
180
Make Fail Repeat - Digital Democracies Institute - University of Korea symposium
albertolusoli
0
120
CMNS201 - Lab 8. Assignment 3
albertolusoli
0
100
Remote work and the redrawing of the US rural imaginary during the COVID-19 Pandemic
albertolusoli
0
560
CMNS201 - Lab 7. SPSS Multivariate Analysis
albertolusoli
0
270
CMNS201 - Lab 6. SPSS Bivariate Analysis, Crosstab
albertolusoli
0
450
CMNS201 - Lab 5. Charts in SPSS
albertolusoli
1
400
CMNS201 - Lab 4. SPSS Univariate Analysis
albertolusoli
0
360
CMNS201 - Lab 3. SPSS Variables recoding
albertolusoli
0
350
Other Decks in Education
See All in Education
Gitがない時代 インターネットがない時代の 開発話
sapi_kawahara
0
320
!コスパよくインターンに受かる方法!
ruribou
1
300
[2026前期火5] 論理学(京都大学文学部 前期 第6回)「かつとまたはの規則」
yatabe
0
420
Where Data Meets Storytelling
georgesinnott
0
130
2026年度春学期 統計学 第6回 データの関係を知る(1)ー 相関関係 (2026. 5. 14)
akiraasano
PRO
0
150
Examen de Selectividad. Geografía junio 2026 (Convocatoria Ordinaria). UCLM
juanmartin2026
1
1.8k
Implicit and Cross-Device Interaction - Lecture 10 - Next Generation User Interfaces (4018166FNR)
signer
PRO
2
2.3k
Estimating Group × Time Interaction in Scale-Transformed CEFR-J Self-Assessment Scores: A Case in Study-Abroad Research
uranoken
0
130
Laura Wilson - The Quarterly PR Pivot
laurawilsonbseo1
1
370
We部コミュニティスライド2026-04-24
junhat6
0
190
AI-Based Speaking Assessment of a Short-Term Study Abroad Program
uranoken
0
370
Soluciones al examen de Geografía 2026. JUNIO (Convocatoria Ordinaria)
juanmartin2026
1
5.7k
Featured
See All Featured
Docker and Python
trallard
47
3.9k
Save Time (by Creating Custom Rails Generators)
garrettdimon
PRO
32
3.7k
Music & Morning Musume
bryan
47
7.3k
What's in a price? How to price your products and services
michaelherold
247
13k
The Art of Delivering Value - GDevCon NA Keynote
reverentgeek
16
2k
Marketing to machines
jonoalderson
1
5.6k
Building AI with AI
inesmontani
PRO
1
1.1k
Leadership Guide Workshop - DevTernity 2021
reverentgeek
1
320
Building Experiences: Design Systems, User Experience, and Full Site Editing
marktimemedia
0
550
Joys of Absence: A Defence of Solitary Play
codingconduct
1
410
The B2B funnel & how to create a winning content strategy
katarinadahlin
PRO
1
420
Collaborative Software Design: How to facilitate domain modelling decisions
baasie
1
260
Transcript
DAY THREE Alberto Lusoli – Simon Fraser University
None
None
None
Data source 1 Data source 2 Data source 3
None
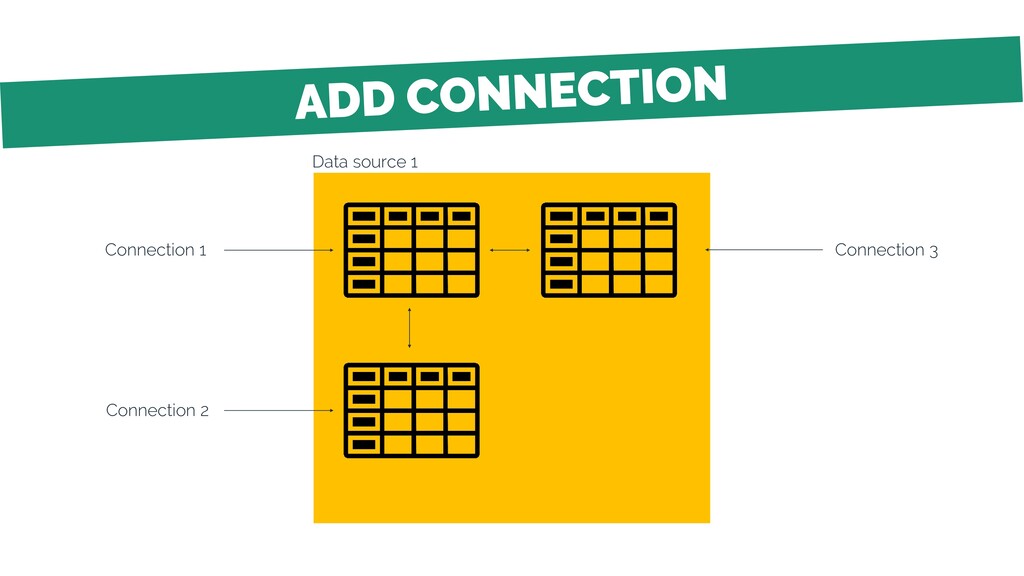
Data source 1 Connection 1 Connection 2 Connection 3
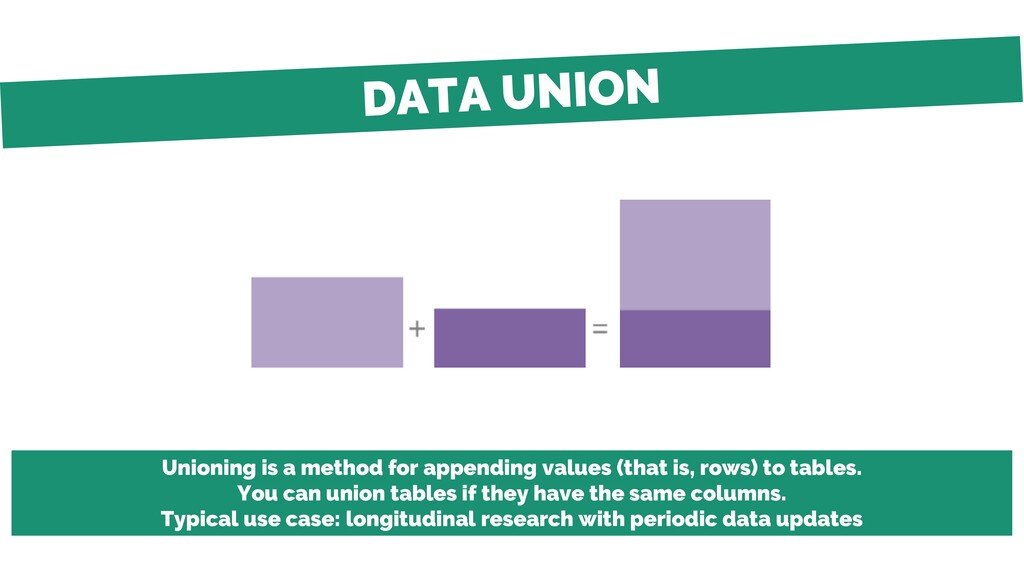
Unioning is a method for appending values (that is, rows)
to tables. You can union tables if they have the same columns. Typical use case: longitudinal research with periodic data updates
Data source 1 Connection 1 Connection 2
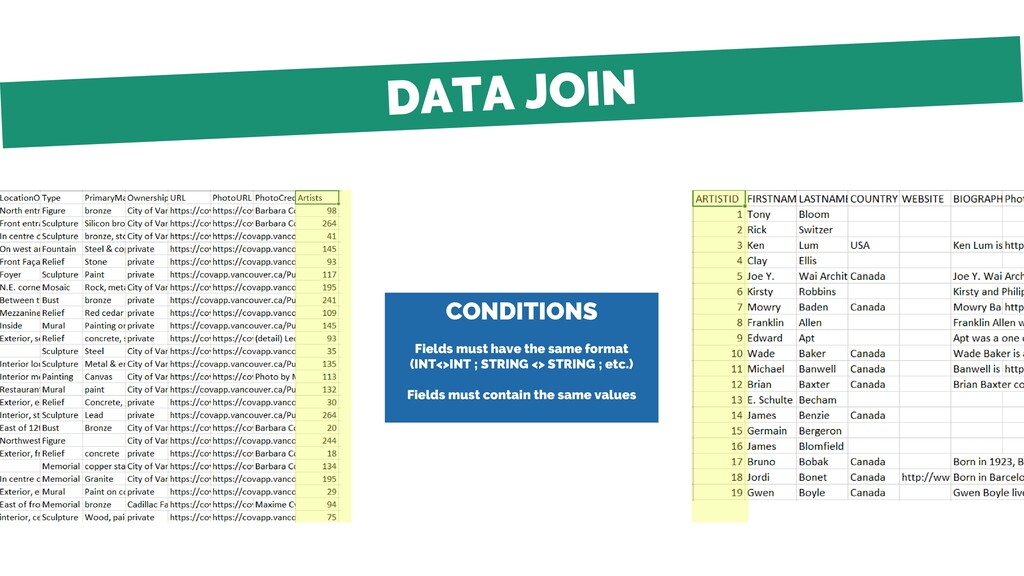
Joining is a method for combining tables related by common
fields (that is, common columns). The result of combining data using a join is a virtual table that extends horizontally by adding columns of data.
Data source 1 Connection 1 Connection 3
CONDITIONS Fields must have the same format (INT<>INT ; STRING
<> STRING ; etc.) Fields must contain the same values
None
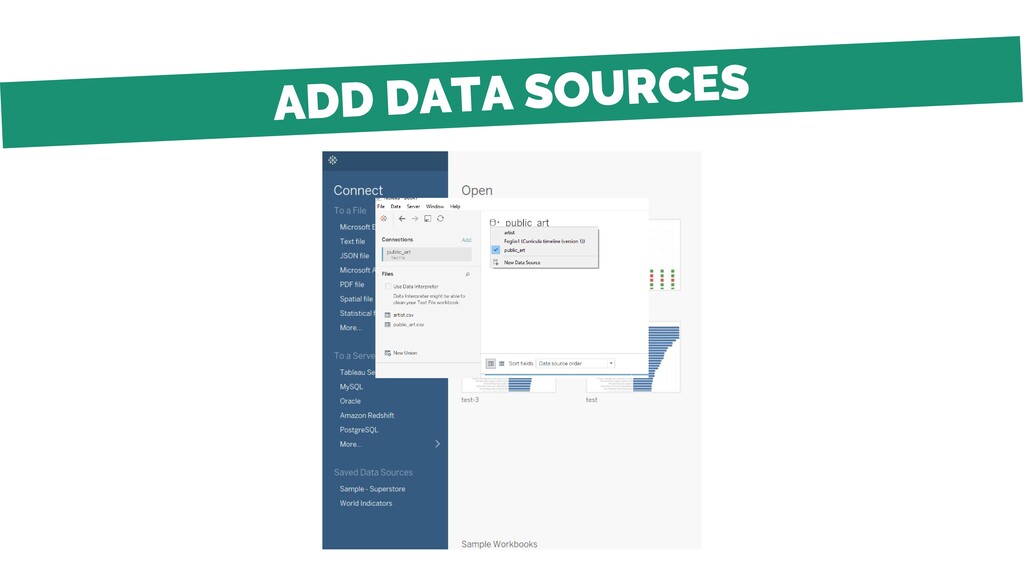
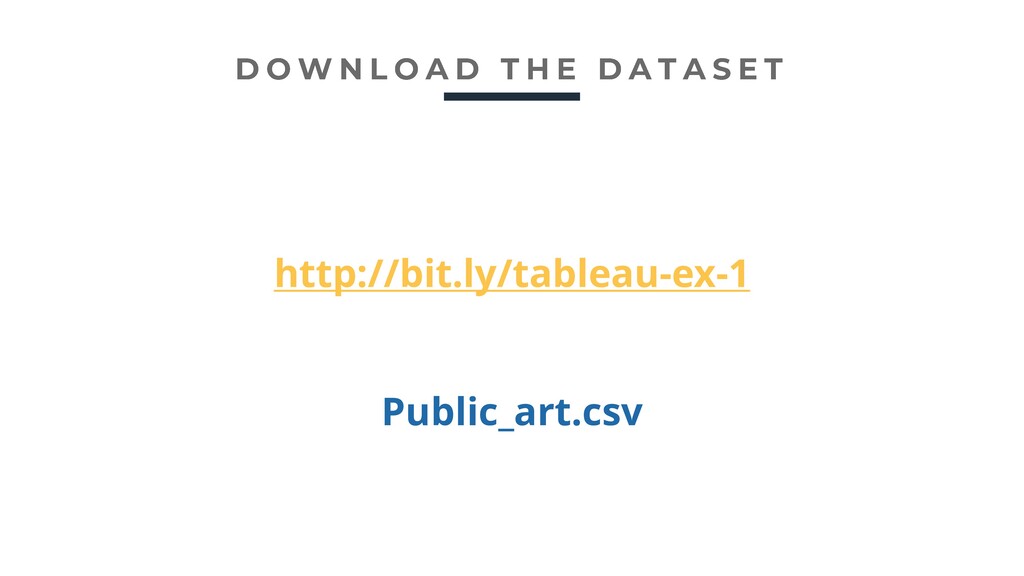
http://bit.ly/tableau-ex-1 Public_art.csv
Visualize public art trend Visualize public art map
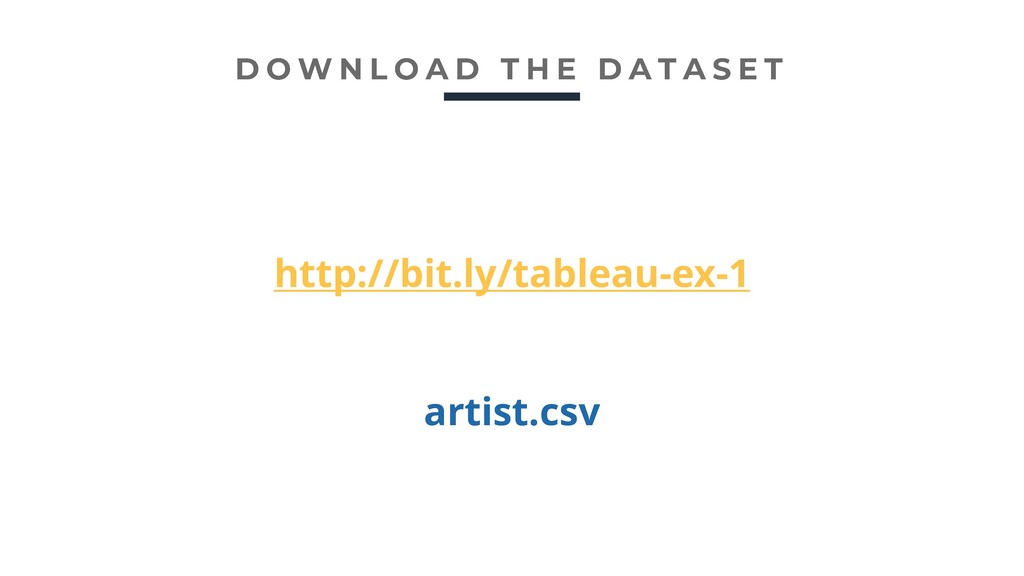
http://bit.ly/tableau-ex-1 artist.csv
Data join Improve original map tooltips timeline Map of international
influence
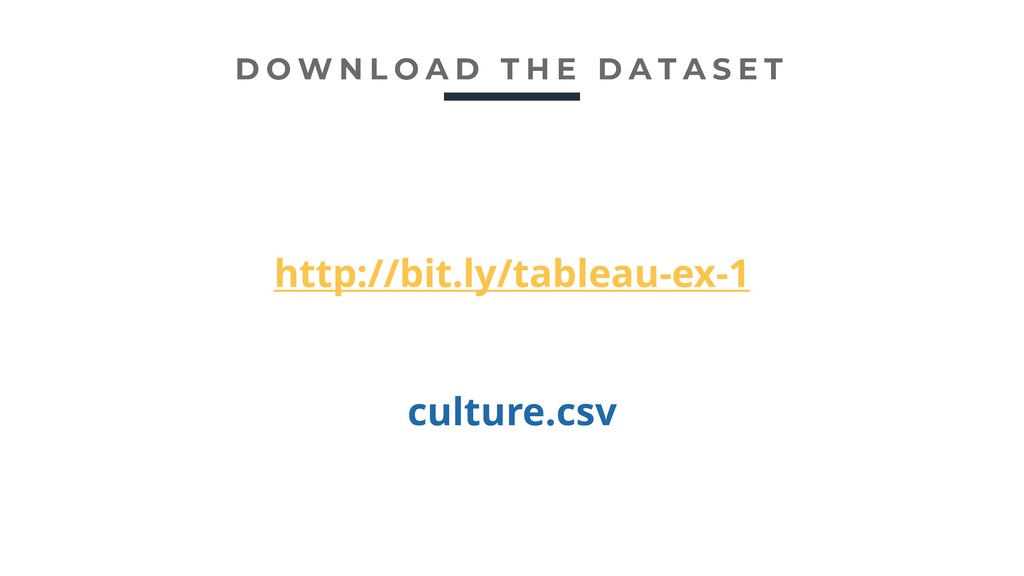
http://bit.ly/tableau-ex-1 culture.csv
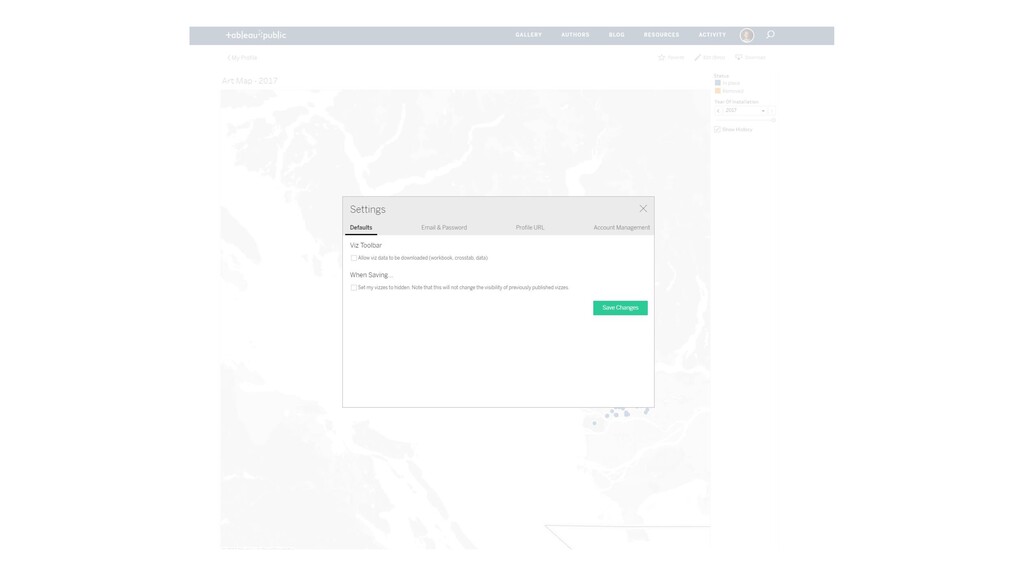
Create a profile on public.tableau.com
1. Login in on your Tableau public profile within Tableau
2. Publish your visualization/dashboard online 1. Extract data sources 2. Check visibility for pre-research 3. Set export options 4. Data protection compliance
None
For questions or help, write me at:
[email protected]
THANK YOU
![For questions or help, write me at: [email protected] THANK YOU](https://files.speakerdeck.com/presentations/340905d001f54f98b11728056cd638d5/slide_21.jpg)