Upgrade to Pro — share decks privately, control downloads, hide ads and more …

AAGW3 - Chandra Biradar - Role of Geoinformatics in Ensuring Food Security in Dry Areas

CGIAR-CSI
March 25, 2013

AAGW3 - Chandra Biradar - Role of Geoinformatics in Ensuring Food Security in Dry Areas

CGIAR-CSI

March 25, 2013
Tweet

More Decks by CGIAR-CSI

Other Decks in Research

Transcript

  1. shekhar Biradar, PhD Head, GIS Unit, ICARDA Formerly Manager, Earth

    Observation & Modeling Res. Scientist, Center for Spatial Analysis Research Asst. Professor, Dept. of M&PB University of Oklahoma Norman, Oklahoma, USA |[email protected]| Chandra International Center for Agricultural Research in the Dry Areas Science for better livelihoods in dry areas
  2. Outline Geoinfor matics Food Security Dry Areas • Introduction •

    Food security issues and possible solutions* • Role of Geoinformatics • Citizen science and Cyber Infrastructure • Way forward
  3. ICARDA’s Research GPS RS GIS Diversification and Sustainable Intensification of

    Production Systems Integrated Water and Land Management Social, Economic and Policy Research Biodiversity and Integrated Gene Management CRP 1.1 Dryland Systems CRP5 CRP3 CRP7 CRP4 Other Research Projects Olive Irrigation Project Water Land and Livelihoods New income from Cashmere + Mohair Iraq Salinity Project Sustainable Agriculture in Central Asia RAIN-WANA information platform Barley-livestock systems Harmonized Support for Agricultural Development (HSAD) …. ….
  4. Geoinformatics It is a branch of science & technology that

    deals with the collection, analysis, & presentation of data relating to the earth’s surface Theory Spatial Database Maps & Attributes Comp. Geometry Spatial Analysis Spatial Data Mining Remote Sensing Navigation System Spatial Decisions Telecommunication Agriculture Environment Climate Change Spatial Models Spatial Algorithms Spatial Reasoning GIS?, RS?, RS/GIS? GIS/RS?, RS/GIS/GPS?
  5. “The sciences, technology and practices of RS and GIS arose

    separately, developed in parallel, intersected, and are now inextricably linked”
  6. Physical Economic Little/No Dry Areas • Land areas with an

    aridity index <0.65 • Constitutes 41% of the world’s land areas • Home to 2.5 billion people • 1/3rd depend on dryland agriculture IWMI, 2000/06 ICARDA Dry Areas (Drylands) 2009 2012 Bijapur
  7. “The first essential component of the social justice is adequate

    food for all mankind”- Dr. Norman Borlaug, Nobel laureate and father of green revolution “access of all people at all times to enough food for an active, healthy life”. Food Security
  8. Food Security Key Issues in Dry Areas • Highly vulnerable

    production system • Productivity-dependent food security • Poverty-driven production mechanism • Climate-induced uncertainties • Unexplored production potential • Risky investor-friendly system The world cannot achieve the Millennium Development Goals without addressing the needs of drylands. -Global Drylands: A UN system-wide response
  9. Multispectral Hyperspectral Thermal Microwave • Increased spatial, spectral and temporal

    resolutions • Increased computational efficiency and speed • Decreased hardware and software cost • Decreased RS data cost Geoinformatics in 21st Century
  10. Satellite Resolution(m) Pixels/ac Pixels/ha $/km2 AVHRR 1000 0.004 0.01 Free

    MODIS 500 0.016 0.04 Free Landsat 30 4.5 11.1 Free PALSAR 10 40 100 Free NAIP-AP* 1 4046 10000 Free AWiFS 60 1.11 2.7 0.01 IRS liss3 23.5 7.3 18.1 0.15 ASTER 15 18 44.4 0.04 IRS Liss4 5 160 400 1.19 RapidEye 5 160 400 1.23 IKONOS 4 253 625 5.02 Cartosat1 2.5 640 1600 6.59 GeoEye1 2 1012 2500 12.5 WorldView2 2 1012 2500 14.5 Spatial Resolution: Global to Local Scale Landsat Continuity Mission: Landsat 8, Feb 11, 2013
  11. Center pivotal farm lands , Kansas earthasart.gsfc.nasa.gov Shark Elowainat, Egypt

    Todhia Farm, Saudi Arabia El Reno, Oklahoma, USA Black Earth Farms, Russia Queen Alia AR, Amman, Jordan Al-Jawf Farms, Libya
  12. Rainfed croplands play potential role in food production, reduce poverty,

    while maintaining ecosystem services. (Biradar et al., 2009) Rainfed Areas Rainfed + Others Rainfed croplands of the World Biradar et al, 2009
  13. Kansas Oklahoma Texas Near-Real time Crop Monitoring, Mapping and Forecasting

    System •How much area planted, emerged and harvested? •What would be expected Yield? Questions Dynamics of Cropping Pattern (Ongoing)
  14. WP of Cotton 0.42 kg/m3 0.50 USD/m3 WP of Wheat

    0.60 kg/m3 0.33 USD/m3 WP of Rice paddy 0.50 kg/m3 0.10 USD/m3 Water productivity (WP) is defined as the kg of yield produced/m3 of water used or, alternatively, as value in $ of yield produced/m3 of water used (Molden, 2003, Biradar et al 2009). (Biradar et al., 2009) Mapping Land and Water Productivity
  15. Wheat Grain Yield (t/ha) Alfalfa Hay Yield (t/ha) Mapping Water

    Productivity and Precision Agriculture in Saudi Arabia (Collaboration with King Saud University, Patil et al, 2012))
  16. Kharif only Rabi only Double crops Fallow fields Water body

    Other LULC 2004-05 2008-09 World Bank Impact Assessment (Biradar et al., 2012a) Land Use Change in Response to Investment in Agriculture and Irrigation Restructuring Projects
  17. Land Use Map 2004/05 Water Sector Restructuring Project to increase

    cropping intensity and productivity Irrigation Induced Salinity Control and Reclamation Project World Bank Impact Assessment, (Biradar et al., 2012a)
  18. Head Middle Tailend Total 0 50 100 150 200 Cropping

    Intensity (%) 2004-05 2008-09 Land Use Map 2008/09 Water Sector Restructuring Project to increase cropping intensity and productivity
  19. 50% 8% 40% 30% Near Infrared Visible Red Near Infrared

    Visible Red (0.50-0.08) (0.50+0.08) = 0.72 (0.40-0.30) (0.40+0.30) = 0.14 Chickpea NDVI Number of cycles, Crop Calendar (Starting and Ending), Length of Growing Season, Max Vegetative Peaks, Pattern, Magnitudes etc 0.6 0.5 0.4 0.3 0.2 0.1 0.0 EVI Jul Aug Sep Oct Nov Dec Jan Feb Mar Apr May Jun Time (8-day interval) (Biradar et al., 2012)
  20. Start (Planting) 2004/05 Start (Planting) 2008/09 End (Harvest) 2004/05 End

    (Harvest) 2008/09 Mapping Crop Phenology (Calendar) (Biradar et al., 2012b)
  21. Mapping Crop Phenology (Calendar) GSL-1st Crop 2004/05 GSL-1st Crop 2008/09

    GSL-2nd Crop 2004/05 GSL-2nd Crop 2008/09 (Biradar et al., 2012b)
  22. 0.0 0.1 0.2 0.3 0.4 0.5 0.6 350 550 750

    950 1150 1350 1550 1750 1950 2150 2350 Reflectance Dryland Wheat Sup. Irrigated Wheat Irrigated Wheat Difference NIR-R, healthy vegetation Water absorption Chlorophyll absorption Wavelength (nm) Visible Near-Infrared Middle and shortwave Infrared Blue Green Red Leaf Pigments Cell structure Water content Main factors controls leaf reflectance Primary absorption bands ICARDA’s Global Mandate Crops: Barley, Lentil, Faba Bean.. wheat, chickpea Reflectance-Based Characterization of Cultivars Spectral Finger Printing of Genotypic and Phenotypic Screening
  23. 1910s drought 1930s drought 1950s drought 30-year pluvial Wetter than

    previous wet periods and as wet as drought periods were dry 30-year pluvial Agricultural Droughts: Mapping, Monitoring and Impact Assessment
  24. Jul 12 Jun 18 Jul 20 Crop inundation loss: •

    6 million acres • 11 districts • $ 1.6 (Rs.87) billion loss Photo: The Tribune, AgriCorner Flood Algorithm (Biradar et al, 2012) Agricultural Floods: Mapping crop inundation and damages due to floods
  25. Mapping Biodiversity Rich Areas (Mining Natural Genebanks) BioRich Areas (Biradar,

    et al 2005, 2006) Biodiversity Characterization at Landscape Level -Mapping The Gene Banks…
  26. Livestock feed inventory: FAO National Feed Stock Inventory Hyperspectral measurement

    in Central Asian Grasslands Remote sensing based livestock feed inventory system (Xiao et al, 2012)
  27. Regional Wheat Production Loss from 07/08 to 08/09: 22% Science

    and Society A citizen science data portal to collect, share, archive and query location based info and geo-referenced field photos and Geospatial Data Gateway and Visualization System
  28. cheetah dragon tiger bison magnolia rose nature yak Computing server

    (Linux) ArcGIS server (Window) Web server (Linux) health CIFS Clients (Window) PC PC PC CIFS NFS Direct CIFS orchid bird CyberCommons panda koala NFS/CIFS Storage server Architecture of the RS/GIS Data Storage Pathway Data Repository System (Rack #1, 500 TB) - a storage area network (SAN), Dell DDN Ext3 file system /data/vol01/, …, /data/vol18/ OCFS2 file system /data/vol19/, …, /data/vol22/ www.icarda.org/geo Over 500TB of Geospatial Data at; -Global -Regional -National -Local -vector -raster -statistical -climate -documents Data ordering & archive (500 TB) Data processing & web service (250 TB) Data Analysis (50 TB) Cyber-Infrastructure for Research, Application and Extension Data Analysis (50 TB) Data ordering & archive (250 TB) High-end Computer servers (5+) (data processing server and web server) Open stack and cloud computing Web Mapping and Dissemination Data processing & web service (50 TB)
  29. Winter Wheat Monitoring Site at El Reno, Oklahoma An Excellent

    real-time monitoring tool for Research Stations
  30. Cropland Characteristics Local National Regional Global Cropland area (Biradar et

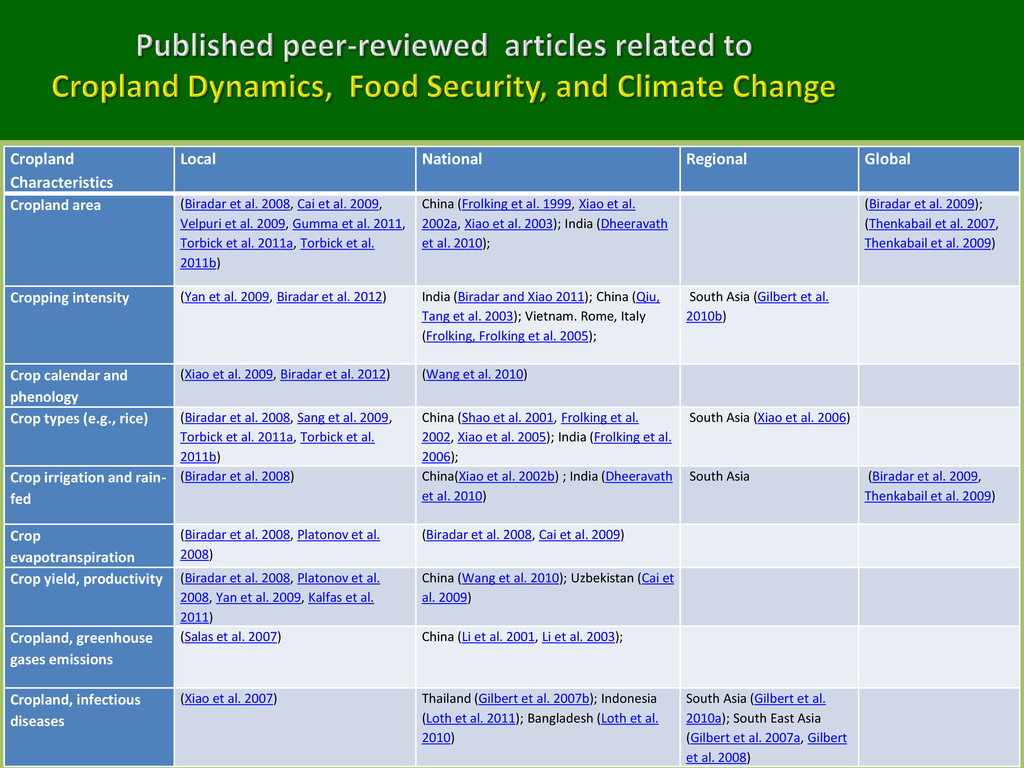
    al. 2008, Cai et al. 2009, Velpuri et al. 2009, Gumma et al. 2011, Torbick et al. 2011a, Torbick et al. 2011b) China (Frolking et al. 1999, Xiao et al. 2002a, Xiao et al. 2003); India (Dheeravath et al. 2010); (Biradar et al. 2009); (Thenkabail et al. 2007, Thenkabail et al. 2009) Cropping intensity (Yan et al. 2009, Biradar et al. 2012) India (Biradar and Xiao 2011); China (Qiu, Tang et al. 2003); Vietnam. Rome, Italy (Frolking, Frolking et al. 2005); South Asia (Gilbert et al. 2010b) Crop calendar and phenology (Xiao et al. 2009, Biradar et al. 2012) (Wang et al. 2010) Crop types (e.g., rice) (Biradar et al. 2008, Sang et al. 2009, Torbick et al. 2011a, Torbick et al. 2011b) China (Shao et al. 2001, Frolking et al. 2002, Xiao et al. 2005); India (Frolking et al. 2006); South Asia (Xiao et al. 2006) Crop irrigation and rain- fed (Biradar et al. 2008) China(Xiao et al. 2002b) ; India (Dheeravath et al. 2010) South Asia (Biradar et al. 2009, Thenkabail et al. 2009) Crop evapotranspiration (Biradar et al. 2008, Platonov et al. 2008) (Biradar et al. 2008, Cai et al. 2009) Crop yield, productivity (Biradar et al. 2008, Platonov et al. 2008, Yan et al. 2009, Kalfas et al. 2011) China (Wang et al. 2010); Uzbekistan (Cai et al. 2009) Cropland, greenhouse gases emissions (Salas et al. 2007) China (Li et al. 2001, Li et al. 2003); Cropland, infectious diseases (Xiao et al. 2007) Thailand (Gilbert et al. 2007b); Indonesia (Loth et al. 2011); Bangladesh (Loth et al. 2010) South Asia (Gilbert et al. 2010a); South East Asia (Gilbert et al. 2007a, Gilbert et al. 2008)
  31. Geospatial Science, Technology and Applications Reduce Research Cost Enhance Research

    Value Wider App. Better Comm. Cyber infrastructure for research, research support, citizen science and participatory research
  32. Record location, values, photos, etc. Real-time Disease/Pest surveillance, early warning,

    mitigation,… Analyze, extrapolate, map, publish , … Community GIS/Geoinformatics Biodiversity, Land, Water information Socio-economy, impact study,…
  33. Overall Goal: To promote and strengthen research and services in

    Geospatial Science, Technology and Application (GeSTA) at the ICARDA, and to position ICARDA as a leading institution for research, services and education in geospatial science and technology in the region and across CGIAR.  Geospatial Data Gateways  Weather Mapping Tools  Conduct Geospatial Research  Research Support and Services  Capacity Building  Establish Networking  Proposal and Funding  Publications and Web portals  Geospatial Science Day Proposed Activities:
  34. ?