Upgrade to Pro — share decks privately, control downloads, hide ads and more …

Modeling Social Data, Lecture 1: Introduction / Overview

Jake Hofman
January 25, 2019

Modeling Social Data, Lecture 1: Introduction / Overview

Jake Hofman

January 25, 2019
Tweet

More Decks by Jake Hofman

Other Decks in Education

Transcript

  1. Introduction and Overview
    APAM E4990
    Modeling Social Data
    Jake Hofman
    Columbia University
    January 25, 2019
    Jake Hofman (Columbia University) Introduction and Overview January 25, 2019 1 / 58

    View Slide

  2. Course overview
    Modeling social data requires an understanding of:
    1 How to obtain data produced by (online) human interactions
    2 What questions we typically ask about human-generated data
    3 How to make these questions precise and quantitative
    4 How to interpret and communicate results
    Jake Hofman (Columbia University) Introduction and Overview January 25, 2019 2 / 58

    View Slide

  3. Questions
    Many long-standing questions in the social sciences are notoriously
    difficult to answer, e.g.:
    • “Who says what to whom in what channel with what effect”?
    (Laswell, 1948)
    • How do ideas and technology spread through cultures?
    (Rogers, 1962)
    • How do new forms of communication affect society?
    (Singer, 1970)
    • . . .
    Jake Hofman (Columbia University) Introduction and Overview January 25, 2019 3 / 58

    View Slide

  4. Questions
    Typically difficult to observe the relevant information via
    conventional methods
    Moreno, 1933
    Jake Hofman (Columbia University) Introduction and Overview January 25, 2019 4 / 58

    View Slide

  5. Large-scale data
    Recently available electronic data provide an unprecedented
    opportunity to address these questions at scale
    Demographic Behavioral Network
    Jake Hofman (Columbia University) Introduction and Overview January 25, 2019 5 / 58

    View Slide

  6. Computational social science
    An emerging discipline at the intersection of the social sciences,
    statistics, and computer science
    Jake Hofman (Columbia University) Introduction and Overview January 25, 2019 6 / 58

    View Slide

  7. Computational social science
    An emerging discipline at the intersection of the social sciences,
    statistics, and computer science
    (motivating questions)
    Jake Hofman (Columbia University) Introduction and Overview January 25, 2019 6 / 58

    View Slide

  8. Computational social science
    An emerging discipline at the intersection of the social sciences,
    statistics, and computer science
    (fitting large, potentially sparse models)
    Jake Hofman (Columbia University) Introduction and Overview January 25, 2019 6 / 58

    View Slide

  9. Computational social science
    An emerging discipline at the intersection of the social sciences,
    statistics, and computer science
    (parallel processing for filtering and aggregating data)
    Jake Hofman (Columbia University) Introduction and Overview January 25, 2019 6 / 58

    View Slide

  10. Topics
    Exploratory Data Analysis
    Classification
    Regression
    Networks
    Jake Hofman (Columbia University) Introduction and Overview January 25, 2019 7 / 58

    View Slide

  11. Exploratory Data Analysis
    (a.k.a. counting and plotting things)
    Jake Hofman (Columbia University) Introduction and Overview January 25, 2019 8 / 58

    View Slide

  12. Regression
    (a.k.a. modeling continuous things)
    Jake Hofman (Columbia University) Introduction and Overview January 25, 2019 9 / 58

    View Slide

  13. Classification
    (a.k.a. modeling discrete things)
    Jake Hofman (Columbia University) Introduction and Overview January 25, 2019 10 / 58

    View Slide

  14. Networks
    (a.k.a. counting complicated things)
    Jake Hofman (Columbia University) Introduction and Overview January 25, 2019 11 / 58

    View Slide

  15. Prediction and explanation
    Important to view prediction and explanation as compliments,
    not substitutes
    Computer science
    ˆ
    y
    Predict
    vs
    and
    Social science
    ˆ
    β
    Explain
    Otherwise it can be difficult to make long-term progress in
    advancing social science
    Jake Hofman (Columbia University) Introduction and Overview January 25, 2019 12 / 58

    View Slide

  16. The clean real story
    “We have a habit in writing articles published in scientific
    journals to make the work as finished as possible, to cover
    all the tracks, to not worry about the blind alleys or to
    describe how you had the wrong idea first, and so on. So
    there isn’t any place to publish, in a dignified manner,
    what you actually did in order to get to do the work ...”
    -Richard Feynman
    Nobel Lecture1, 1965
    1http://bit.ly/feynmannobel
    Jake Hofman (Columbia University) Introduction and Overview January 25, 2019 13 / 58

    View Slide

  17. Case studies
    Web demographics
    Daily Per−Capita Pageviews
    0
    10
    20
    30
    40
    50
    60
    70
    q
    q
    q
    q
    q
    Over $25k
    Under $25k
    Black
    &
    Hispanic
    White
    No College
    Some College
    Over 65
    Under 65
    Female
    Male
    Income Race Education Age Sex
    Search predictions
    "Right Round"
    Week
    Rank
    40
    30
    20
    10
    c
    c
    c
    c
    c
    c
    c
    c
    c
    c
    c
    c
    c
    c
    c
    c
    c
    c
    c
    c
    c
    c
    c
    c
    c
    c
    c
    c
    c
    c
    c
    c
    c
    c
    c
    c
    c
    c
    c
    c
    c
    c
    Mar−09 Apr−09 May−09 Jun−09 Jul−09 Aug−09
    Billboard
    Search
    Viral hits
    Jake Hofman (Columbia University) Introduction and Overview January 25, 2019 14 / 58

    View Slide

  18. Predicting consumer activity with Web search
    with Sharad Goel, S´
    ebastien Lahaie, David Pennock, Duncan Watts
    "Right Round"
    Week
    Rank
    40
    30
    20
    10
    c
    c
    c
    c
    c
    c
    c
    c
    c
    c
    c
    c
    c
    c
    c
    c
    c
    c
    c
    c
    c
    c
    c
    c
    c
    c
    c
    c
    c
    c
    c
    c
    c
    c
    c
    c
    c
    c
    c
    c
    c
    c
    Mar−09 Apr−09 May−09 Jun−09 Jul−09 Aug−09
    Billboard
    Search
    Jake Hofman (Columbia University) Introduction and Overview January 25, 2019 15 / 58

    View Slide

  19. Search predictions
    Motivation
    Does collective search activity
    provide useful predictive signal
    about real-world outcomes?
    "Right Round"
    Week
    Rank
    40
    30
    20
    10
    c
    c
    c
    c
    c
    c
    c
    c
    c
    c
    c
    c
    c
    c
    c
    c
    c
    c
    c
    c
    c
    c
    c
    c
    c
    c
    c
    c
    c
    c
    c
    c
    c
    c
    c
    c
    c
    c
    c
    c
    c
    c
    Mar−09 Apr−09 May−09 Jun−09 Jul−09 Aug−09
    Billboard
    Search
    Jake Hofman (Columbia University) Introduction and Overview January 25, 2019 16 / 58

    View Slide

  20. Search predictions
    Motivation
    Past work mainly focuses on predicting the present2 and ignores
    baseline models trained on publicly available data
    Date
    Flu Level (Percent)
    1
    2
    3
    4
    5
    6
    7
    8
    2004 2005 2006 2007 2008 2009 2010
    Actual
    Search
    Autoregressive
    2Varian, 2009
    Jake Hofman (Columbia University) Introduction and Overview January 25, 2019 17 / 58

    View Slide

  21. Search predictions
    Motivation
    We predict future sales for movies, video games, and music
    "Transformers 2"
    Time to Release (Days)
    Search Volume
    a
    −30 −20 −10 0 10 20 30
    "Tom Clancy's HAWX"
    Time to Release (Days)
    Search Volume
    b
    −30 −20 −10 0 10 20 30
    "Right Round"
    Week
    Rank
    40
    30
    20
    10
    c
    c
    c
    c
    c
    c
    c
    c
    c
    c
    c
    c
    c
    c
    c
    c
    c
    c
    c
    c
    c
    c
    c
    c
    c
    c
    c
    c
    c
    c
    c
    c
    c
    c
    c
    c
    c
    c
    c
    c
    c
    c
    Mar−09 Apr−09 May−09 Jun−09 Jul−09 Aug−09
    Billboard
    Search
    Jake Hofman (Columbia University) Introduction and Overview January 25, 2019 18 / 58

    View Slide

  22. Search predictions
    Search models
    For movies and video games, predict opening weekend box office
    and first month sales, respectively:
    log(revenue) = β0 + β1 log(search) +
    For music, predict following week’s Billboard Hot 100 rank:
    billboardt+1 = β0 + β1
    searcht + β2
    searcht−1 +
    Jake Hofman (Columbia University) Introduction and Overview January 25, 2019 19 / 58

    View Slide

  23. Search predictions
    Search volume
    Jake Hofman (Columbia University) Introduction and Overview January 25, 2019 20 / 58

    View Slide

  24. Search predictions
    Search models
    Search activity is predictive for movies, video games, and music
    weeks to months in advance
    Movies
    Predicted Revenue (Dollars)
    Actual Revenue (Dollars)
    103
    104
    105
    106
    107
    108
    109


    ● ●


    ● ●


    ●●


    a
    a
    a
    a
    a
    a
    a
    a
    a
    a
    a
    a
    a
    a
    a
    a
    a
    a
    a
    a
    a
    a
    a
    a
    a
    a
    a
    a
    a
    a
    a
    a
    a
    a
    a
    a
    a
    a
    a
    a
    a
    a
    a
    a
    a
    a
    a
    a
    a
    a
    a
    a
    a
    a
    a
    a
    a
    a
    a
    a
    a
    a
    a
    a
    a
    a
    a
    a
    a
    a
    a
    a
    a
    a
    a
    a
    a
    a
    a
    a
    a
    a
    a
    a
    a
    a
    a
    a
    a
    a
    a
    a
    a
    a
    a
    a
    a
    a
    a
    a
    a
    a
    a
    a
    a
    a
    a
    a
    a
    a
    a
    a
    a
    a
    a
    a
    a
    a
    a
    103 104 105 106 107 108 109
    Video Games
    Predicted Revenue (Dollars)
    Actual Revenue (Dollars)
    103
    104
    105
    106
    107


    ● ●


    b
    b
    b
    b
    b
    b
    b
    b
    b
    b
    b
    b
    b
    b
    b
    b
    b
    b
    b
    b
    b
    b
    b
    b
    b
    b
    b
    b
    b
    b
    b
    b
    b
    b
    b
    b
    b
    b
    b
    b
    b
    b
    b
    b
    b
    b
    b
    b
    b
    b
    b
    b
    b
    b
    b
    b
    b
    b
    b
    b
    b
    b
    b
    b
    b
    b
    b
    b
    b
    b
    b
    b
    b
    b
    b
    b
    b
    b
    b
    b
    b
    b
    b
    b
    b
    b
    b
    b
    b
    b
    b
    b
    b
    b
    b
    b
    b
    b
    b
    b
    b
    b
    b
    b
    b
    b
    103 104 105 106 107
    ● Non−Sequel
    Sequel
    Music
    Predicted Billboard Rank
    Actual Billboard Rank
    0
    20
    40
    60
    80
    100


    ● ●


    ● ●


    c
    0 20 40 60 80 100
    Movies
    Time to Release (Weeks)
    Model Fit
    0.4
    0.5
    0.6
    0.7
    0.8
    0.9 d
    d
    d
    d
    d
    d
    d
    −6 −5 −4 −3 −2 −1 0
    Video Games
    Time to Release (Weeks)
    Model Fit
    0.4
    0.5
    0.6
    0.7
    0.8
    0.9 e
    e
    e
    e
    e
    e
    e
    −6 −5 −4 −3 −2 −1 0
    Music
    Time to Release (Weeks)
    Model Fit
    0.4
    0.5
    0.6
    0.7
    0.8
    0.9 f
    f
    f
    f
    f
    f
    f
    −6 −5 −4 −3 −2 −1 0
    Jake Hofman (Columbia University) Introduction and Overview January 25, 2019 21 / 58

    View Slide

  25. Search predictions
    Baseline models
    For movies, use budget, number of opening screens and Hollywood
    Stock Exchange:
    log(revenue) = β0 + β1 log(budget) + β2 log(screens) +
    β3 log(hsx) +
    Jake Hofman (Columbia University) Introduction and Overview January 25, 2019 22 / 58

    View Slide

  26. Search predictions
    Baseline models
    For video games, use critic ratings and predecessor sales (sequels
    only):
    log(revenue) = β0 + β1
    rating + β2 log(predecessor) +
    Jake Hofman (Columbia University) Introduction and Overview January 25, 2019 22 / 58

    View Slide

  27. Search predictions
    Baseline models
    For music, use an autoregressive model with the previously
    available rank:
    billboardt+1 = β0 + β1
    billboardt−1 +
    Jake Hofman (Columbia University) Introduction and Overview January 25, 2019 22 / 58

    View Slide

  28. Search predictions
    Baseline + combined models
    Baseline models are often surprisingly good
    Movies (Baseline)
    Predicted Revenue (Dollars)
    Actual Revenue (Dollars)
    103
    104
    105
    106
    107
    108
    109


    ● ●


    ● ●


    ● ●


    a
    a
    a
    a
    a
    a
    a
    a
    a
    a
    a
    a
    a
    a
    a
    a
    a
    a
    a
    a
    a
    a
    a
    a
    a
    a
    a
    a
    a
    a
    a
    a
    a
    a
    a
    a
    a
    a
    a
    a
    a
    a
    a
    a
    a
    a
    a
    a
    a
    a
    a
    a
    a
    a
    a
    a
    a
    a
    a
    a
    a
    a
    a
    a
    a
    a
    a
    a
    a
    a
    a
    a
    a
    a
    a
    a
    a
    a
    a
    a
    a
    a
    a
    a
    a
    a
    a
    a
    a
    a
    a
    a
    a
    a
    a
    a
    a
    a
    a
    a
    a
    a
    a
    a
    a
    a
    a
    a
    a
    a
    a
    a
    a
    a
    a
    a
    a
    a
    a
    103 104 105 106 107 108 109
    Video Games (Baseline)
    Predicted Revenue (Dollars)
    Actual Revenue (Dollars)
    103
    104
    105
    106
    107


    b
    b
    b
    b
    b
    b
    b
    b
    b
    b
    b
    b
    b
    b
    b
    b
    b
    b
    b
    b
    b
    b
    b
    b
    b
    b
    b
    b
    b
    b
    b
    b
    b
    b
    b
    b
    b
    b
    b
    b
    b
    b
    b
    b
    b
    b
    b
    b
    b
    b
    b
    b
    b
    b
    b
    b
    b
    b
    b
    b
    b
    b
    b
    b
    b
    b
    b
    b
    b
    b
    b
    b
    b
    b
    b
    b
    b
    b
    b
    b
    b
    b
    b
    b
    b
    b
    b
    b
    b
    b
    b
    b
    b
    b
    b
    b
    b
    b
    b
    b
    b
    b
    b
    b
    b
    b
    103 104 105 106 107
    ● Non−Sequel
    Sequel
    Music (Baseline)
    Predicted Billboard Rank
    Actual Billboard Rank
    0
    20
    40
    60
    80
    100


    ● ●


    c
    0 20 40 60 80 100
    Movies (Combined)
    Predicted Revenue (Dollars)
    Actual Revenue (Dollars)
    103
    104
    105
    106
    107
    108
    109


    ● ●


    ● ●


    d
    d
    d
    d
    d
    d
    d
    d
    d
    d
    d
    d
    d
    d
    d
    d
    d
    d
    d
    d
    d
    d
    d
    d
    d
    d
    d
    d
    d
    d
    d
    d
    d
    d
    d
    d
    d
    d
    d
    d
    d
    d
    d
    d
    d
    d
    d
    d
    d
    d
    d
    d
    d
    d
    d
    d
    d
    d
    d
    d
    d
    d
    d
    d
    d
    d
    d
    d
    d
    d
    d
    d
    d
    d
    d
    d
    d
    d
    d
    d
    d
    d
    d
    d
    d
    d
    d
    d
    d
    d
    d
    d
    d
    d
    d
    d
    d
    d
    d
    d
    d
    d
    d
    d
    d
    d
    d
    d
    d
    d
    d
    d
    d
    d
    d
    d
    d
    d
    d
    103 104 105 106 107 108 109
    Video Games (Combined)
    Predicted Revenue (Dollars)
    Actual Revenue (Dollars)
    103
    104
    105
    106
    107


    ●●


    e
    e
    e
    e
    e
    e
    e
    e
    e
    e
    e
    e
    e
    e
    e
    e
    e
    e
    e
    e
    e
    e
    e
    e
    e
    e
    e
    e
    e
    e
    e
    e
    e
    e
    e
    e
    e
    e
    e
    e
    e
    e
    e
    e
    e
    e
    e
    e
    e
    e
    e
    e
    e
    e
    e
    e
    e
    e
    e
    e
    e
    e
    e
    e
    e
    e
    e
    e
    e
    e
    e
    e
    e
    e
    e
    e
    e
    e
    e
    e
    e
    e
    e
    e
    e
    e
    e
    e
    e
    e
    e
    e
    e
    e
    e
    e
    e
    e
    e
    e
    e
    e
    e
    e
    e
    e
    103 104 105 106 107
    ● Non−Sequel
    Sequel
    Music (Combined)
    Predicted Billboard Rank
    Actual Billboard Rank
    0
    20
    40
    60
    80
    100


    ● ●


    f
    0 20 40 60 80 100
    Jake Hofman (Columbia University) Introduction and Overview January 25, 2019 23 / 58

    View Slide

  29. Search predictions
    Model comparison
    For movies, search is outperformed by the baseline and of little
    marginal value
    Model Fit
    0.4
    0.5
    0.6
    0.7
    0.8
    0.9
    1.0
    Combined
    Combined
    Combined
    Combined
    Combined
    Combined
    Combined
    Combined
    Combined
    Combined
    Combined
    Combined
    Combined
    Combined
    Combined
    Search
    Search
    Search
    Search
    Search
    Search
    Search
    Search
    Search
    Search
    Search
    Search
    Search
    Search
    Search
    Baseline
    Baseline
    Baseline
    Baseline
    Baseline
    Baseline
    Baseline
    Baseline
    Baseline
    Baseline
    Baseline
    Baseline
    Baseline
    Baseline
    Baseline
    N
    onsequel G
    am
    es
    Sequel G
    am
    es
    M
    usic
    M
    ovies
    Flu
    Jake Hofman (Columbia University) Introduction and Overview January 25, 2019 24 / 58

    View Slide

  30. Search predictions
    Model comparison
    For video games, search helps substantially for non-sequels, less so
    for sequels
    Model Fit
    0.4
    0.5
    0.6
    0.7
    0.8
    0.9
    1.0
    Combined
    Combined
    Combined
    Combined
    Combined
    Combined
    Combined
    Combined
    Combined
    Combined
    Combined
    Combined
    Combined
    Combined
    Combined
    Search
    Search
    Search
    Search
    Search
    Search
    Search
    Search
    Search
    Search
    Search
    Search
    Search
    Search
    Search
    Baseline
    Baseline
    Baseline
    Baseline
    Baseline
    Baseline
    Baseline
    Baseline
    Baseline
    Baseline
    Baseline
    Baseline
    Baseline
    Baseline
    Baseline
    N
    onsequel G
    am
    es
    Sequel G
    am
    es
    M
    usic
    M
    ovies
    Flu
    Jake Hofman (Columbia University) Introduction and Overview January 25, 2019 24 / 58

    View Slide

  31. Search predictions
    Model comparison
    For music, the addition of search yields a substantially better
    combined model
    Model Fit
    0.4
    0.5
    0.6
    0.7
    0.8
    0.9
    1.0
    Combined
    Combined
    Combined
    Combined
    Combined
    Combined
    Combined
    Combined
    Combined
    Combined
    Combined
    Combined
    Combined
    Combined
    Combined
    Search
    Search
    Search
    Search
    Search
    Search
    Search
    Search
    Search
    Search
    Search
    Search
    Search
    Search
    Search
    Baseline
    Baseline
    Baseline
    Baseline
    Baseline
    Baseline
    Baseline
    Baseline
    Baseline
    Baseline
    Baseline
    Baseline
    Baseline
    Baseline
    Baseline
    N
    onsequel G
    am
    es
    Sequel G
    am
    es
    M
    usic
    M
    ovies
    Flu
    Jake Hofman (Columbia University) Introduction and Overview January 25, 2019 24 / 58

    View Slide

  32. Search predictions
    Summary
    • Relative performance and value of search varies across
    domains
    • Search provides a fast, convenient, and flexible signal across
    domains
    • “Predicting consumer activity with Web search”
    Goel, Hofman, Lahaie, Pennock & Watts, PNAS 2010
    Jake Hofman (Columbia University) Introduction and Overview January 25, 2019 25 / 58

    View Slide

  33. P.S.
    POLICYFORUM
    In February 2013, Google Flu
    Trends (GFT) made 
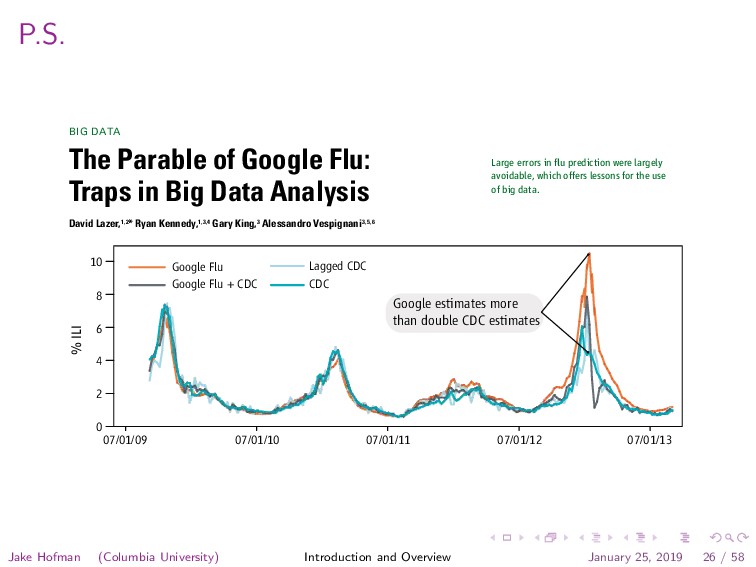
headlines
    but not for a reason that Google
    executives or the creators of the fl u
    tracking system would have hoped.
    Nature reported that GFT was pre-
    dicting more than double the pro-
    portion of doctor visits for influ-
    enza-like illness (ILI) than the Cen-
    ters for Disease Control and Preven-
    tion (CDC), which bases its esti-
    mates on surveillance reports from
    laboratories across the United States
    ( 1, 2). This happened despite the fact
    that GFT was built to predict CDC
    reports. Given that GFT is often held
    up as an exemplary use of big data
    ( 3, 4), what lessons can we draw
    from this error?
    The problems we identify are
    not limited to GFT. Research on
    whether search or social media can
    predict x has become common-
    place ( 5– 7) and is often put in sharp contrast
    with traditional methods and hypotheses.
    surement and construct validity and reli-
    ability and dependencies among data (12).
    the algorithm in 2009, and this
    model has run ever since, with a
    few changes announced in October
    2013 ( 10, 15).
    Although not widely reported
    until 2013, the new GFT has been
    persistently overestimating flu
    prevalence for a much longer time.
    GFT also missed by a very large
    margin in the 2011–2012 fl u sea-
    son and has missed high for 100 out
    of 108 weeks starting with August
    2011 (see the graph ). These errors
    are not randomly distributed. For
    example, last week’s errors predict
    this week’s errors (temporal auto-
    correlation), and the direction and
    magnitude of error varies with the
    time of year (seasonality). These
    patterns mean that GFT overlooks
    considerable information that
    could be extracted by traditional
    statistical methods.
    Even after GFT was updated in 2009,
    the comparative value of the algorithm as a
    The Parable of Google Flu:
    Traps in Big Data Analysis
    BIG DATA
    David Lazer, 1, 2 * Ryan Kennedy, 1, 3, 4 Gary King, 3 Alessandro Vespignani 3,5,6
    Large errors in fl u prediction were largely
    avoidable, which offers lessons for the use
    of big data.
    FINAL FINAL
    FINAL FINAL
    ounda-
    ntation
    ruct of
    ompa-
    e mea-
    imum,
    nstable
    ecause
    oogle’s
    ics are
    mprove
    nsum-
    nges in
    behav-
    e most
    0
    2
    4
    6
    8
    10
    07/01/09 07/01/10 07/01/11 07/01/12 07/01/13
    Google Flu Lagged CDC
    Google Flu + CDC CDC
    50
    100
    150
    Google Flu Lagged CDC
    Google Flu + CDC
    Google estimates more
    than double CDC estimates
    Google starts estimating
    high 100 out of 108 weeks
    % ILI
    % baseline)
    Jake Hofman (Columbia University) Introduction and Overview January 25, 2019 26 / 58

    View Slide

  34. Demographic diversity on the Web
    with Irmak Sirer and Sharad Goel (ICWSM 2012)
    Daily Per−Capita Pageviews
    0
    10
    20
    30
    40
    50
    60
    70
    q
    q
    q
    q
    q
    Over $25k
    Under $25k
    Black
    &
    Hispanic
    White
    No College
    Some College
    Over 65
    Under 65
    Female
    Male
    Income Race Education Age Sex
    Jake Hofman (Columbia University) Introduction and Overview January 25, 2019 27 / 58

    View Slide

  35. Motivation
    Previous work is largely survey-based and focuses and group-level
    differences in online access
    Jake Hofman (Columbia University) Introduction and Overview January 25, 2019 28 / 58

    View Slide

  36. Motivation
    “As of January 1997, we estimate that 5.2 million African
    Americans and 40.8 million whites have ever used the Web,
    and that 1.4 million African Americans and 20.3 million
    whites used the Web in the past week.”
    -Hoffman & Novak (1998)
    Jake Hofman (Columbia University) Introduction and Overview January 25, 2019 28 / 58

    View Slide

  37. Motivation
    Focus on activity instead of access
    How diverse is the Web?
    To what extent do online experiences vary across demographic
    groups?
    Jake Hofman (Columbia University) Introduction and Overview January 25, 2019 29 / 58

    View Slide

  38. Data
    • Representative sample of 265,000 individuals in the US, paid
    via the Nielsen MegaPanel3
    • Log of anonymized, complete browsing activity from June
    2009 through May 2010 (URLs viewed, timestamps, etc.)
    • Detailed individual and household demographic information
    (age, education, income, race, sex, etc.)
    3Special thanks to Mainak Mazumdar
    Jake Hofman (Columbia University) Introduction and Overview January 25, 2019 30 / 58

    View Slide

  39. Data
    # ls -alh nielsen_megapanel.tar
    -rw-r--r-- 100G Jul 17 13:00 nielsen_megapanel.tar
    Jake Hofman (Columbia University) Introduction and Overview January 25, 2019 31 / 58

    View Slide

  40. Data
    # ls -alh nielsen_megapanel.tar
    -rw-r--r-- 100G Jul 17 13:00 nielsen_megapanel.tar
    • Normalize pageviews to at most three domain levels, sans www
    e.g. www.yahoo.com → yahoo.com,
    us.mg2.mail.yahoo.com/neo/launch → mail.yahoo.com
    Jake Hofman (Columbia University) Introduction and Overview January 25, 2019 31 / 58

    View Slide

  41. Data
    # ls -alh nielsen_megapanel.tar
    -rw-r--r-- 100G Jul 17 13:00 nielsen_megapanel.tar
    • Normalize pageviews to at most three domain levels, sans www
    e.g. www.yahoo.com → yahoo.com,
    us.mg2.mail.yahoo.com/neo/launch → mail.yahoo.com
    • Restrict to top 100k (out of 9M+ total) most popular sites
    (by unique visitors)
    Jake Hofman (Columbia University) Introduction and Overview January 25, 2019 31 / 58

    View Slide

  42. Data
    # ls -alh nielsen_megapanel.tar
    -rw-r--r-- 100G Jul 17 13:00 nielsen_megapanel.tar
    • Normalize pageviews to at most three domain levels, sans www
    e.g. www.yahoo.com → yahoo.com,
    us.mg2.mail.yahoo.com/neo/launch → mail.yahoo.com
    • Restrict to top 100k (out of 9M+ total) most popular sites
    (by unique visitors)
    • Aggregate activity at the site, group, and user levels
    Jake Hofman (Columbia University) Introduction and Overview January 25, 2019 31 / 58

    View Slide

  43. Aggregate usage patterns
    How do users distribute their time across different categories?
    Fraction of total pageviews
    0.05
    0.10
    0.15
    0.20
    0.25
    q
    q
    q
    q q
    Social M
    edia
    E−m
    ail
    G
    am
    es
    Portals
    Search
    All groups spend the majority of their time in the top five most
    popular categories
    Jake Hofman (Columbia University) Introduction and Overview January 25, 2019 32 / 58

    View Slide

  44. Aggregate usage patterns
    How do users distribute their time across different categories?
    User Rank by Daily Activity
    Fraction of Pageviews in Category
    0.05
    0.10
    0.15
    0.20
    0.25
    0.30
    q
    q q q q
    q
    q
    q
    q
    q
    10% 30% 50% 70% 90%
    q Social Media
    E−mail
    Games
    Portals
    Search
    Highly active users devote nearly twice as much of their time to
    social media relative to typical individuals
    Jake Hofman (Columbia University) Introduction and Overview January 25, 2019 32 / 58

    View Slide

  45. Group-level activity
    How does browsing activity vary at the group level?
    Daily Per−Capita Pageviews
    0
    10
    20
    30
    40
    50
    60
    70
    q
    q
    q
    q
    q
    Over $25k
    Under $25k
    Black
    &
    Hispanic
    White
    No College
    Some College
    Over 65
    Under 65
    Female
    Male
    Income Race Education Age Sex
    Large differences exist even at the aggregate level
    (e.g. women on average generate 40% more pageviews than men)
    Jake Hofman (Columbia University) Introduction and Overview January 25, 2019 33 / 58

    View Slide

  46. Group-level activity
    How does browsing activity vary at the group level?
    Daily Per−Capita Pageviews
    0
    10
    20
    30
    40
    50
    60
    70
    q
    q
    q
    q
    q
    Over $25k
    Under $25k
    Black
    &
    Hispanic
    White
    No College
    Some College
    Over 65
    Under 65
    Female
    Male
    Income Race Education Age Sex
    Younger and more educated individuals are both more likely to
    access the Web and more active once they do
    Jake Hofman (Columbia University) Introduction and Overview January 25, 2019 33 / 58

    View Slide

  47. Group-level activity
    All demographic groups spend the majority of their time in the
    same categories
    Age
    Fraction of total pageviews
    0.0
    0.1
    0.2
    0.3
    0.4
    0.5
    q
    q
    q
    q
    q
    q
    q q
    q
    q
    q
    q
    q
    q
    q q
    5 10 15 20 25 30 35 40 45 50 55 60 65 70 75 80
    q Social Media
    E−mail
    Games
    Portals
    Search
    Fraction of total pageviews
    0.0
    0.1
    0.2
    0.3
    0.4
    Education
    ● ●


    G
    ram
    m
    ar School
    Som
    e
    H
    igh
    School
    H
    igh
    School G
    raduate
    Som
    e
    C
    ollege
    Associate
    D
    egree
    Bachelor's
    D
    egree
    Post G
    raduate
    D
    egree
    Sex


    Fem
    ale
    M
    ale
    Income

    ● ●


    $0−25k
    $25−50k
    $50−75k
    $75−100k
    $100−150k
    $150k+
    Race
    ● ●
    ● ●

    O
    ther
    H
    ispanic
    Black
    W
    hite
    Asian
    Jake Hofman (Columbia University) Introduction and Overview January 25, 2019 34 / 58

    View Slide

  48. Group-level activity
    Older, more educated, male, wealthier, and Asian Internet users
    spend a smaller fraction of their time on social media
    Age
    Fraction of total pageviews
    0.0
    0.1
    0.2
    0.3
    0.4
    0.5
    q
    q
    q
    q
    q
    q
    q q
    q
    q
    q
    q
    q
    q
    q q
    5 10 15 20 25 30 35 40 45 50 55 60 65 70 75 80
    q Social Media
    E−mail
    Games
    Portals
    Search
    Fraction of total pageviews
    0.0
    0.1
    0.2
    0.3
    0.4
    Education
    ● ●


    G
    ram
    m
    ar School
    Som
    e
    H
    igh
    School
    H
    igh
    School G
    raduate
    Som
    e
    C
    ollege
    Associate
    D
    egree
    Bachelor's
    D
    egree
    Post G
    raduate
    D
    egree
    Sex


    Fem
    ale
    M
    ale
    Income

    ● ●


    $0−25k
    $25−50k
    $50−75k
    $75−100k
    $100−150k
    $150k+
    Race
    ● ●
    ● ●

    O
    ther
    H
    ispanic
    Black
    W
    hite
    Asian
    Jake Hofman (Columbia University) Introduction and Overview January 25, 2019 34 / 58

    View Slide

  49. Group-level activity
    Lower social media use by these groups is often accompanied by
    higher e-mail volume
    Age
    Fraction of total pageviews
    0.0
    0.1
    0.2
    0.3
    0.4
    0.5
    q
    q
    q
    q
    q
    q
    q q
    q
    q
    q
    q
    q
    q
    q q
    5 10 15 20 25 30 35 40 45 50 55 60 65 70 75 80
    q Social Media
    E−mail
    Games
    Portals
    Search
    Fraction of total pageviews
    0.0
    0.1
    0.2
    0.3
    0.4
    Education
    ● ●


    G
    ram
    m
    ar School
    Som
    e
    H
    igh
    School
    H
    igh
    School G
    raduate
    Som
    e
    C
    ollege
    Associate
    D
    egree
    Bachelor's
    D
    egree
    Post G
    raduate
    D
    egree
    Sex


    Fem
    ale
    M
    ale
    Income

    ● ●


    $0−25k
    $25−50k
    $50−75k
    $75−100k
    $100−150k
    $150k+
    Race
    ● ●
    ● ●

    O
    ther
    H
    ispanic
    Black
    W
    hite
    Asian
    Jake Hofman (Columbia University) Introduction and Overview January 25, 2019 34 / 58

    View Slide

  50. Revisiting the digital divide
    How does usage of news, health, and reference vary with
    demographics?
    Average pageviews per month
    0
    2
    4
    6
    8
    10
    12
    Education


    ● ●


    G
    ram
    m
    ar School
    Som
    e
    H
    igh
    School
    H
    igh
    School G
    raduate
    Som
    e
    C
    ollege
    Associate
    D
    egree
    Bachelor's
    D
    egree
    Post G
    raduate
    D
    egree
    Sex


    Fem
    ale
    M
    ale
    Income
    ● ● ●


    $0−25k
    $25−50k
    $50−75k
    $75−100k
    $100−150k
    $150k+
    Race
    ● ●


    O
    ther
    H
    ispanic
    Black
    W
    hite
    Asian
    ● News
    Health
    Reference
    Post-graduates spend three times as much time on health sites
    than adults with only some high school education
    Jake Hofman (Columbia University) Introduction and Overview January 25, 2019 35 / 58

    View Slide

  51. Revisiting the digital divide
    How does usage of news, health, and reference vary with
    demographics?
    Average pageviews per month
    0
    2
    4
    6
    8
    10
    12
    Education


    ● ●


    G
    ram
    m
    ar School
    Som
    e
    H
    igh
    School
    H
    igh
    School G
    raduate
    Som
    e
    C
    ollege
    Associate
    D
    egree
    Bachelor's
    D
    egree
    Post G
    raduate
    D
    egree
    Sex


    Fem
    ale
    M
    ale
    Income
    ● ● ●


    $0−25k
    $25−50k
    $50−75k
    $75−100k
    $100−150k
    $150k+
    Race
    ● ●


    O
    ther
    H
    ispanic
    Black
    W
    hite
    Asian
    ● News
    Health
    Reference
    Asians spend more than 50% more time browsing online news than
    do other race groups
    Jake Hofman (Columbia University) Introduction and Overview January 25, 2019 35 / 58

    View Slide

  52. Revisiting the digital divide
    How does usage of news, health, and reference vary with
    demographics?
    Average pageviews per month
    0
    2
    4
    6
    8
    10
    12
    Education


    ● ●


    G
    ram
    m
    ar School
    Som
    e
    H
    igh
    School
    H
    igh
    School G
    raduate
    Som
    e
    C
    ollege
    Associate
    D
    egree
    Bachelor's
    D
    egree
    Post G
    raduate
    D
    egree
    Sex


    Fem
    ale
    M
    ale
    Income
    ● ● ●


    $0−25k
    $25−50k
    $50−75k
    $75−100k
    $100−150k
    $150k+
    Race
    ● ●


    O
    ther
    H
    ispanic
    Black
    W
    hite
    Asian
    ● News
    Health
    Reference
    Even when less educated and less wealthy groups gain access to
    the Web, they utilize these resources relatively infrequently
    Jake Hofman (Columbia University) Introduction and Overview January 25, 2019 35 / 58

    View Slide

  53. Revisiting the digital divide
    How does usage of news, health, and reference vary with
    demographics?
    Average pageviews per month
    0
    2
    4
    6
    8
    10
    12
    News
    q
    q q
    q
    q
    H
    igh
    School G
    raduate
    Som
    e
    C
    ollege
    Associate
    D
    egree
    Bachelor's
    D
    egree
    Post G
    raduate
    D
    egree
    Health
    q
    q q
    q q
    H
    igh
    School G
    raduate
    Som
    e
    C
    ollege
    Associate
    D
    egree
    Bachelor's
    D
    egree
    Post G
    raduate
    D
    egree
    Reference
    q
    q q
    q q
    H
    igh
    School G
    raduate
    Som
    e
    C
    ollege
    Associate
    D
    egree
    Bachelor's
    D
    egree
    Post G
    raduate
    D
    egree
    Asian
    Black
    Hispanic
    White
    Controlling for other variables, effects of race and gender largely
    disappear, while education continues to have large effect
    pi =
    j
    αj xij +
    j k
    βjkxij xik +
    j
    γj
    x2
    ij
    + i
    Jake Hofman (Columbia University) Introduction and Overview January 25, 2019 36 / 58

    View Slide

  54. Revisiting the digital divide
    How does usage of news, health, and reference vary with
    demographics?
    Average pageviews per month
    0
    2
    4
    6
    8
    10
    12
    Health
    q
    q q
    q q
    H
    igh
    School G
    raduate
    Som
    e
    C
    ollege
    Associate
    D
    egree
    Bachelor's
    D
    egree
    Post G
    raduate
    D
    egree
    Female
    Male
    However, women spend considerably more time on health sites
    compared to men
    Jake Hofman (Columbia University) Introduction and Overview January 25, 2019 37 / 58

    View Slide

  55. Revisiting the digital divide
    How does usage of news, health, and reference vary with
    demographics?
    Monthly pageviews on health sites
    20 40 60 80 100
    Female
    Male
    However, women spend considerably more time on health sites
    compared to men, although means can be misleading
    Jake Hofman (Columbia University) Introduction and Overview January 25, 2019 37 / 58

    View Slide

  56. Individual-level prediction
    How well can one predict an individual’s demographics from their
    browsing activity?
    • Represent each user by the set of sites visited
    • Fit linear models4 to predict majority/minority for each
    attribute on 80% of users
    • Tune model parameters using a 10% validation set
    • Evaluate final performance on held-out 10% test set
    4http://bit.ly/svmperf
    Jake Hofman (Columbia University) Introduction and Overview January 25, 2019 38 / 58

    View Slide

  57. Individual-level prediction
    Reasonable (∼70-85%) accuracy and AUC across all attributes
    College/No College
    Under/Over $50,000
    Household Income
    White/Non−White
    Female/Male
    Over/Under 25
    Years Old
    Accuracy
    q
    q
    q
    q
    q
    .5 .6 .7 .8 .9 1
    AUC
    q
    q
    q
    q
    q
    .5 .6 .7 .8 .9 1
    Jake Hofman (Columbia University) Introduction and Overview January 25, 2019 39 / 58

    View Slide

  58. Individual-level prediction
    Highly-weighted sites under the fitted models
    Large positive weight Large negative weight
    Female
    winster.com
    lancome-usa.com
    sports.yahoo.com
    espn.go.com
    White
    marlboro.com
    cmt.com
    mediatakeout.com
    bet.com
    College Educated
    news.yahoo.com
    linkedin.com
    youtube.com
    myspace.com
    Over 25 Years Old
    evite.com
    classmates.com
    addictinggames.com
    youtube.com
    Household Income
    Under $50,000
    eharmony.com
    tracfone.com
    rownine.com
    matrixdirect.com
    Table 2: A selection of the most predictive (i.e., most highly weighted) sites for each classification task.
    College/No College
    Under/Over $50,000
    Household Income
    White/Non−White
    Female/Male
    Over/Under 25
    Years Old
    AUC
    !
    !
    !
    !
    !
    .5 .6 .7 .8 .9 1
    Accuracy
    !
    !
    !
    !
    !
    .5 .6 .7 .8 .9 1
    Figure 7, a measure that effectively re-normalizes the ma-
    jority and minority classes to have equal size. Intuitively,
    AUC is the probability that a model scores a randomly se-
    lected positive example higher than a randomly selected neg-
    ative one (e.g., the probability that the model correctly dis-
    tinguishes between a randomly selected female and male).
    Though an uninformative rule would correctly discriminate
    between such pairs 50% of the time, predictions based on
    Jake Hofman (Columbia University) Introduction and Overview January 25, 2019 40 / 58

    View Slide

  59. Individual-level prediction
    Proof of concept browser demo
    http://bit.ly/surfpreds
    (deprecated)
    Jake Hofman (Columbia University) Introduction and Overview January 25, 2019 41 / 58

    View Slide

  60. Summary
    • Highly active users spend disproportionately more of their
    time on social media and less on e-mail relative to the overall
    population
    • Access to research, news, and healthcare is strongly related to
    education, not as closely to ethnicity
    • User demographics can be inferred from browsing activity with
    reasonable accuracy
    • “Who Does What on the Web”, Goel, Hofman & Sirer,
    ICWSM 2012
    Jake Hofman (Columbia University) Introduction and Overview January 25, 2019 42 / 58

    View Slide

  61. The structural virality of online diffusion
    with Ashton Anderson, Sharad Goel, Duncan Watts (Management Science 2015)
    Jake Hofman (Columbia University) Introduction and Overview January 25, 2019 43 / 58

    View Slide

  62. “Going Viral”?
    Jake Hofman (Columbia University) Introduction and Overview January 25, 2019 44 / 58

    View Slide

  63. “Going Viral”?
    Jake Hofman (Columbia University) Introduction and Overview January 25, 2019 45 / 58

    View Slide

  64. “Going Viral”?
    “Therefore we ... wish to proceed with great care as is
    proper, and to cut off the advance of this plague and
    cancerous disease so it will not spread any further ...”5
    -Pope Leo X
    Exsurge Domine (1520)
    5http://www.economist.com/node/21541719
    Jake Hofman (Columbia University) Introduction and Overview January 25, 2019 45 / 58

    View Slide

  65. “Going Viral”?
    Rogers (1962), Bass (1969)
    Jake Hofman (Columbia University) Introduction and Overview January 25, 2019 46 / 58

    View Slide

  66. “Going viral”?
    Jake Hofman (Columbia University) Introduction and Overview January 25, 2019 47 / 58

    View Slide

  67. “Going viral”?
    Jake Hofman (Columbia University) Introduction and Overview January 25, 2019 47 / 58

    View Slide

  68. “Going viral”?
    How do popular things become popular?
    Jake Hofman (Columbia University) Introduction and Overview January 25, 2019 48 / 58

    View Slide

  69. Data
    • Examined one year of tweets from July 2011 to July 2012
    Jake Hofman (Columbia University) Introduction and Overview January 25, 2019 49 / 58

    View Slide

  70. Data
    • Examined one year of tweets from July 2011 to July 2012
    • Restricted to 1.4 billion tweets containing links to top news,
    videos, images, and petitions sites
    Jake Hofman (Columbia University) Introduction and Overview January 25, 2019 49 / 58

    View Slide

  71. Data
    • Examined one year of tweets from July 2011 to July 2012
    • Restricted to 1.4 billion tweets containing links to top news,
    videos, images, and petitions sites
    • Aggregated tweets by URL, resulting in 1 billion distinct
    “events”
    Jake Hofman (Columbia University) Introduction and Overview January 25, 2019 49 / 58

    View Slide

  72. Data
    • Examined one year of tweets from July 2011 to July 2012
    • Restricted to 1.4 billion tweets containing links to top news,
    videos, images, and petitions sites
    • Aggregated tweets by URL, resulting in 1 billion distinct
    “events”
    • Crawled friend list of each adopter
    Jake Hofman (Columbia University) Introduction and Overview January 25, 2019 49 / 58

    View Slide

  73. Data
    • Examined one year of tweets from July 2011 to July 2012
    • Restricted to 1.4 billion tweets containing links to top news,
    videos, images, and petitions sites
    • Aggregated tweets by URL, resulting in 1 billion distinct
    “events”
    • Crawled friend list of each adopter
    • Inferred “who got what from whom” to construct diffusion
    trees
    Jake Hofman (Columbia University) Introduction and Overview January 25, 2019 49 / 58

    View Slide

  74. Data
    • Examined one year of tweets from July 2011 to July 2012
    • Restricted to 1.4 billion tweets containing links to top news,
    videos, images, and petitions sites
    • Aggregated tweets by URL, resulting in 1 billion distinct
    “events”
    • Crawled friend list of each adopter
    • Inferred “who got what from whom” to construct diffusion
    trees
    • Characterized size and structure of trees
    Jake Hofman (Columbia University) Introduction and Overview January 25, 2019 49 / 58

    View Slide

  75. The Structural Virality of Online Diffusion
    A
    B
    D
    C
    E
    Time
    Jake Hofman (Columbia University) Introduction and Overview January 25, 2019 50 / 58

    View Slide

  76. Information diffusion
    Cascade size distribution
    0.00001%
    0.0001%
    0.001%
    0.01%
    0.1%
    1%
    10%
    1 10 100 1,000 10,000
    Cascade Size
    CCDF
    Focus on the rare hits that get at least 100 adoptions
    Jake Hofman (Columbia University) Introduction and Overview January 25, 2019 51 / 58

    View Slide

  77. Quantifying structure
    Measure the average distance between all pairs of nodes6
    6Weiner (1947); correlated with other possible metrics
    Jake Hofman (Columbia University) Introduction and Overview January 25, 2019 52 / 58

    View Slide

  78. Information diffusion
    Size and virality by category
    Remarkable structural diversity across across categories
    0.001%
    0.01%
    0.1%
    1%
    10%
    100%
    100 1,000 10,000
    Cascade Size
    CCDF
    Videos
    Pictures
    News
    Petitions
    0.001%
    0.01%
    0.1%
    1%
    10%
    100%
    3 10 30
    Structural Virality
    CCDF
    Videos
    Pictures
    News
    Petitions
    Jake Hofman (Columbia University) Introduction and Overview January 25, 2019 53 / 58

    View Slide

  79. Information diffusion
    Structural diversity
    0 50 100 150
    time
    size
    0 5 10 15 20
    time
    size
    0 20 40 60 80 100 120 140
    time
    size
    0 20 40 60 80 100 120
    time
    size
    0.0 0.5 1.0 1.5
    time
    size
    0 10 20 30 40 50 60 70
    time
    size
    Jake Hofman (Columbia University) Introduction and Overview January 25, 2019 54 / 58

    View Slide

  80. Information diffusion
    Structural diversity
    Size is relatively poor predictive of structure
    Jake Hofman (Columbia University) Introduction and Overview January 25, 2019 55 / 58

    View Slide

  81. Summary
    Popular = Viral
    Jake Hofman (Columbia University) Introduction and Overview January 25, 2019 56 / 58

    View Slide

  82. Information diffusion
    Summary
    • Most cascades fail, resulting in fewer than two adoptions, on
    average
    • Of the hits that do succeed, we observe a wide range of
    diverse diffusion structures
    • It’s difficult to say how something spread given only its
    popularity
    • “The structural virality of online diffusion”, Anderson, Goel,
    Hofman & Watts (Management Science 2015)
    Jake Hofman (Columbia University) Introduction and Overview January 25, 2019 57 / 58

    View Slide

  83. 1. Ask good questions
    There’s nothing interesting in the data without them
    Jake Hofman (Columbia University) Introduction and Overview January 25, 2019 58 / 58

    View Slide

  84. 2. Think before you code
    5 minutes at the whiteboard is worth an hour at the keyboard
    Jake Hofman (Columbia University) Introduction and Overview January 25, 2019 58 / 58

    View Slide

  85. 3. Keep the answers simple
    Exploratory data analysis and linear models go a long way
    Jake Hofman (Columbia University) Introduction and Overview January 25, 2019 58 / 58

    View Slide

  86. 4. Replication is key
    Otherwise it’s easy to get fooled by randomness and difficult to
    assess progress
    Jake Hofman (Columbia University) Introduction and Overview January 25, 2019 58 / 58

    View Slide