Upgrade to Pro
— share decks privately, control downloads, hide ads and more …
Speaker Deck
Features
Speaker Deck
PRO
Sign in
Sign up for free
Search
Search
Prophetを使った時系列予測
Search
Kan Nishida
February 26, 2020
Technology
2k
1
Share
Embed
Copy iframe code
Copy JS code
Copy link
Start on current slide
Prophetを使った時系列予測
- Prophetアルゴリズムの基本
- 検証のやり方
- 季節性での加法と乗法の使い分け
- 変数重要度と変数ごとの効果
Kan Nishida
February 26, 2020
More Decks by Kan Nishida
See All by Kan Nishida
Seminar #52 - Introduction to Exploratory Server
kanaugust
0
490
Exploratory セミナー #61 政府のオープンデータ e-Statの活用
kanaugust
0
1.2k
Exploratory セミナー #60 時系列データの加工、可視化、分析手法の紹介
kanaugust
0
1.4k
Seminar #51 - Machine Learning - How Variable Importance Works
kanaugust
0
810
Exploratory セミナー #59 テキストデータの加工
kanaugust
0
800
Seminar #50 - Salesforce Data, Clean, Visualize, Analyze, & Dashboard
kanaugust
1
550
Exploratory セミナー #58 Exploratory x Salesforce
kanaugust
0
400
Exploratory Seminar #49 - Introduction to Dashboard Cycle with Exploratory
kanaugust
0
590
Seminar #48 - Introduction to Exploratory v6.6
kanaugust
0
470
Other Decks in Technology
See All in Technology
Gen3R: 3D Scene Generation Meets Feed-Forward Reconstruction
spatial_ai_network
0
110
ZOZOTOWNの進化と信頼性を両立する負荷試験
zozotech
PRO
2
160
AICoEでAIネイティブ組織への進化
yukiogawa
0
120
キャリアの中で本を作る / Making a Book During Your Career
ak1210
0
130
SRE Lounge Hiroshimaへの招待
grimoh
0
620
Terraform共通モジュールをチーム横断で“変えられる”運用へ ― リリースと適用の分離
kekke_n
1
2.7k
最適な自走を最小限の支援で — M&Aで拡大する組織で少人数SREが挑んだ1年 / SRE NEXT 2026
genda
0
1k
貴方はどのエンジニアリングを磨くのか
hatyibei
0
110
完全自律ロボットを作りたくて、先に開発を自律させた話(ROS Japan UG #63 LT)
rryz09
0
440
環境凍結という Toil を倒す -セルフサービス型 Ephemeral テスト環境の 設計と実践
shirouz
1
2.2k
人を動かすのは時間ではなく、納得感 〜新任EMが入社3ヶ月、組織を2回変えた話〜
kakehashi
PRO
3
210
Claude Code 珍プレー好プレー
shinyasaita
0
320
Featured
See All Featured
Faster Mobile Websites
deanohume
310
32k
Technical Leadership for Architectural Decision Making
baasie
3
440
How to optimise 3,500 product descriptions for ecommerce in one day using ChatGPT
katarinadahlin
PRO
1
3.7k
Templates, Plugins, & Blocks: Oh My! Creating the theme that thinks of everything
marktimemedia
31
2.8k
Building a Modern Day E-commerce SEO Strategy
aleyda
45
9.1k
4 Signs Your Business is Dying
shpigford
187
22k
Context Engineering - Making Every Token Count
addyosmani
9
1k
Sam Torres - BigQuery for SEOs
techseoconnect
PRO
0
300
Data-driven link building: lessons from a $708K investment (BrightonSEO talk)
szymonslowik
1
1.2k
Building Flexible Design Systems
yeseniaperezcruz
330
40k
SEO Brein meetup: CTRL+C is not how to scale international SEO
lindahogenes
1
2.8k
So, you think you're a good person
axbom
PRO
2
2.1k
Transcript
Exploratory ηϛφʔ #25 ProphetΛͬͨ࣌ܥྻ༧ଌ
EXPLORATORY
3 εϐʔΧʔ ా צҰ CEO EXPLORATORY ུྺ 2016य़ɺσʔλαΠΤϯεͷຽओԽͷͨΊɺExploratory, Inc Λཱ
্ͪ͛Δɻ Exploratory, Inc.ͰCEOΛΊΔ͔ͨΘΒɺσʔλαΠΤϯεɾϒʔ τΩϟϯϓɾτϨʔχϯάͳͲΛ௨ͯ͠σʔλαΠΤϯεͷٕज़ͱख ๏ͷීٴͱڭҭʹऔΓΉɻ ถΦϥΫϧຊࣾͰɺ16ʹΘͨΓσʔλαΠΤϯεͷ։ൃνʔϜΛ ͍ɺػցֶशɺϏοάɾσʔλɺϏδωεɾΠϯςϦδΣϯεɺσʔ λϕʔεʹؔ͢Δଟ͘ͷΛੈʹૹΓग़ͨ͠ɻ @KanAugust
Vision ΑΓΑ͍ҙࢥܾఆΛ͢ΔͨΊʹ σʔλΛ͏͜ͱ͕ͨΓલʹͳΔ
Mission σʔλαΠΤϯεͷຽओԽ
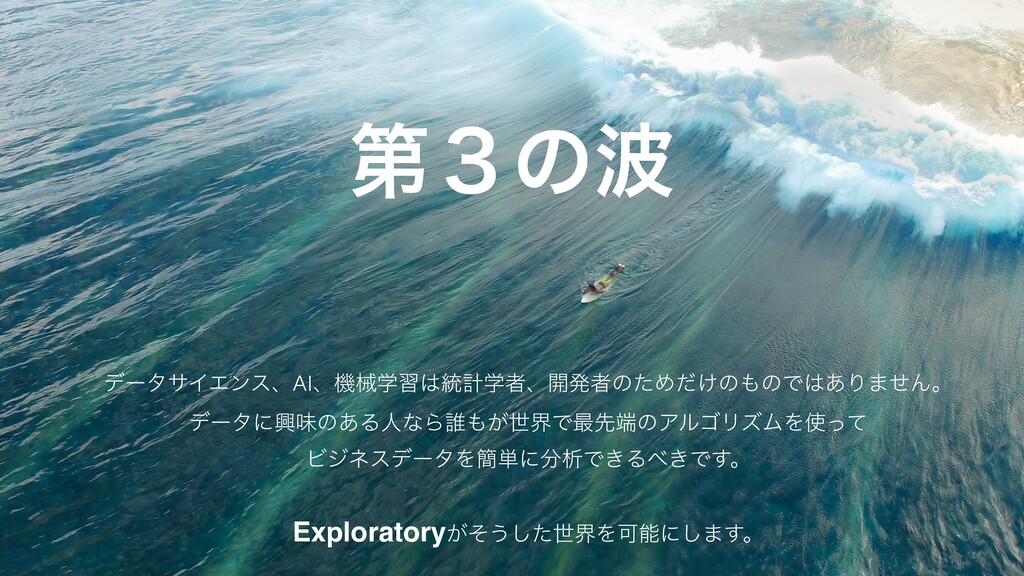
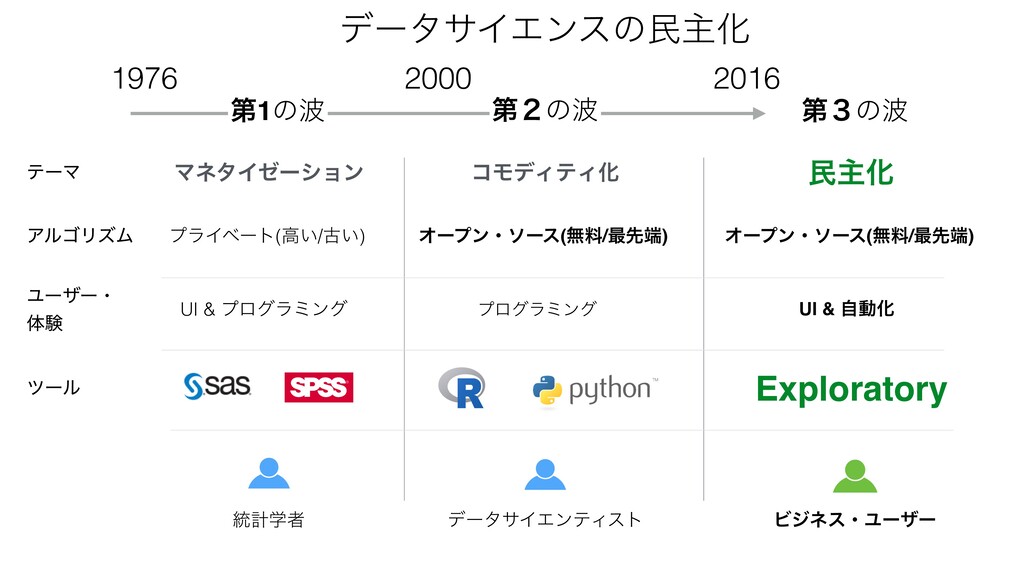
6 ୈ̏ͷ σʔλαΠΤϯεɺAIɺػցֶश౷ܭֶऀɺ։ൃऀͷͨΊ͚ͩͷͷͰ͋Γ·ͤΜɻ σʔλʹڵຯͷ͋ΔਓͳΒ୭͕ੈքͰ࠷ઌͷΞϧΰϦζϜΛͬͯ ϏδωεσʔλΛ؆୯ʹੳͰ͖Δ͖Ͱ͢ɻ Exploratory͕ͦ͏ͨ͠ੈքΛՄೳʹ͠·͢ɻ
ୈ1ͷ ୈ̎ͷ ୈ̏ͷ ϓϥΠϕʔτ(ߴ͍/ݹ͍) Φʔϓϯɾιʔε(ແྉ/࠷ઌ) UI & ϓϩάϥϛϯά ϓϩάϥϛϯά 2016
2000 1976 ϚωλΠθʔγϣϯ ίϞσΟςΟԽ ຽओԽ ౷ܭֶऀ σʔλαΠΤϯςΟετ Exploratory ΞϧΰϦζϜ Ϣʔβʔɾ ମݧ πʔϧ Φʔϓϯɾιʔε(ແྉ/࠷ઌ) UI & ࣗಈԽ ϏδωεɾϢʔβʔ ςʔϚ σʔλαΠΤϯεͷຽओԽ
質問 ExploratoryɹϞμϯˍγϯϓϧ UI 伝える データアクセス データ ラングリング 可視化 アナリティクス 統計/機械学習
Exploratory ηϛφʔ #25 ProphetΛͬͨ࣌ܥྻ༧ଌ
࣌ܥྻ༧ଌϞσϧ • ڭࢣ͋ΓֶशͷҰछɻ • աڈͷ࣌ܥྻσʔλΛτϨʔχϯάσʔλͱͯ͠ɺকདྷͷΛ༧ଌ ͢ΔϞσϧΛ࡞Δɻ 10
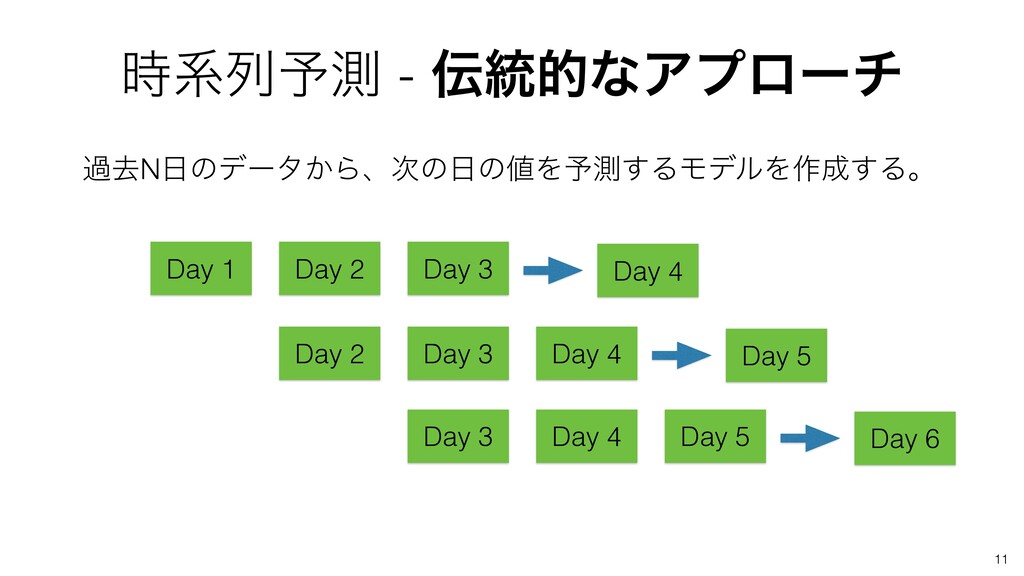
11 աڈNͷσʔλ͔Βɺ࣍ͷͷΛ༧ଌ͢ΔϞσϧΛ࡞͢Δɻ ࣌ܥྻ༧ଌ - ౷తͳΞϓϩʔν Day 1 Day 2 Day
3 Day 4 Day 2 Day 3 Day 4 Day 5 Day 3 Day 4 Day 5 Day 6
12 • σʔλؒͷִ࣌ؒؒσʔλΛ௨ͯ͠ҰఆͰ͋Δඞཁ͕͋Δɻ • ͕NA (ܽଛ)ͱͳΔ͕͋ͬͯͳΒͳ͍ɻ • ෳͷपظੑ (िͱ) Λಉ࣌ʹѻ͏ͷ͍͠ɻ
• ύϥϝʔλͷઃఆʹɺઐతͳ͕ࣝඞཁɻ ౷తͳΞϓϩʔνͰͷ࣌ܥྻ༧ଌͷ
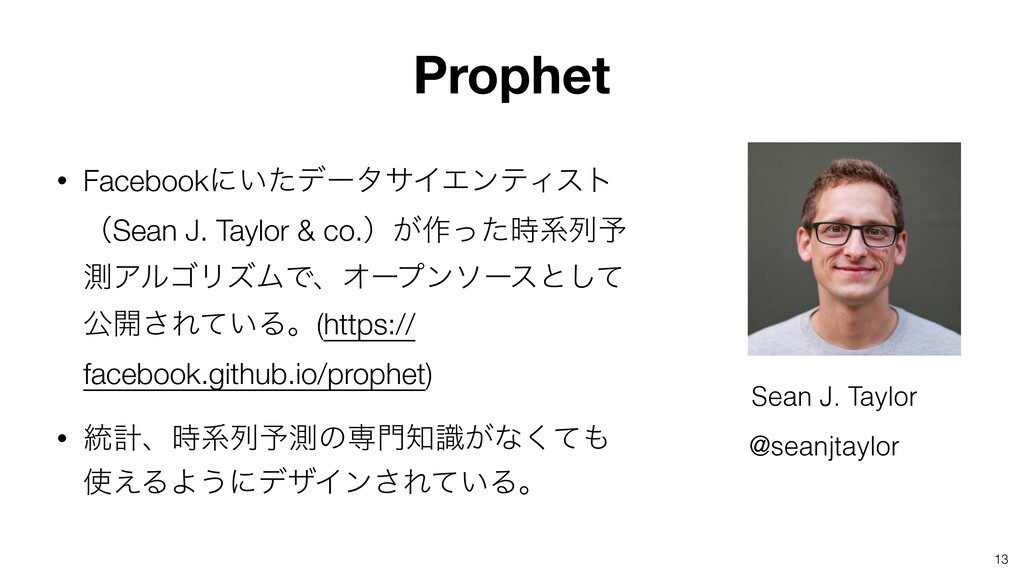
13 • Facebookʹ͍ͨσʔλαΠΤϯςΟετ ʢSean J. Taylor & co.ʣ͕࡞ͬͨ࣌ܥྻ༧ ଌΞϧΰϦζϜͰɺΦʔϓϯιʔεͱͯ͠ ެ։͞Ε͍ͯΔɻ(https://
facebook.github.io/prophet) • ౷ܭɺ࣌ܥྻ༧ଌͷઐ͕ࣝͳͯ͘ ͑ΔΑ͏ʹσβΠϯ͞Ε͍ͯΔɻ Prophet Sean J. Taylor @seanjtaylor
14 • ҎԼͷཁૉͷͱͯ͠ද͢͜ͱͷͰ͖ΔΒ͔ͳۂઢͷ͏ͪɺաڈ σʔλʹ࠷ϑΟοτ͢ΔͷΛ୳͢ɻͦͷۂઢΛະདྷʹԆ͢Δ ͜ͱʹΑͬͯ༧ଌ͢Δɻ • େہతͳτϨϯυ • पظͷقઅੑ (ɺिɺͳͲ)
• ॕޮՌ - ΫϦεϚεɺ৽ɺ࣍ΠϕϯτɺͳͲɻ • ֎෦༧ଌม Prophet
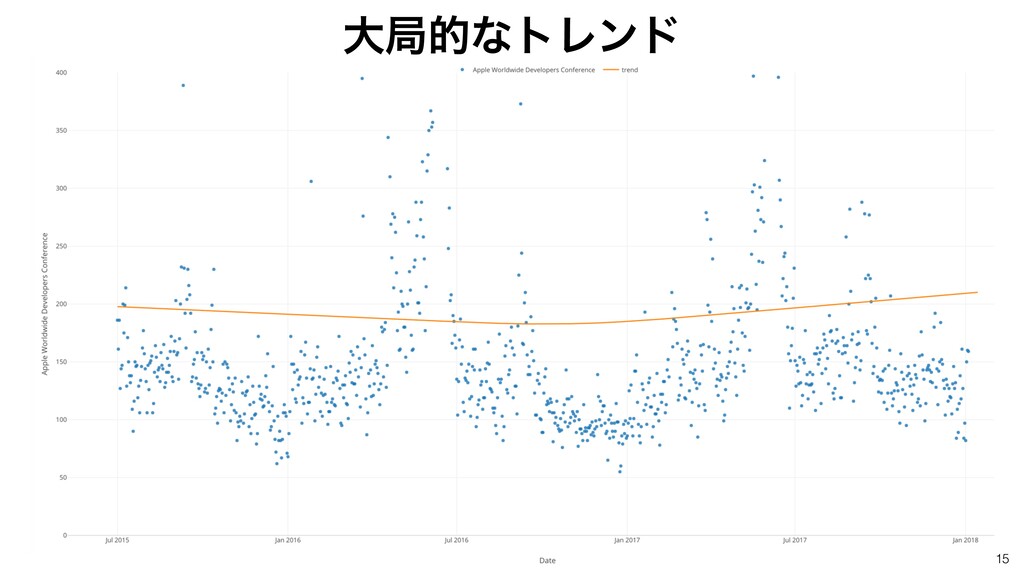
15 େہతͳτϨϯυ
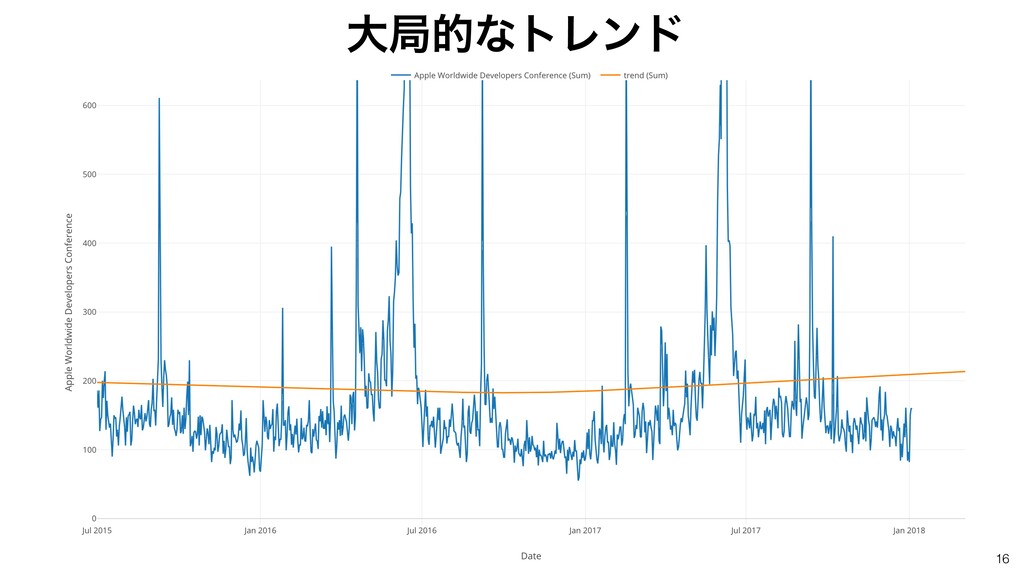
16 େہతͳτϨϯυ
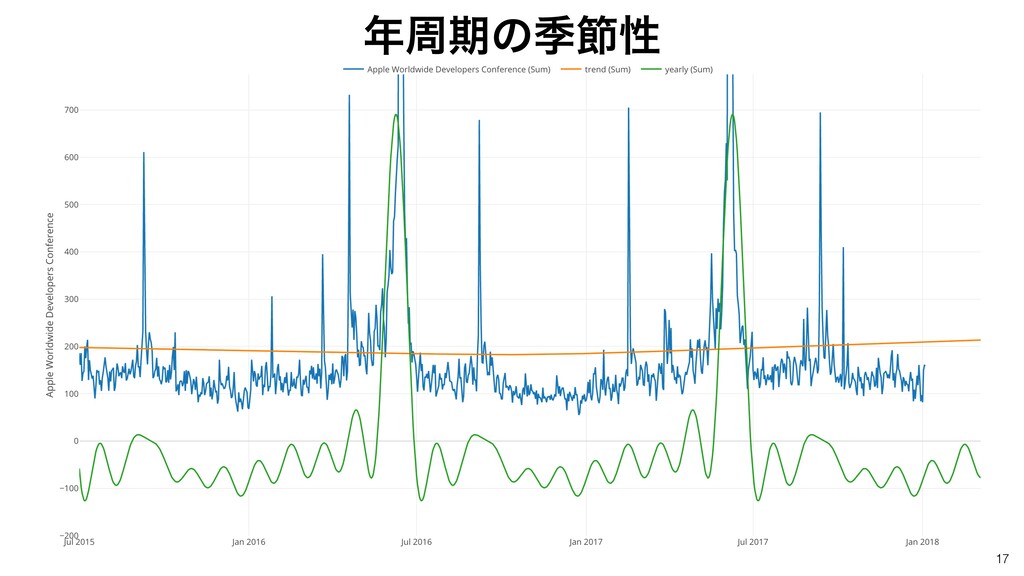
17 पظͷقઅੑ
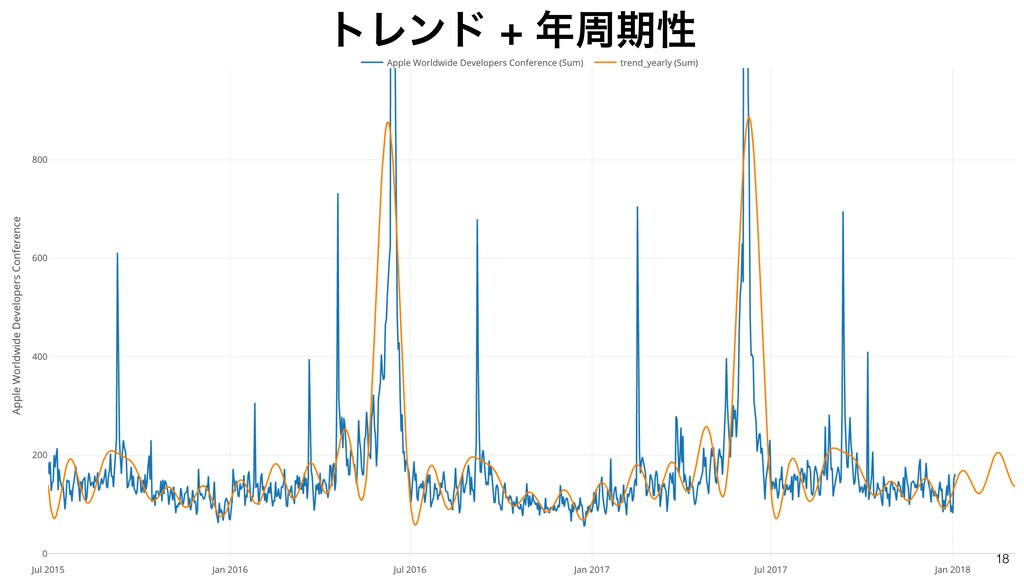
18 τϨϯυ + पظੑ
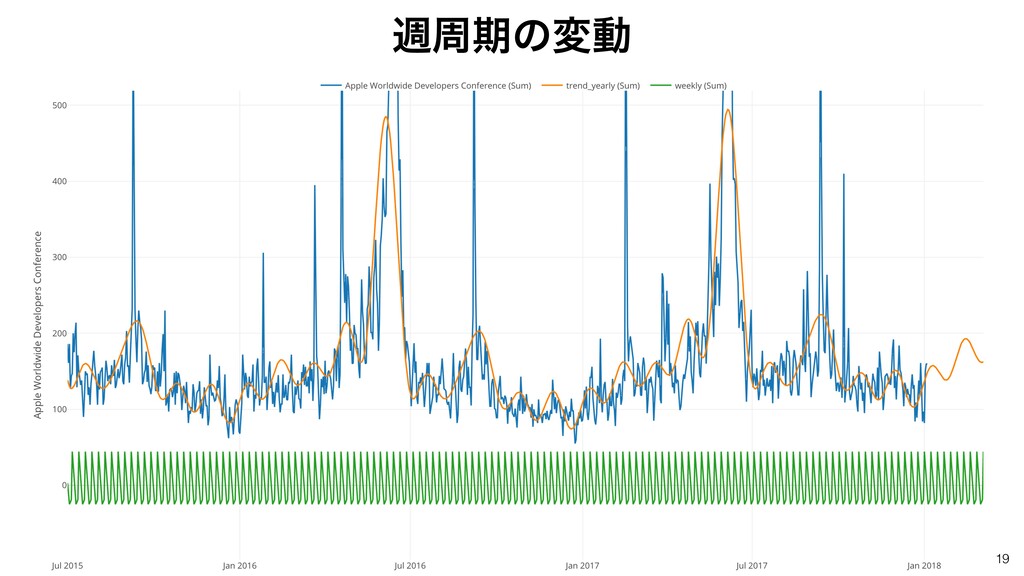
19 िपظͷมಈ
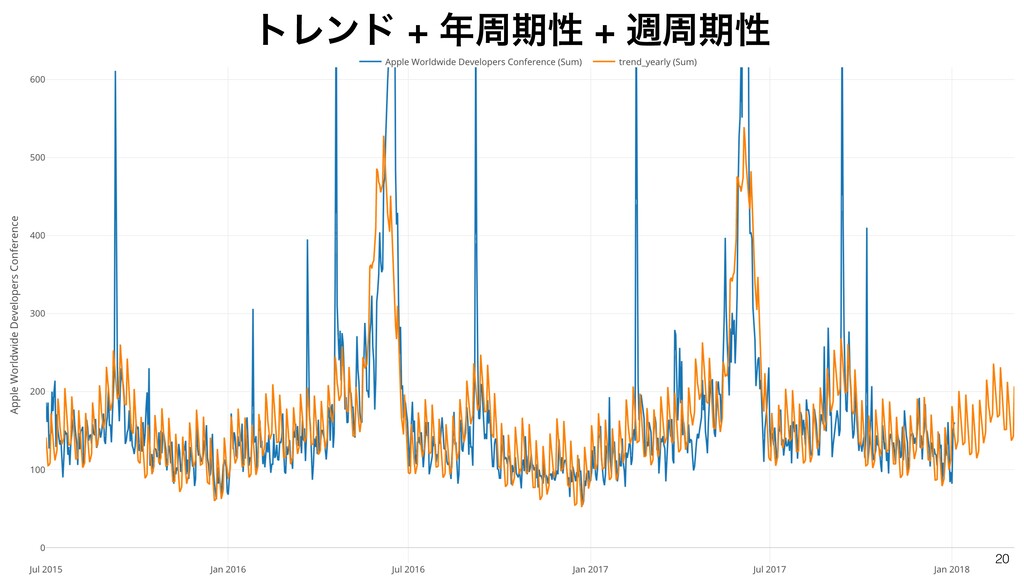
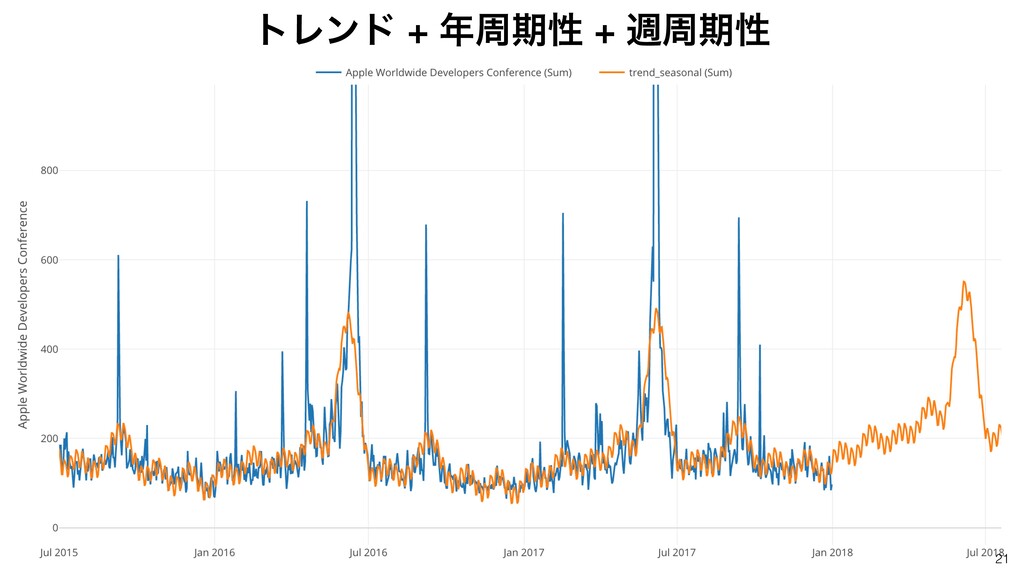
20 τϨϯυ + पظੑ + िपظੑ
21 τϨϯυ + पظੑ + िपظੑ 21
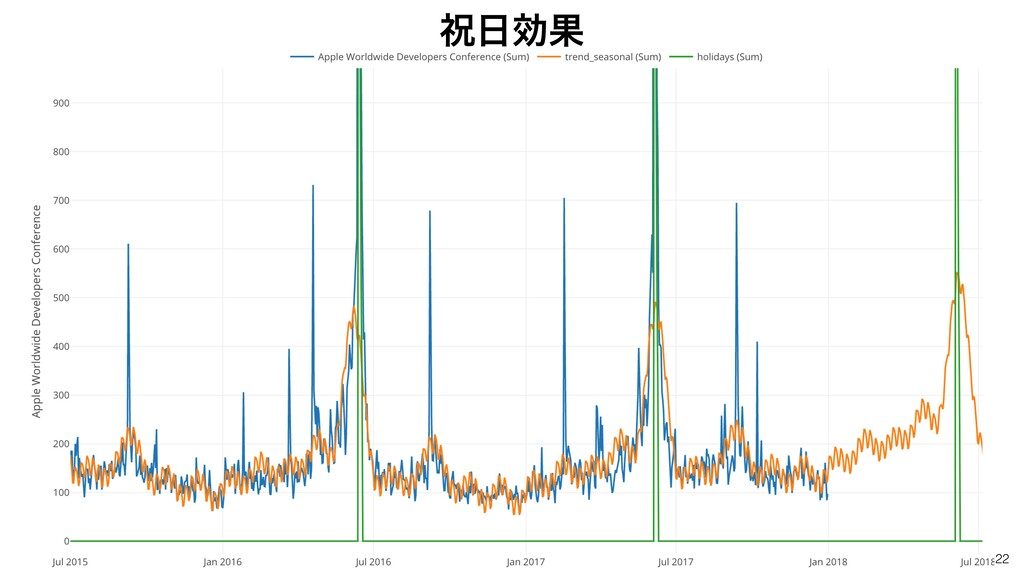
22 ॕޮՌ
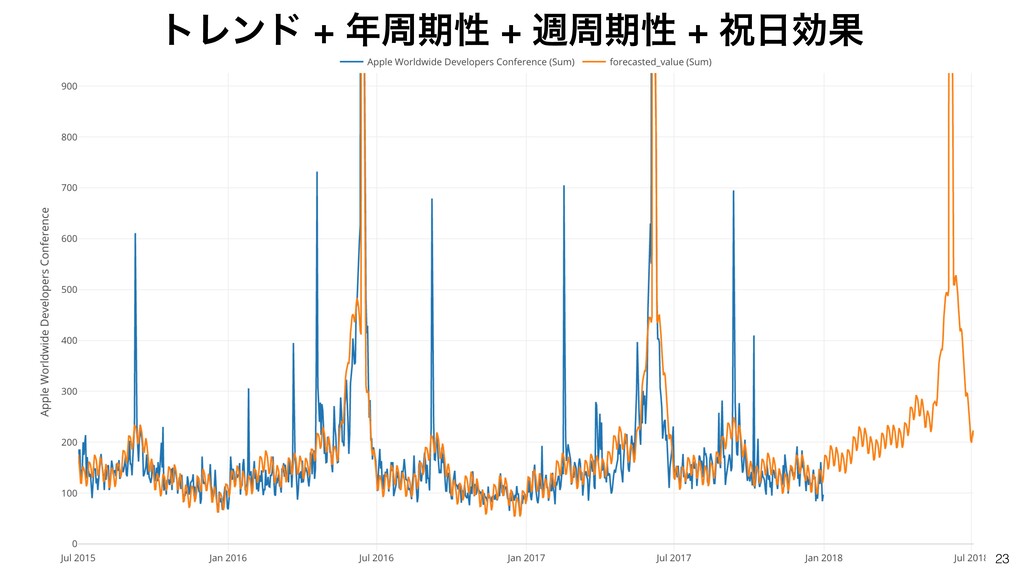
23 τϨϯυ + पظੑ + िपظੑ + ॕޮՌ
24 • ࣌ؒͷൃలΛϞσϧͰදݱ͢Δ͜ͱ͖͋ΒΊΔɻ • ͔ΘΓʹɺ୯ʹۂઢΛݟ͚ͭΔͱ͍͏ʹ͢Δ͜ͱʹΑͬͯҎԼͷΑ͏ͳ རΛಘ͍ͯΔɻ • σʔλؒͷִ͕࣌ؒؒҰఆͰ͋Δඞཁͳ͍ɻ • ͕NA
(ܽଛ)ͱͳΔ͕͋ͬͯͳ͍ɻ • ෳͷपظੑ (िͱ) ͕σϑΥϧτͰߟྀ͞ΕΔɻ • σϑΥϧτͷઃఆͰͦΕͳΓͷ༧ଌ͕Ͱ͖ΔɻઃఆՄೳͳύϥϝʔλͷଟ ͘ઐࣝແ͠ͰཧղՄೳɻ Prophetͷར
Let’s do it! 25
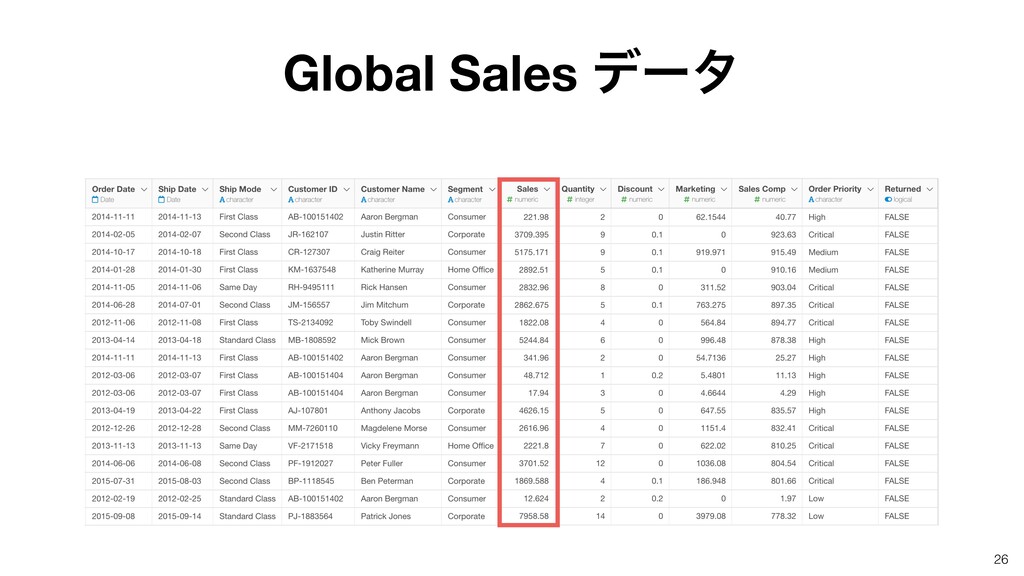
Global Sales σʔλ 26
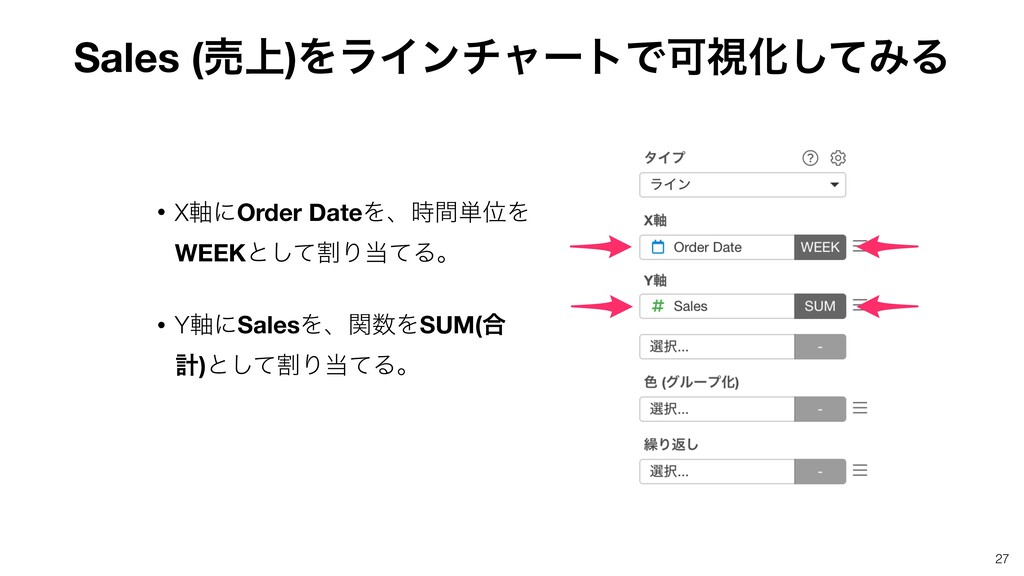
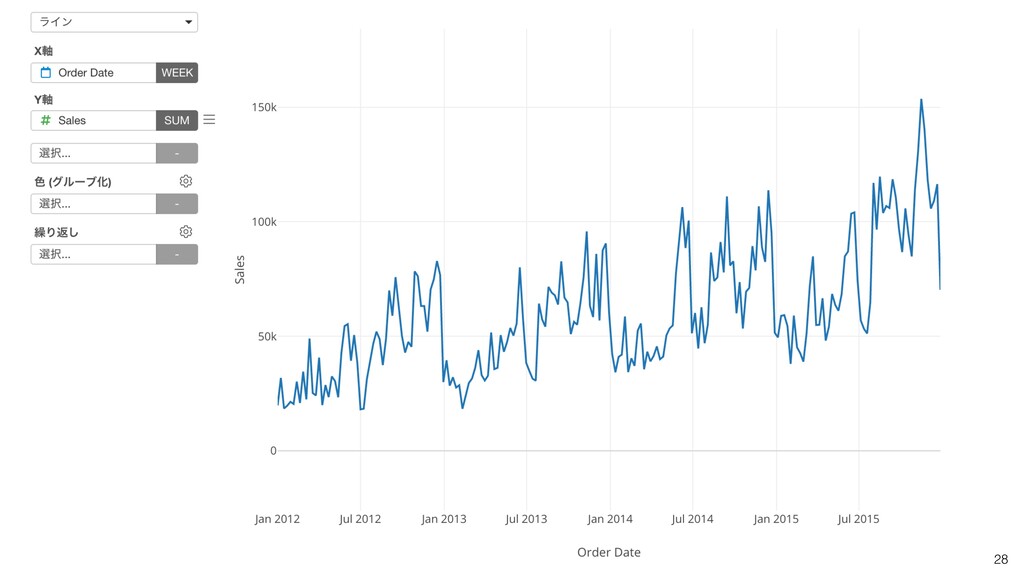
27 Sales (ച্)ΛϥΠϯνϟʔτͰՄࢹԽͯ͠ΈΔ • X࣠ʹOrder DateΛɺ࣌ؒ୯ҐΛ WEEKͱׂͯ͠ΓͯΔɻ • Y࣠ʹSalesΛɺؔΛSUM(߹ ܭ)ͱׂͯ͠ΓͯΔɻ
28
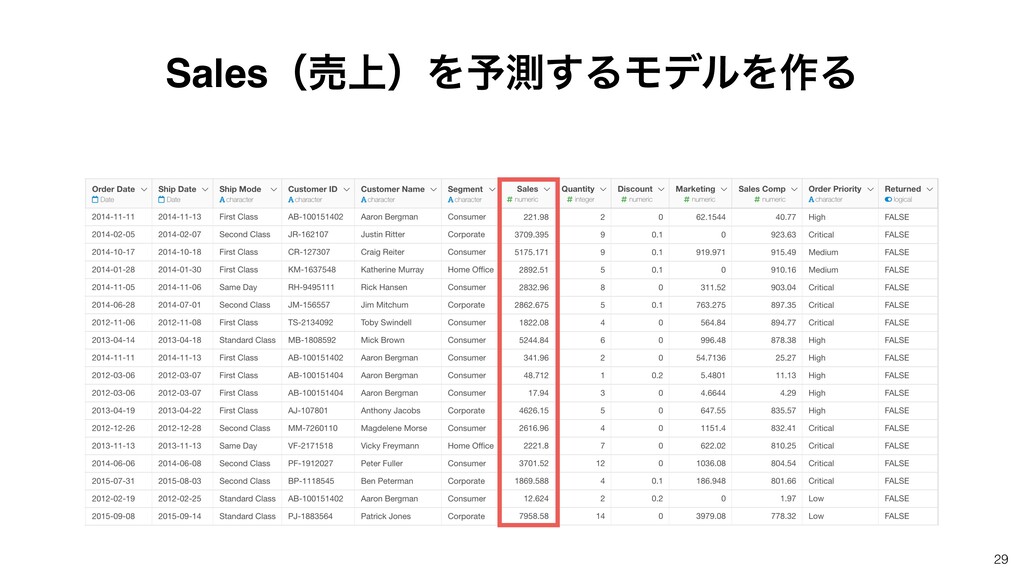
Salesʢച্ʣΛ༧ଌ͢ΔϞσϧΛ࡞Δ 29
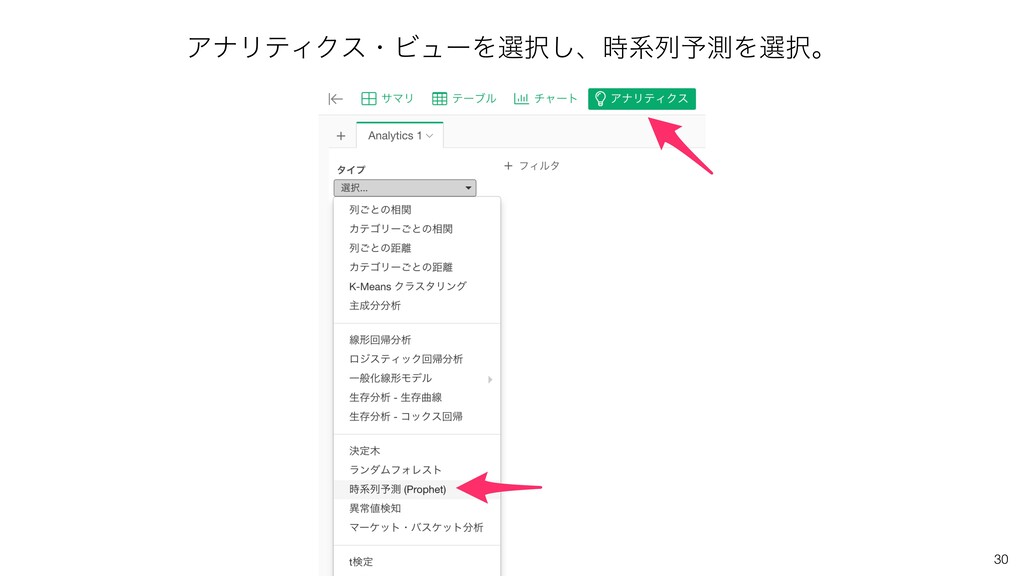
ΞφϦςΟΫεɾϏϡʔΛબ͠ɺ࣌ܥྻ༧ଌΛબɻ 30
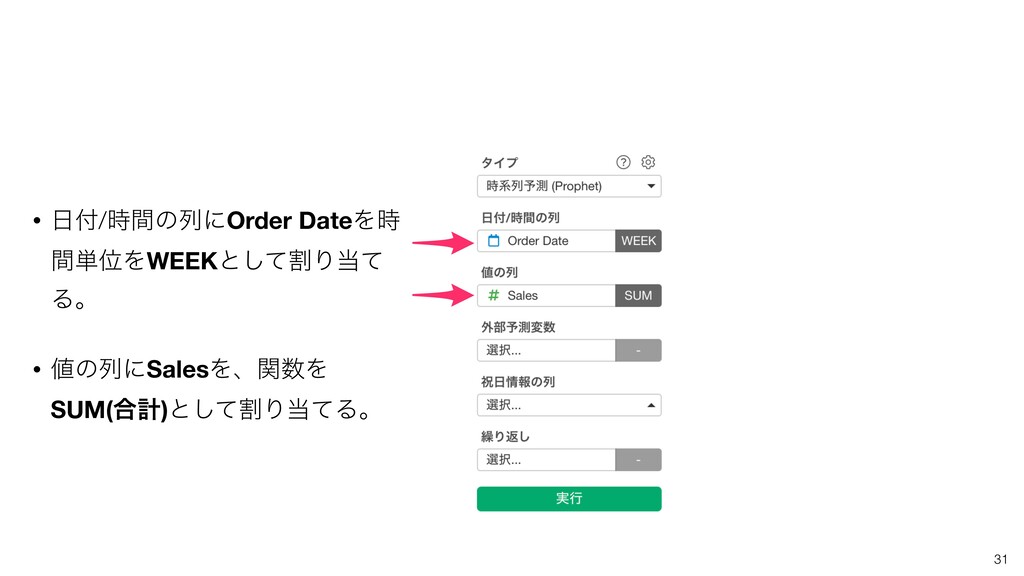
• /࣌ؒͷྻʹOrder DateΛ࣌ ؒ୯ҐΛWEEKͱׂͯ͠Γͯ Δɻ • ͷྻʹSalesΛɺؔΛ SUM(߹ܭ)ͱׂͯ͠ΓͯΔɻ 31
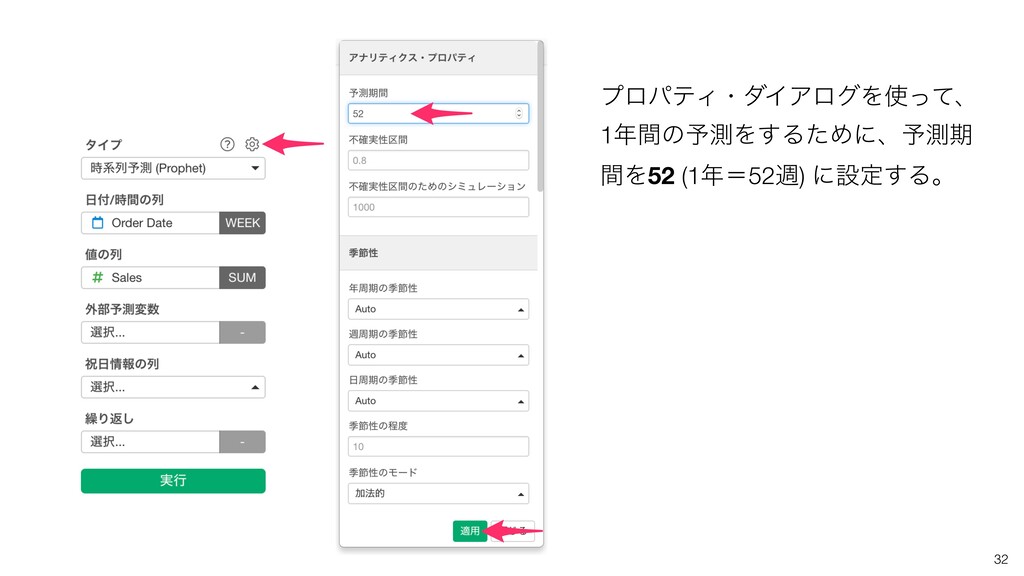
ϓϩύςΟɾμΠΞϩάΛͬͯɺ 1ؒͷ༧ଌΛ͢ΔͨΊʹɺ༧ଌظ ؒΛ52 (1ʹ52ि) ʹઃఆ͢Δɻ 32
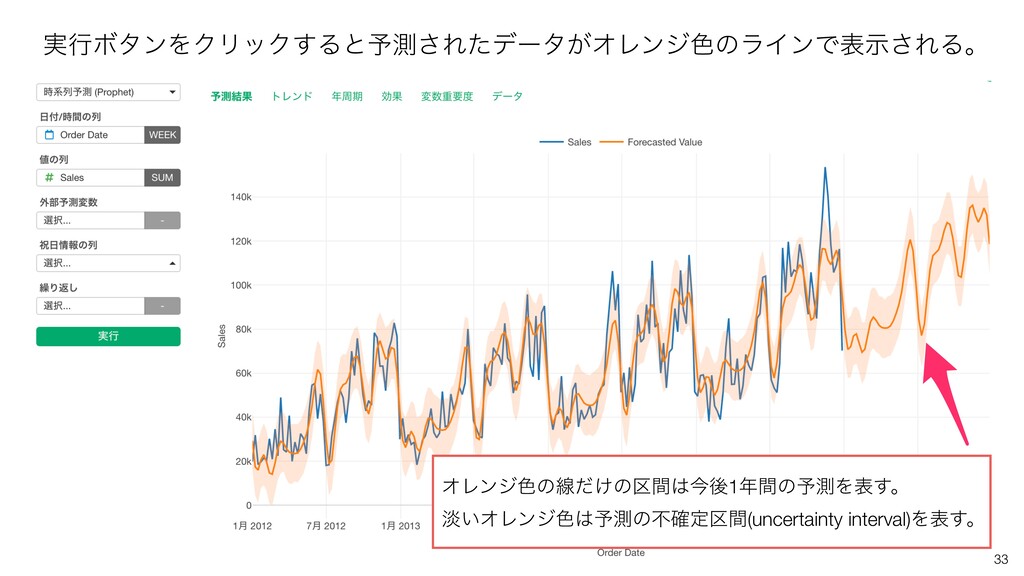
࣮ߦϘλϯΛΫϦοΫ͢Δͱ༧ଌ͞Εͨσʔλ͕ΦϨϯδ৭ͷϥΠϯͰදࣔ͞ΕΔɻ 33 ΦϨϯδ৭ͷઢ͚ͩͷ۠ؒࠓޙ1ؒͷ༧ଌΛද͢ɻ ୶͍ΦϨϯδ৭༧ଌͷෆ֬ఆ۠ؒ(uncertainty interval)Λද͢ɻ
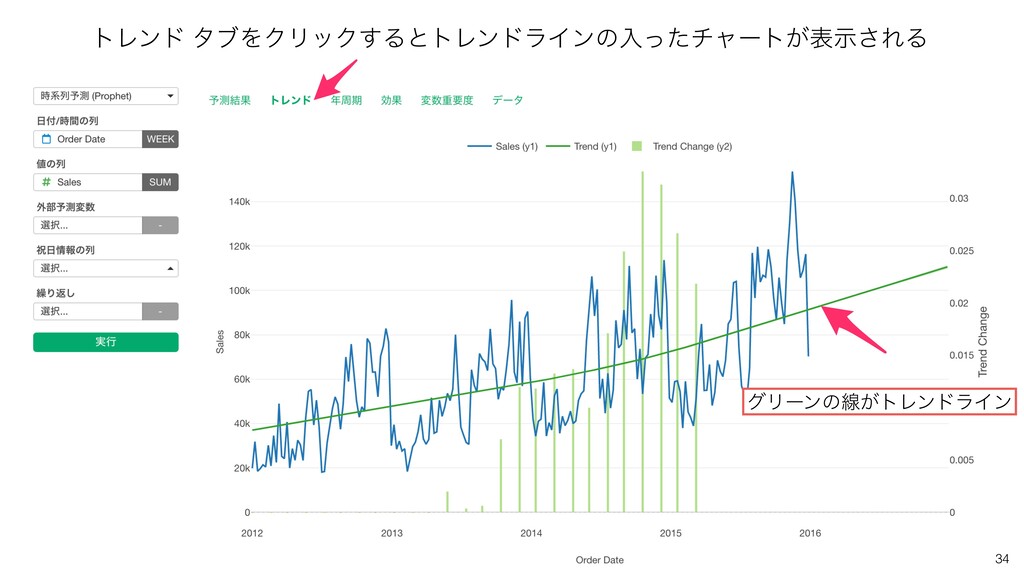
34 τϨϯυ λϒΛΫϦοΫ͢ΔͱτϨϯυϥΠϯͷೖͬͨνϟʔτ͕දࣔ͞ΕΔ άϦʔϯͷઢ͕τϨϯυϥΠϯ
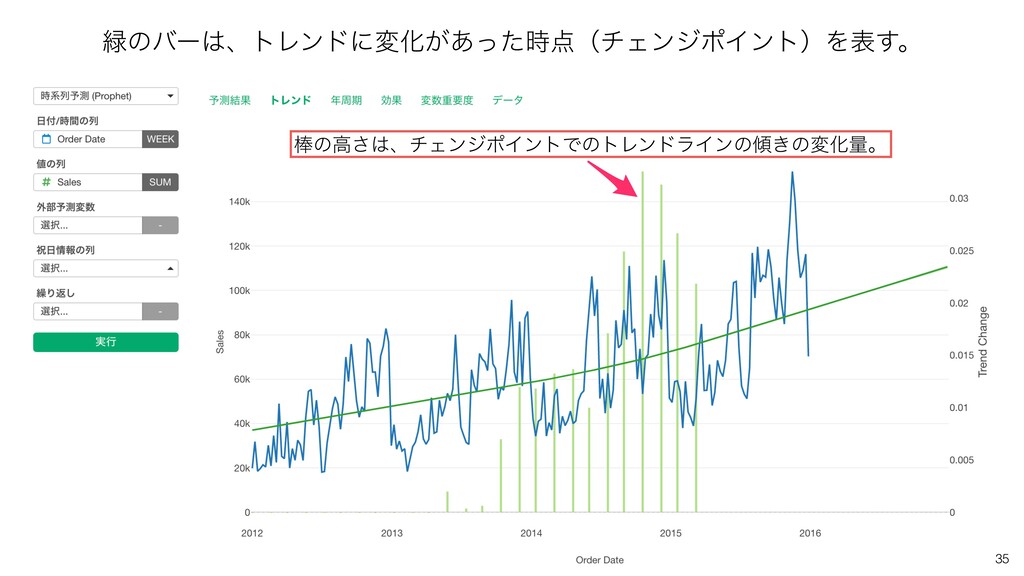
35 ͷόʔɺτϨϯυʹมԽ͕͋ͬͨ࣌ʢνΣϯδϙΠϯτʣΛද͢ɻ ͷߴ͞ɺνΣϯδϙΠϯτͰͷτϨϯυϥΠϯͷ͖ͷมԽྔɻ
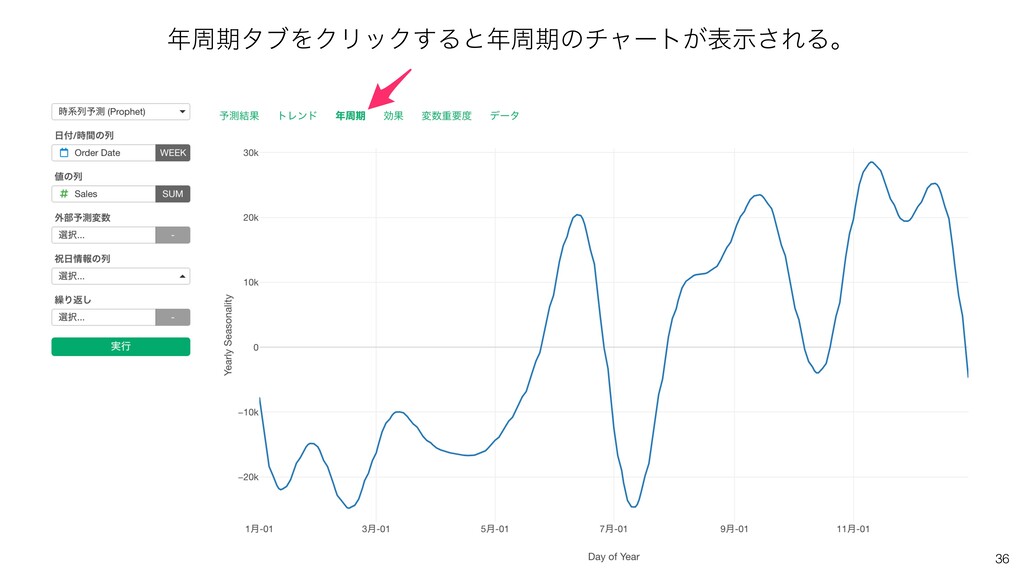
36 पظλϒΛΫϦοΫ͢Δͱपظͷνϟʔτ͕දࣔ͞ΕΔɻ
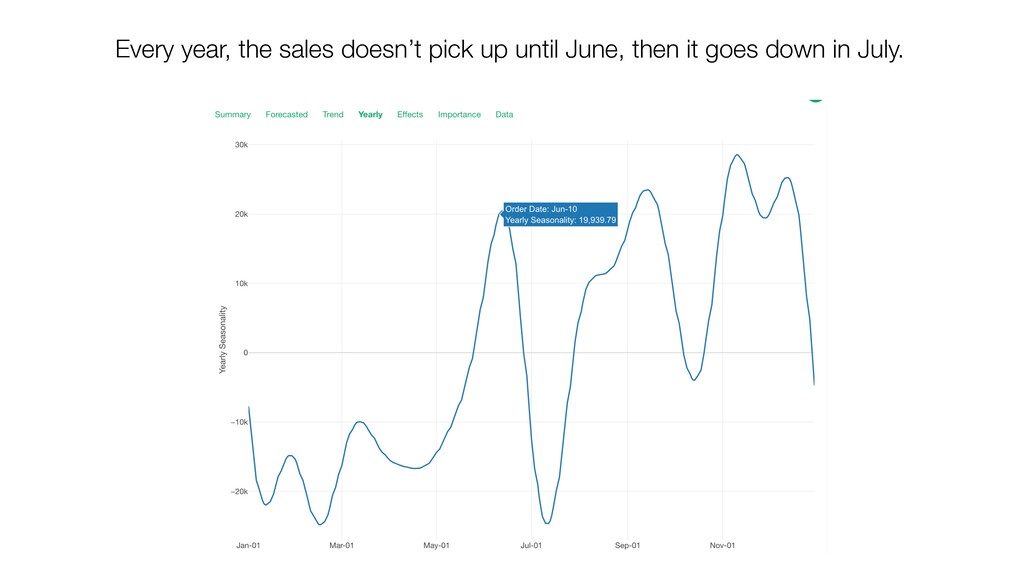
Every year, the sales doesn’t pick up until June, then
it goes down in July.
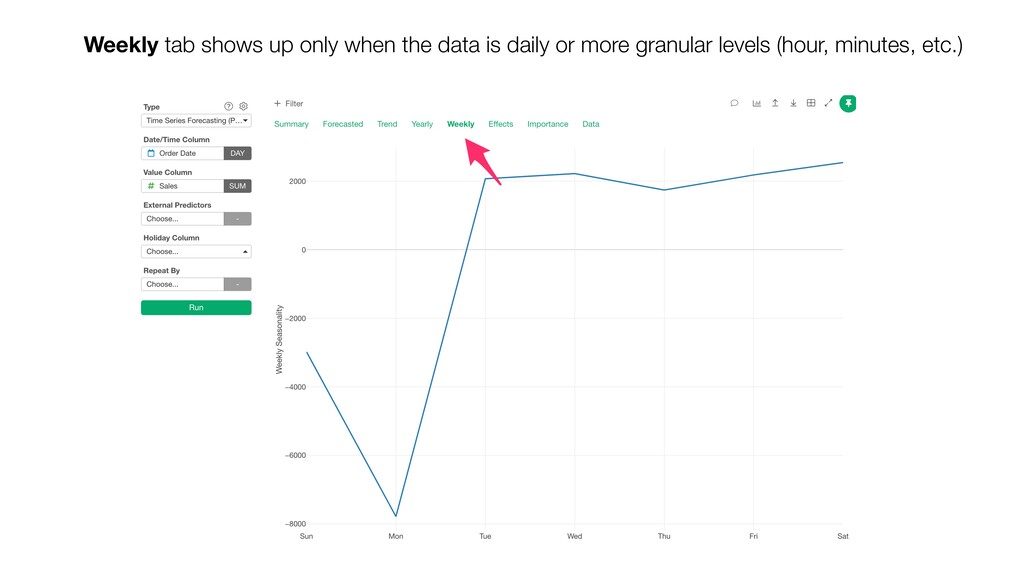
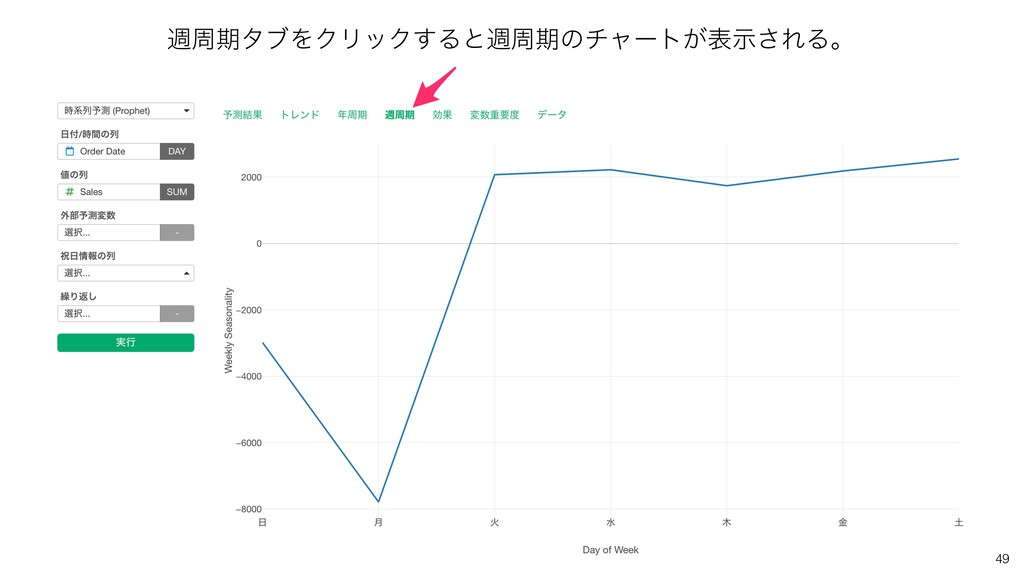
Weekly tab shows up only when the data is daily
or more granular levels (hour, minutes, etc.)
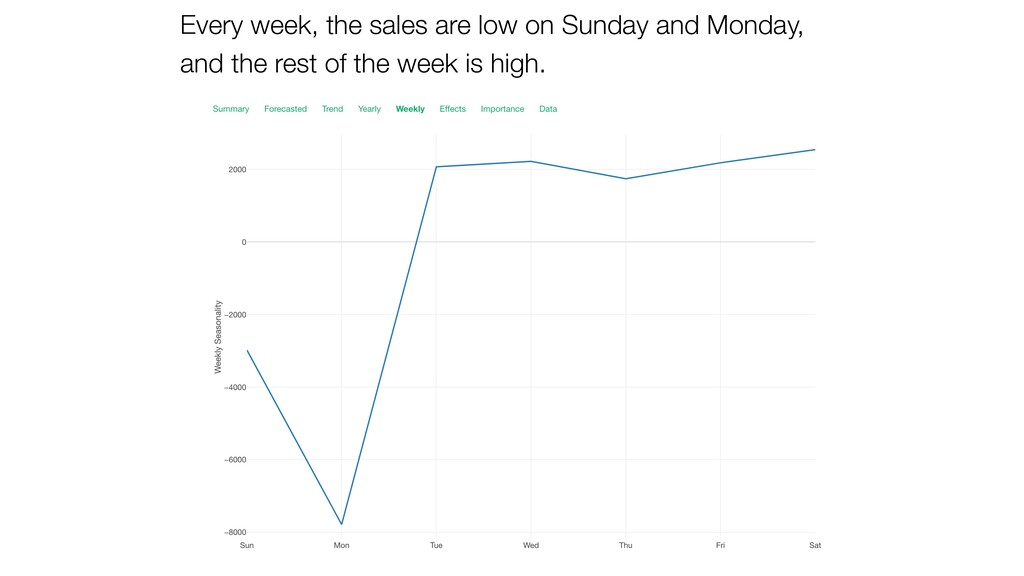
Every week, the sales are low on Sunday and Monday,
and the rest of the week is high.
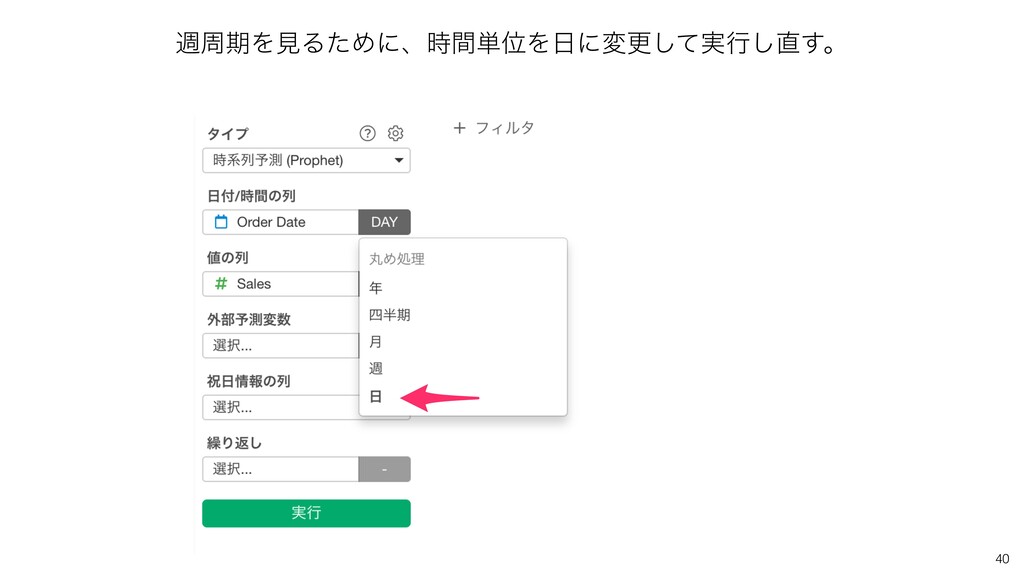
40 िपظΛݟΔͨΊʹɺ࣌ؒ୯ҐΛʹมߋ࣮ͯ͠ߦ͢͠ɻ
σʔλͷલॲཧ ܽଛʢNAʣͷॲཧ
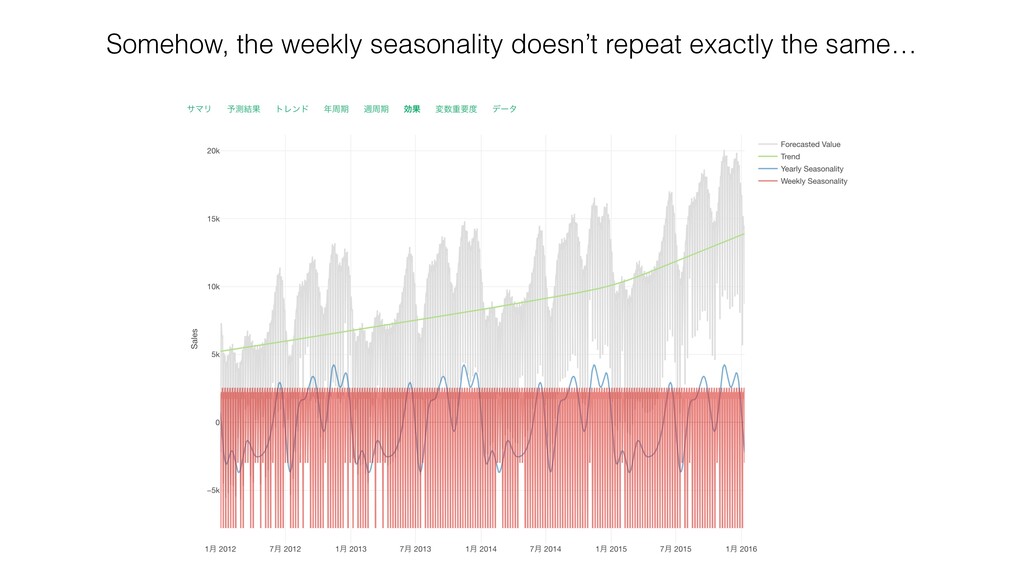
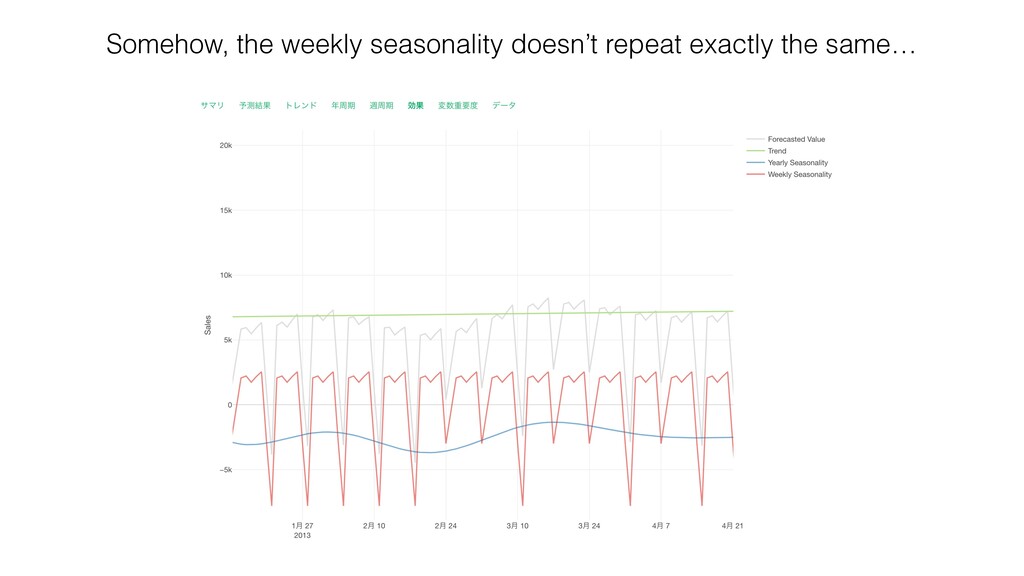
Somehow, the weekly seasonality doesn’t repeat exactly the same…
Somehow, the weekly seasonality doesn’t repeat exactly the same…
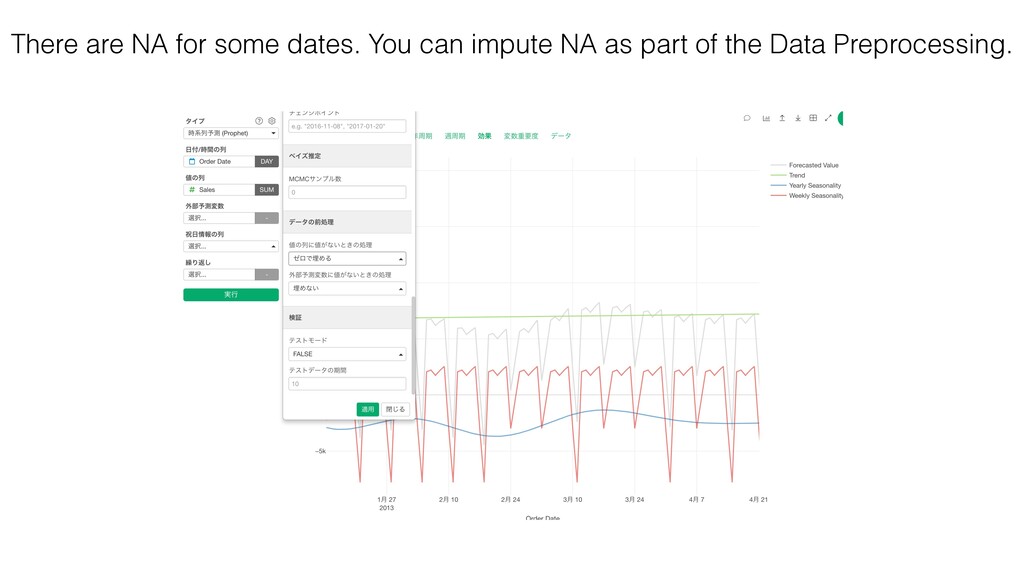
There are NA for some dates. You can impute NA
as part of the Data Preprocessing.
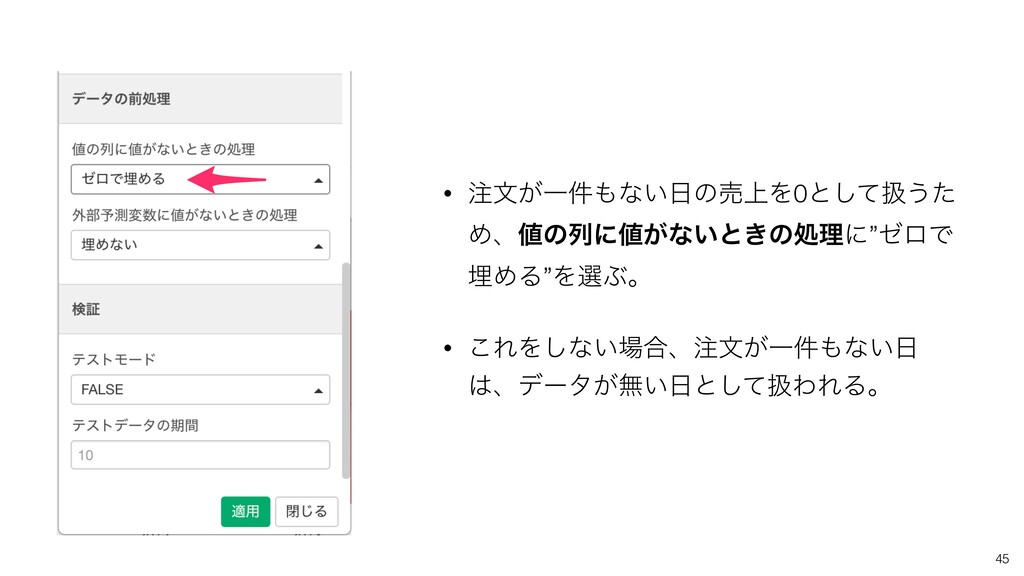
45 • จ͕Ұ݅ͳ͍ͷച্Λ0ͱͯ͠ѻ͏ͨ Ίɺͷྻʹ͕ͳ͍ͱ͖ͷॲཧʹ”θϩͰ ຒΊΔ”ΛબͿɻ • ͜ΕΛ͠ͳ͍߹ɺจ͕Ұ݅ͳ͍ ɺσʔλ͕ແ͍ͱͯ͠ѻΘΕΔɻ
None
None
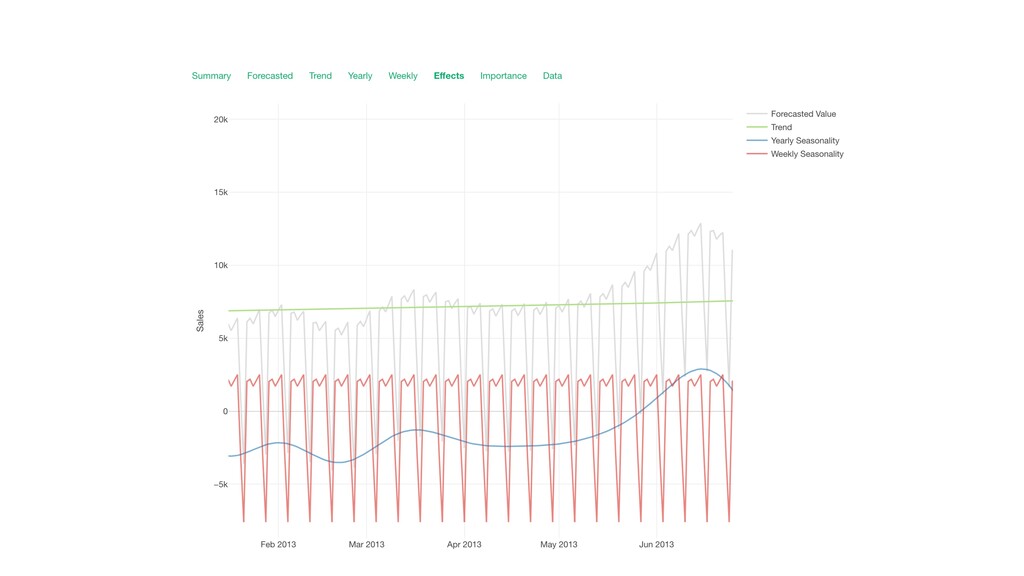
Under the Importance tab, you can see which seasonality has
more effect on the forecasting outcome.
49 िपظλϒΛΫϦοΫ͢Δͱिपظͷνϟʔτ͕දࣔ͞ΕΔɻ
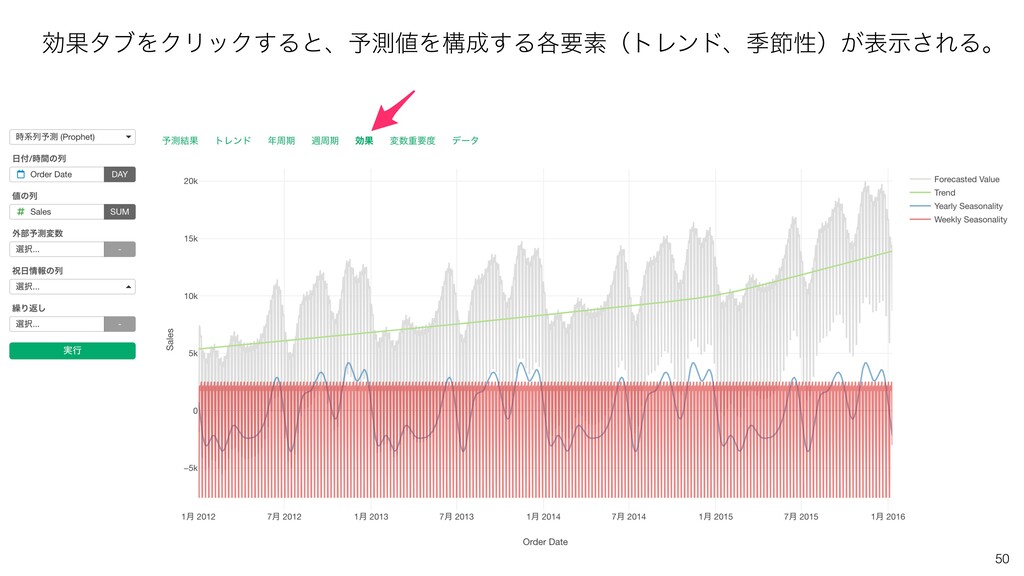
50 ޮՌλϒΛΫϦοΫ͢Δͱɺ༧ଌΛߏ͢Δ֤ཁૉʢτϨϯυɺقઅੑʣ͕දࣔ͞ΕΔɻ
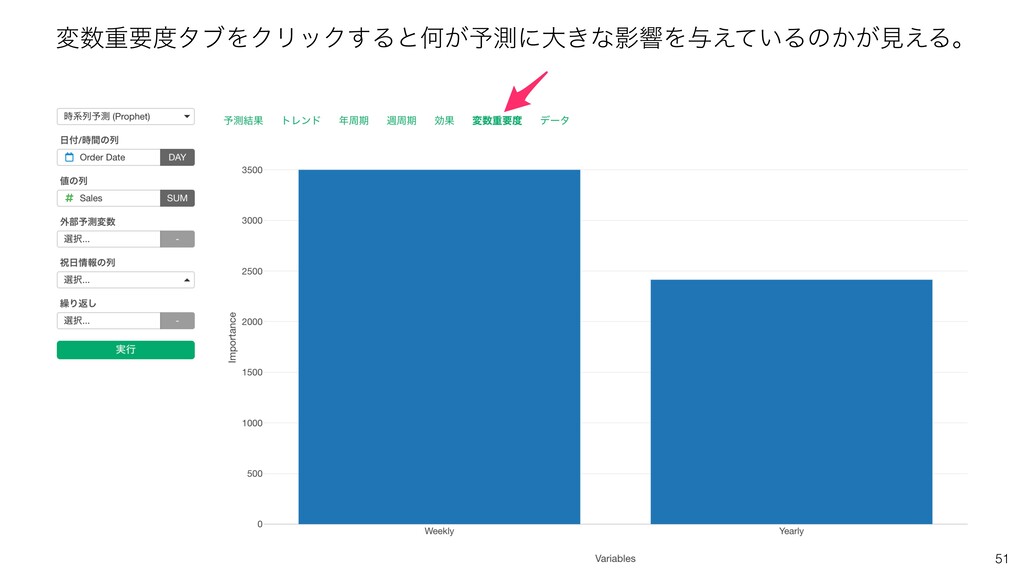
51 มॏཁλϒΛΫϦοΫ͢ΔͱԿ͕༧ଌʹେ͖ͳӨڹΛ༩͍͑ͯΔͷ͔͕ݟ͑Δɻ
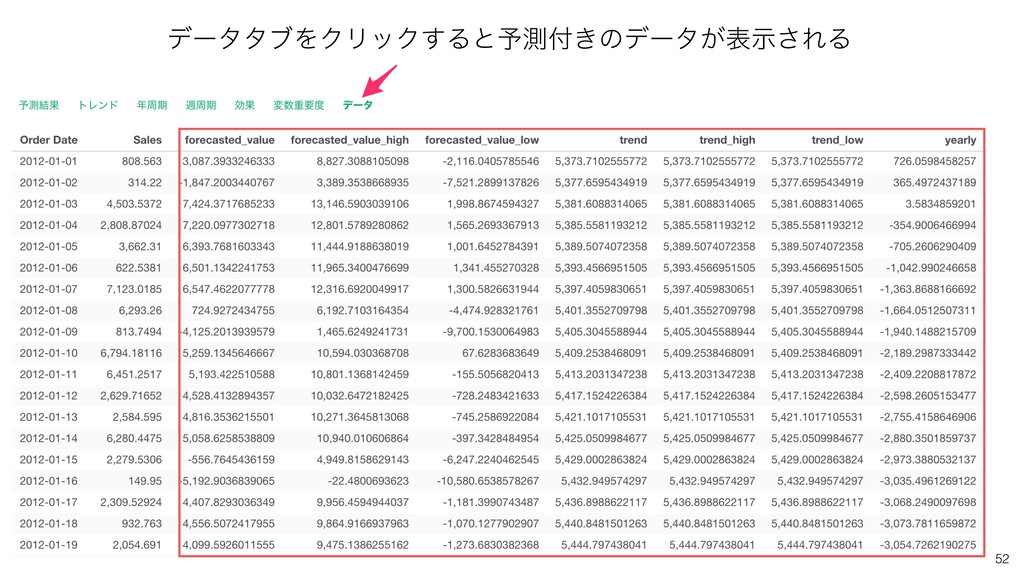
52 σʔλλϒΛΫϦοΫ͢Δͱ༧ଌ͖ͷσʔλ͕දࣔ͞ΕΔ
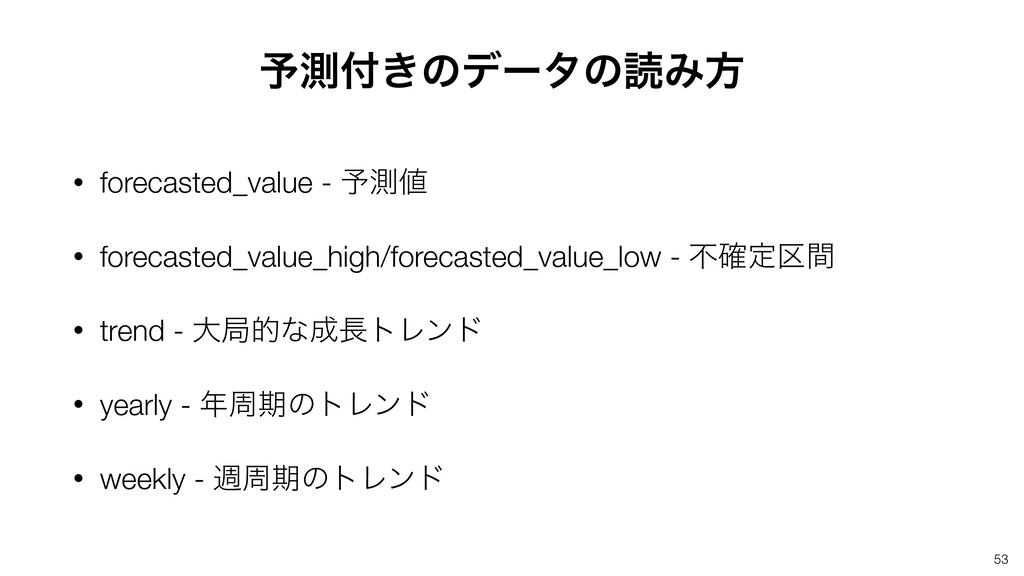
• forecasted_value - ༧ଌ • forecasted_value_high/forecasted_value_low - ෆ֬ఆ۠ؒ • trend
- େہతͳτϨϯυ • yearly - पظͷτϨϯυ • weekly - िपظͷτϨϯυ 53 ༧ଌ͖ͷσʔλͷಡΈํ
54 ࣌ܥྻ༧ଌͷධՁ
55 όοΫςετ • աڈσʔλͷ͏ͪɺ৽͍͠ظؒΛςετ༻ʹͱ͓ͬͯ͘ɻ • ςετظؒͷσʔλΛɺͦΕΑΓҎલͷσʔλΛͬͯ༧ଌ͢Δ • ༧ଌσʔλͱɺ࣮ࡍͷςετظؒͷσʔλΛൺֱධՁ͢Δɻ ࣌ܥྻ༧ଌͷςετ๏
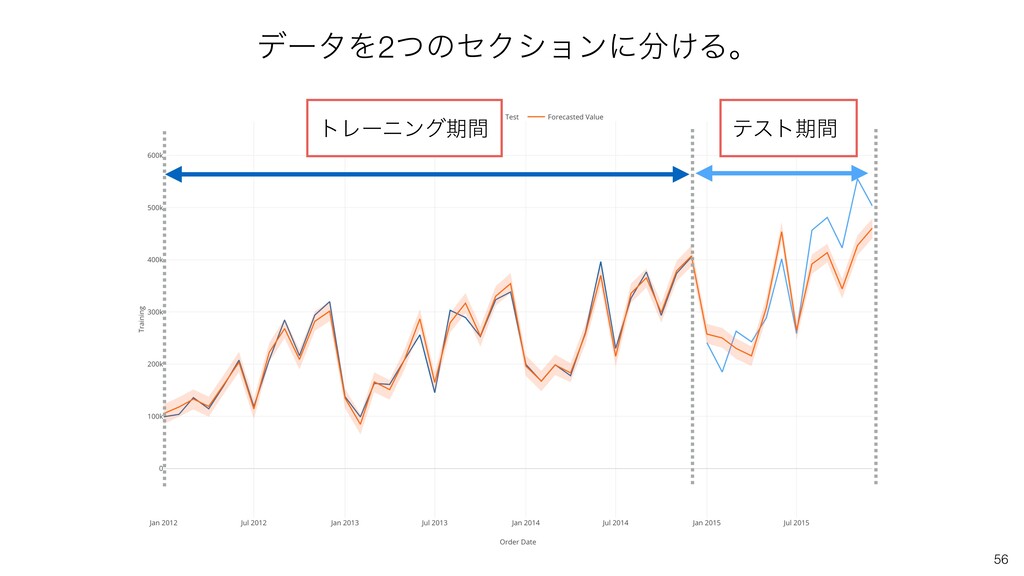
σʔλΛ2ͭͷηΫγϣϯʹ͚Δɻ 56 τϨʔχϯάظؒ ςετظؒ
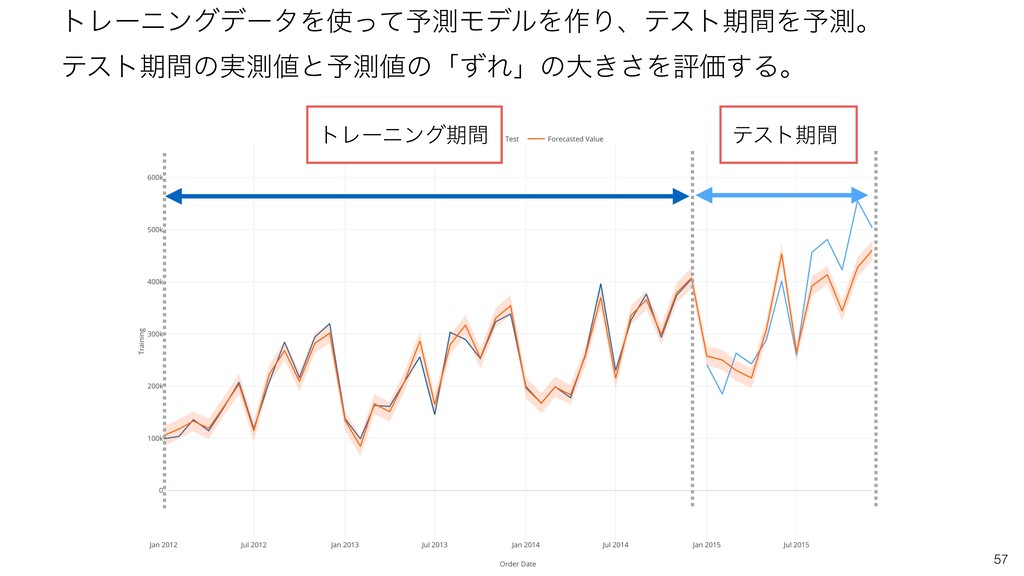
57 τϨʔχϯάσʔλΛͬͯ༧ଌϞσϧΛ࡞ΓɺςετظؒΛ༧ଌɻ ςετظؒͷ࣮ଌͱ༧ଌͷʮͣΕʯͷେ͖͞ΛධՁ͢Δɻ τϨʔχϯάظؒ ςετظؒ
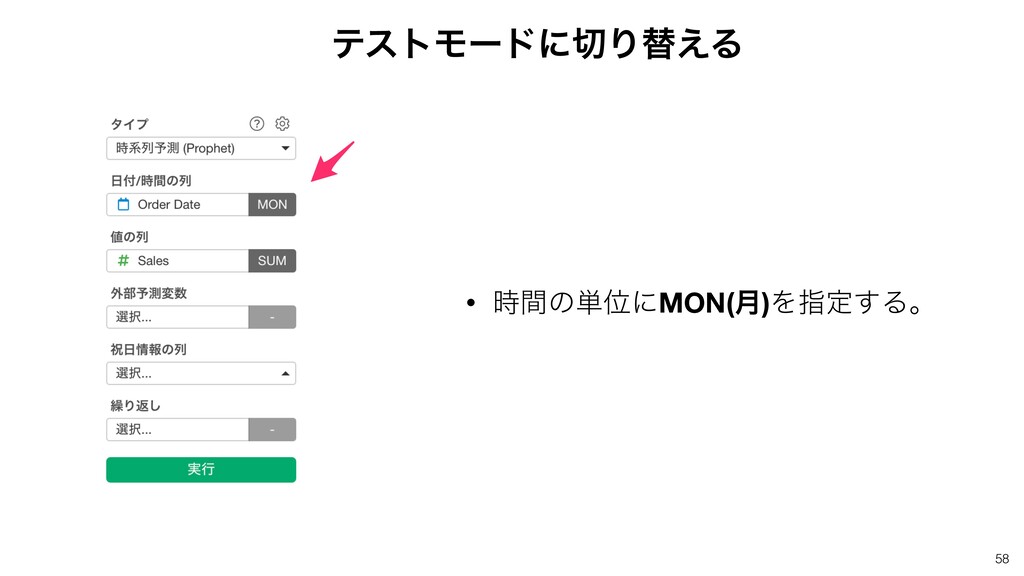
58 • ࣌ؒͷ୯ҐʹMON(݄)Λࢦఆ͢Δɻ ςετϞʔυʹΓସ͑Δ
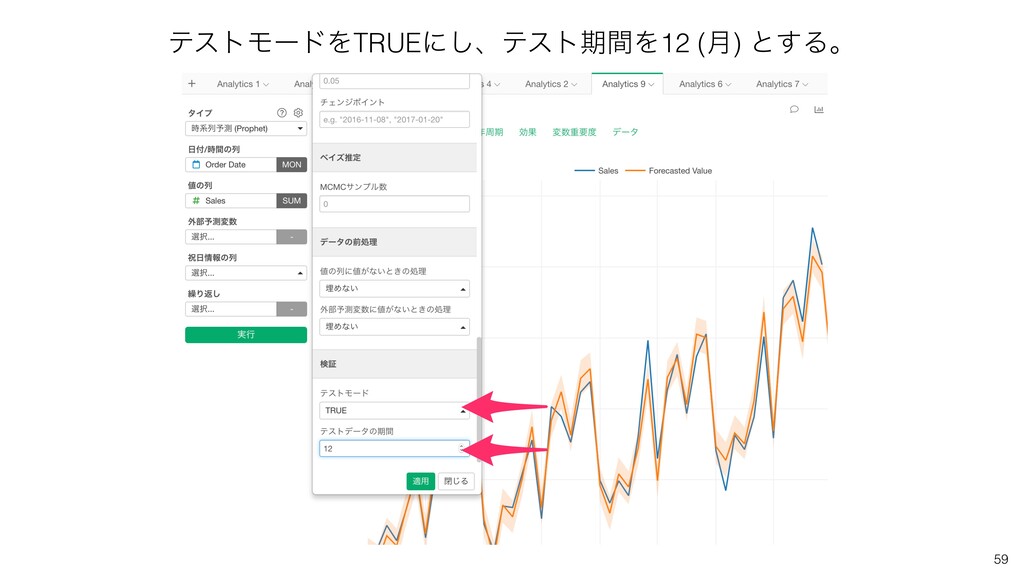
59 ςετϞʔυΛTRUEʹ͠ɺςετظؒΛ12 (݄) ͱ͢Δɻ
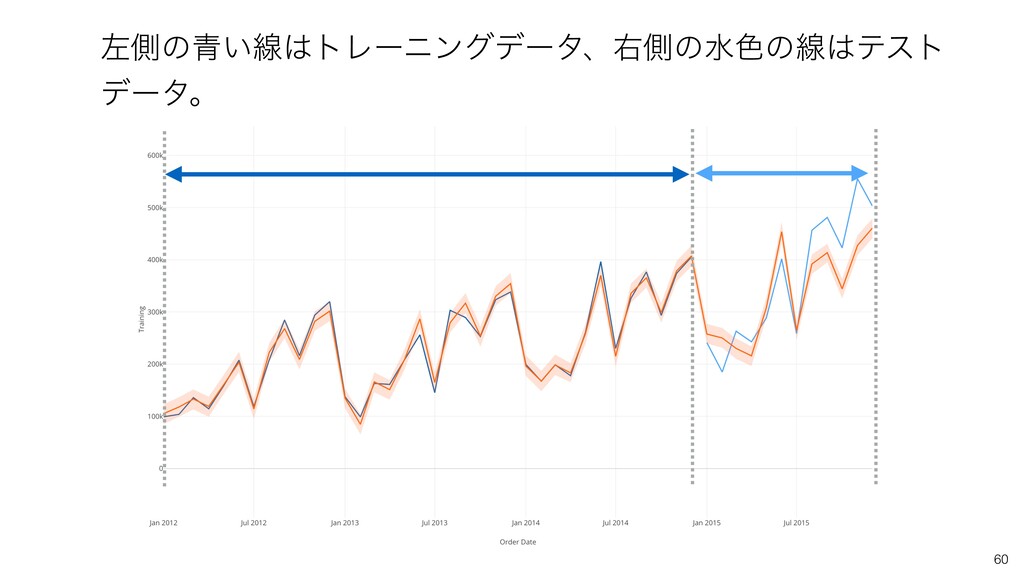
ࠨଆͷ੨͍ઢτϨʔχϯάσʔλɺӈଆͷਫ৭ͷઢςετ σʔλɻ 60
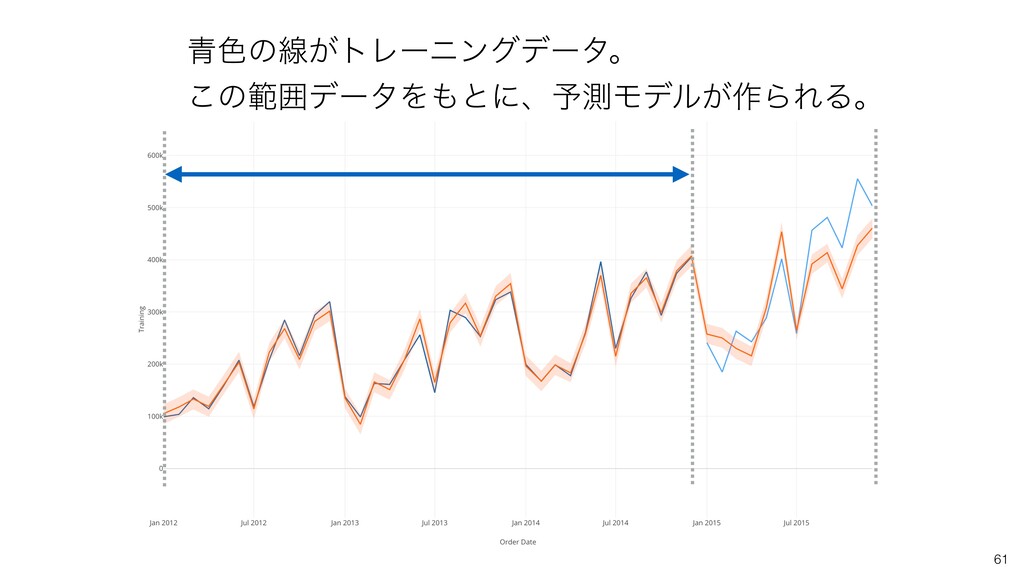
61 ੨৭ͷઢ͕τϨʔχϯάσʔλɻ ͜ͷൣғσʔλΛͱʹɺ༧ଌϞσϧ͕࡞ΒΕΔɻ
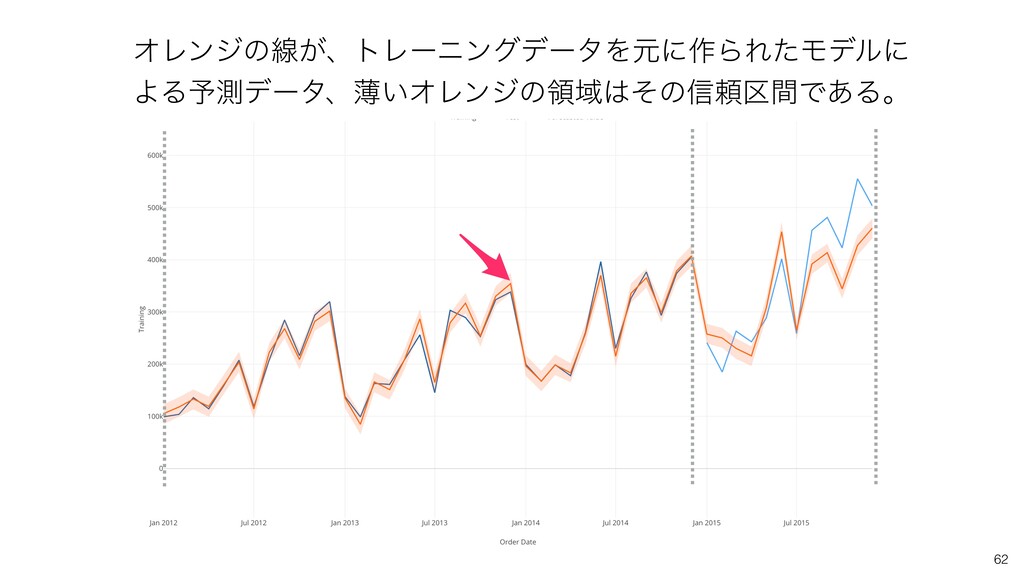
ΦϨϯδͷઢ͕ɺτϨʔχϯάσʔλΛݩʹ࡞ΒΕͨϞσϧʹ ΑΔ༧ଌσʔλɺബ͍ΦϨϯδͷྖҬͦͷ৴པ۠ؒͰ͋Δɻ 62
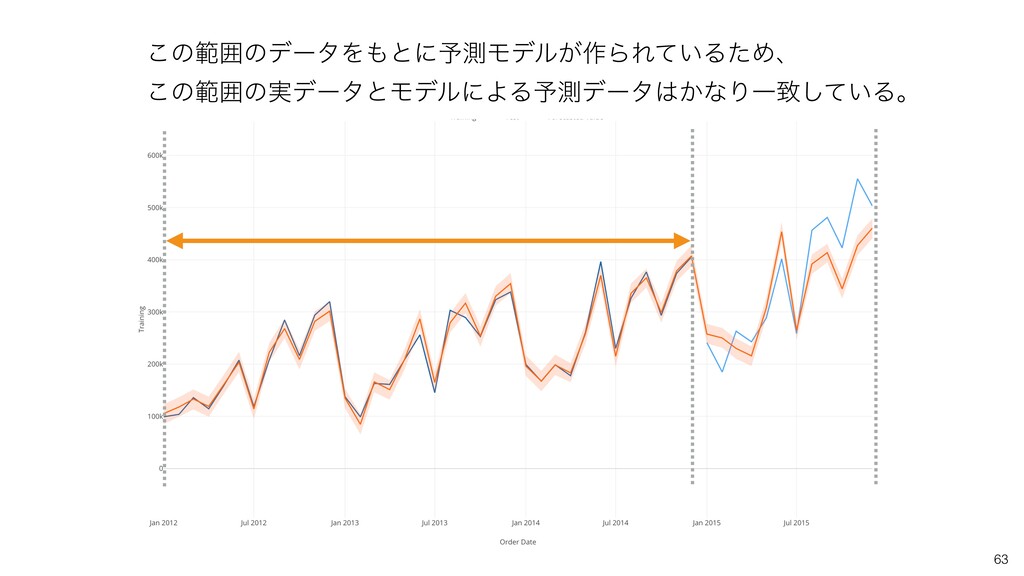
͜ͷൣғͷσʔλΛͱʹ༧ଌϞσϧ͕࡞ΒΕ͍ͯΔͨΊɺ ͜ͷൣғͷ࣮σʔλͱϞσϧʹΑΔ༧ଌσʔλ͔ͳΓҰக͍ͯ͠Δɻ 63
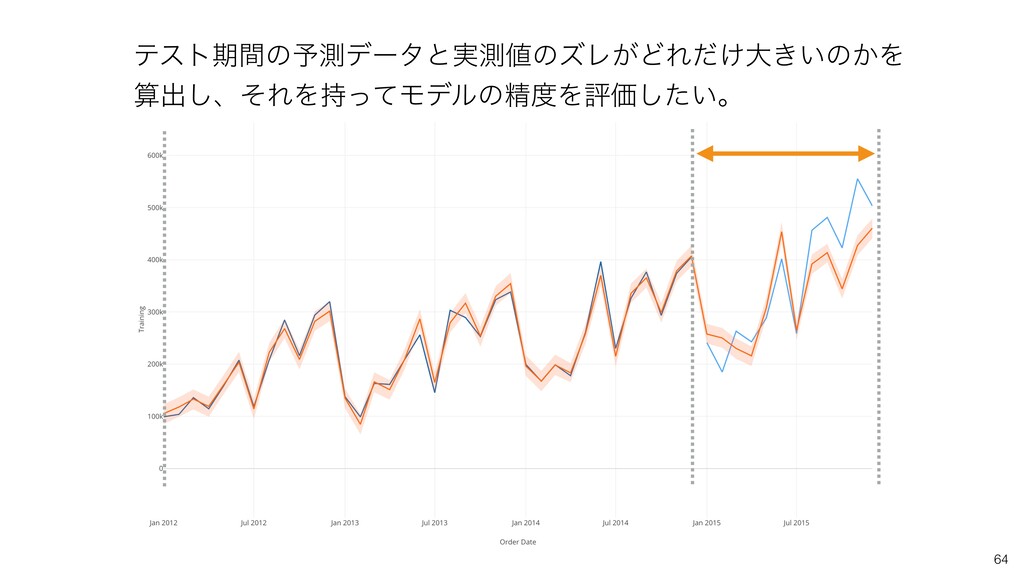
ςετظؒͷ༧ଌσʔλͱ࣮ଌͷζϨ͕ͲΕ͚ͩେ͖͍ͷ͔Λ ࢉग़͠ɺͦΕΛ࣋ͬͯϞσϧͷਫ਼ΛධՁ͍ͨ͠ɻ 64
ςετ݁ՌͷαϚϦ 65
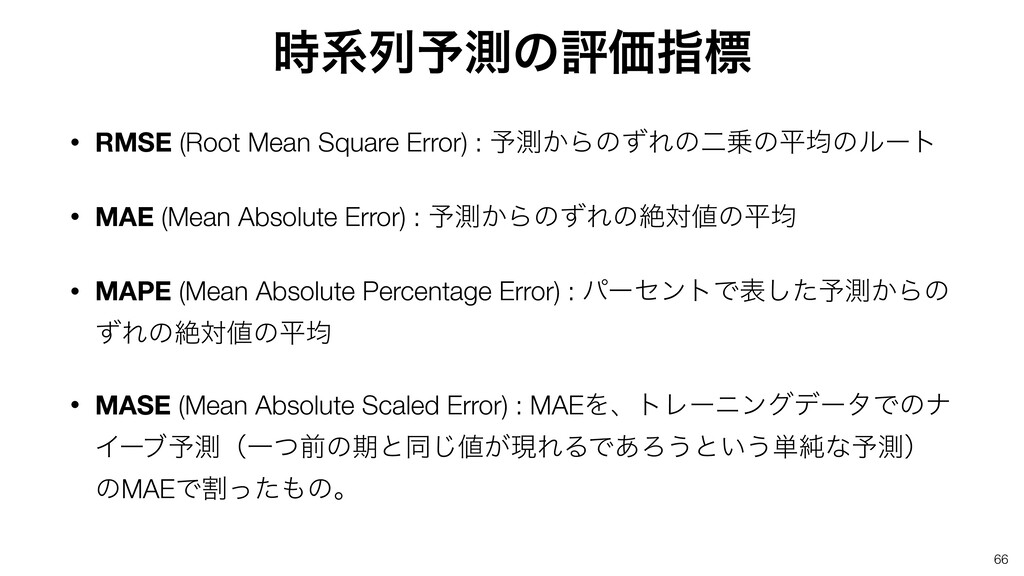
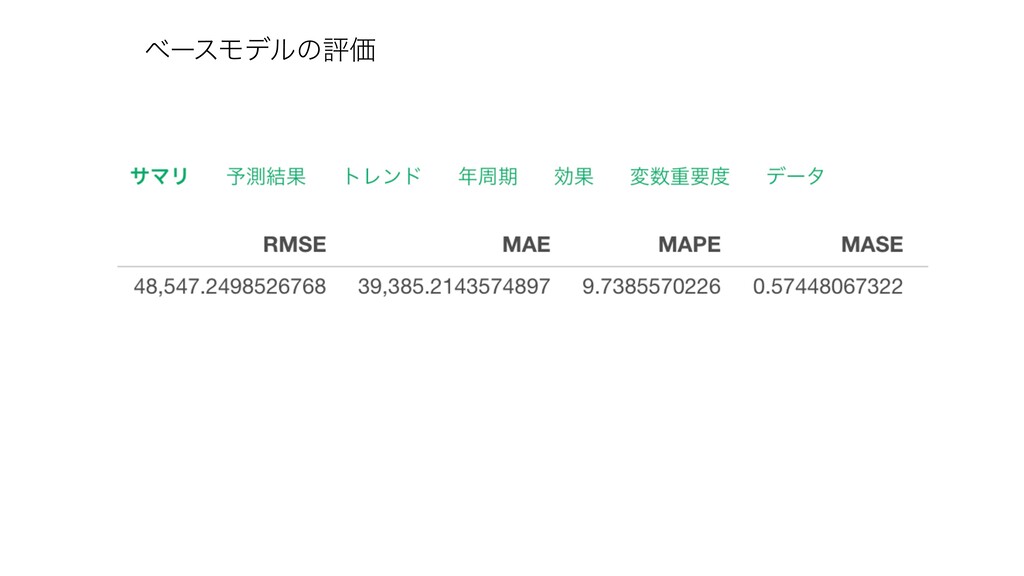
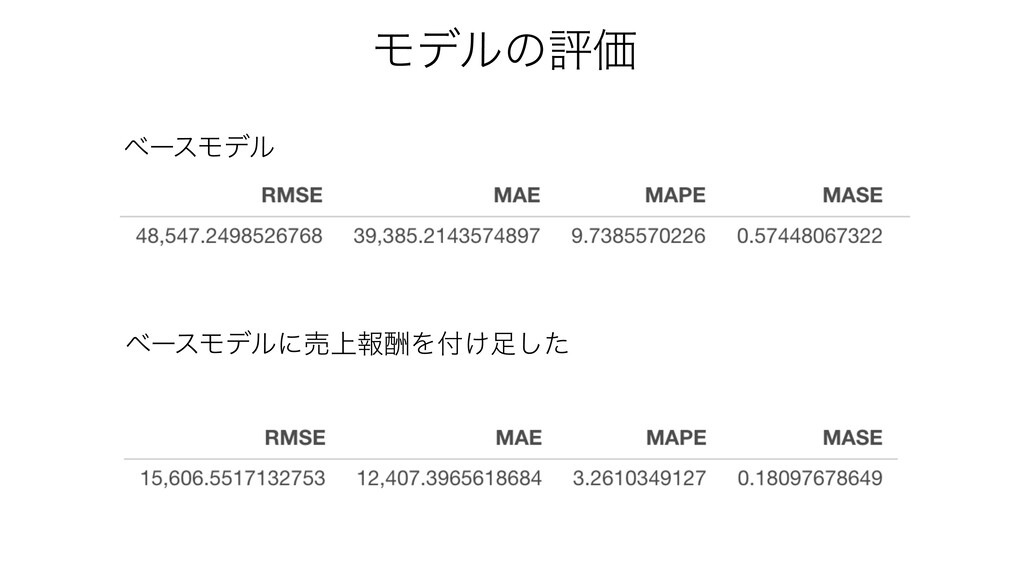
66 • RMSE (Root Mean Square Error) : ༧ଌ͔ΒͷͣΕͷೋͷฏۉͷϧʔτ •
MAE (Mean Absolute Error) : ༧ଌ͔ΒͷͣΕͷઈରͷฏۉ • MAPE (Mean Absolute Percentage Error) : ύʔηϯτͰදͨ͠༧ଌ͔Βͷ ͣΕͷઈରͷฏۉ • MASE (Mean Absolute Scaled Error) : MAEΛɺτϨʔχϯάσʔλͰͷφ Πʔϒ༧ଌʢҰͭલͷظͱಉ͕͡ݱΕΔͰ͋Ζ͏ͱ͍͏୯७ͳ༧ଌʣ ͷMAEͰׂͬͨͷɻ ࣌ܥྻ༧ଌͷධՁࢦඪ
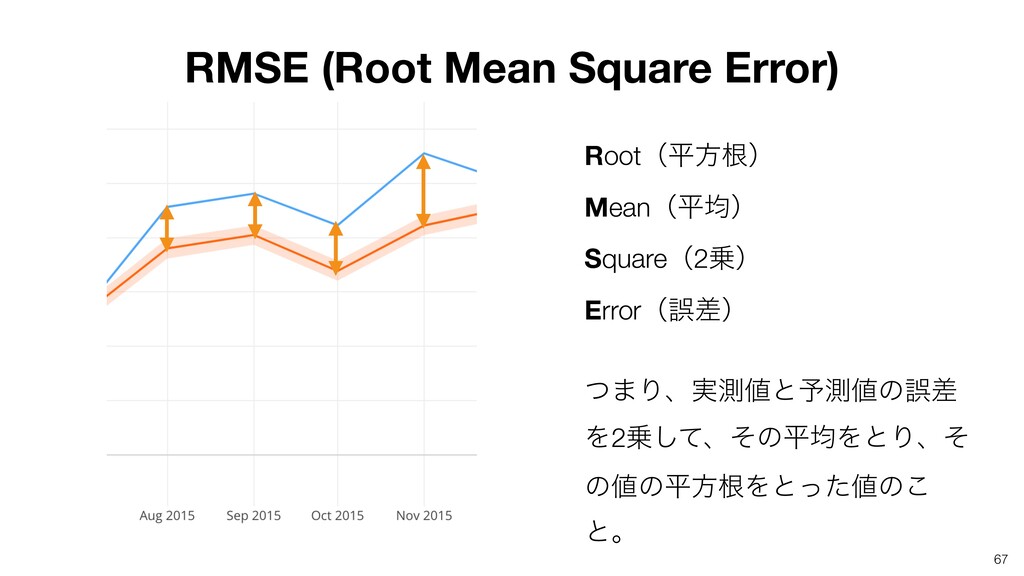
Rootʢฏํࠜʣ Meanʢฏۉʣ Squareʢ2ʣ Errorʢޡࠩʣ ͭ·Γɺ࣮ଌͱ༧ଌͷޡࠩ Λ2ͯ͠ɺͦͷฏۉΛͱΓɺͦ ͷͷฏํࠜΛͱͬͨͷ͜ ͱɻ 67 RMSE
(Root Mean Square Error)
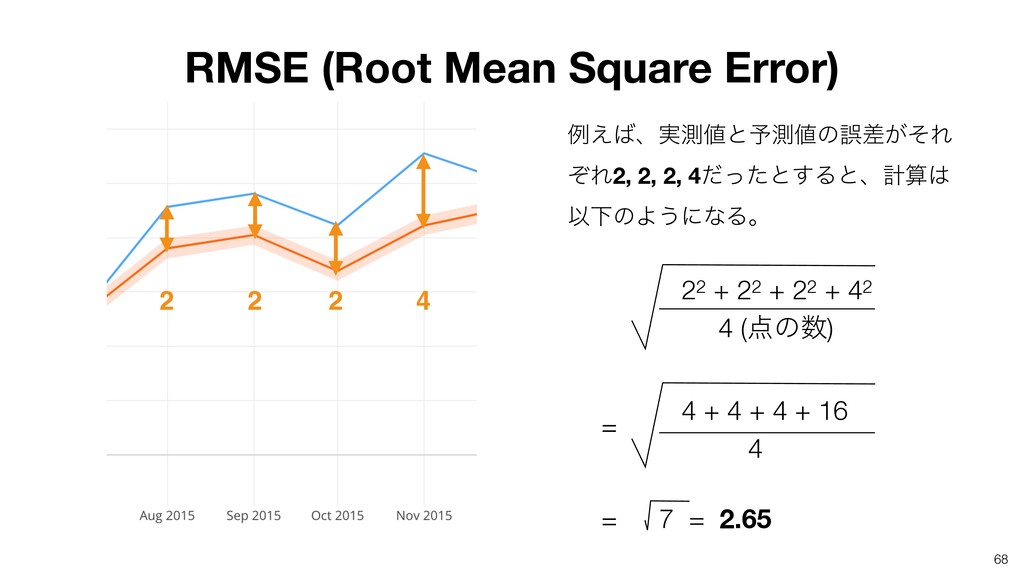
22 + 22 + 22 + 42 4
(ͷ) 4 + 4 + 4 + 16 4 7 = 2.65 68 RMSE (Root Mean Square Error) 2 2 4 2 = = ྫ͑ɺ࣮ଌͱ༧ଌͷޡ͕ࠩͦΕ ͧΕ2, 2, 2, 4ͩͬͨͱ͢Δͱɺܭࢉ ҎԼͷΑ͏ʹͳΔɻ
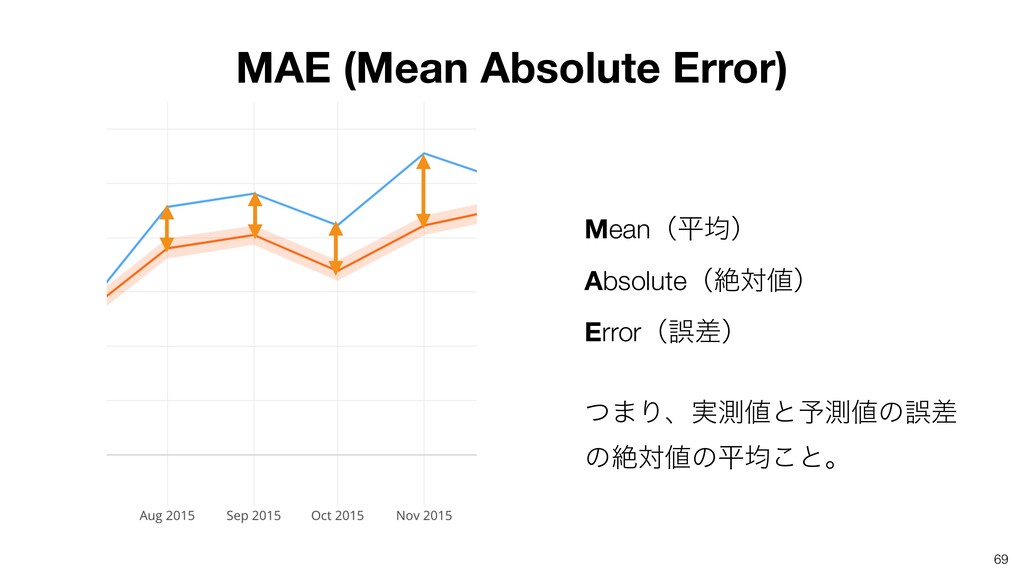
Meanʢฏۉʣ Absoluteʢઈରʣ Errorʢޡࠩʣ ͭ·Γɺ࣮ଌͱ༧ଌͷޡࠩ ͷઈରͷฏۉ͜ͱɻ 69 MAE (Mean Absolute Error)
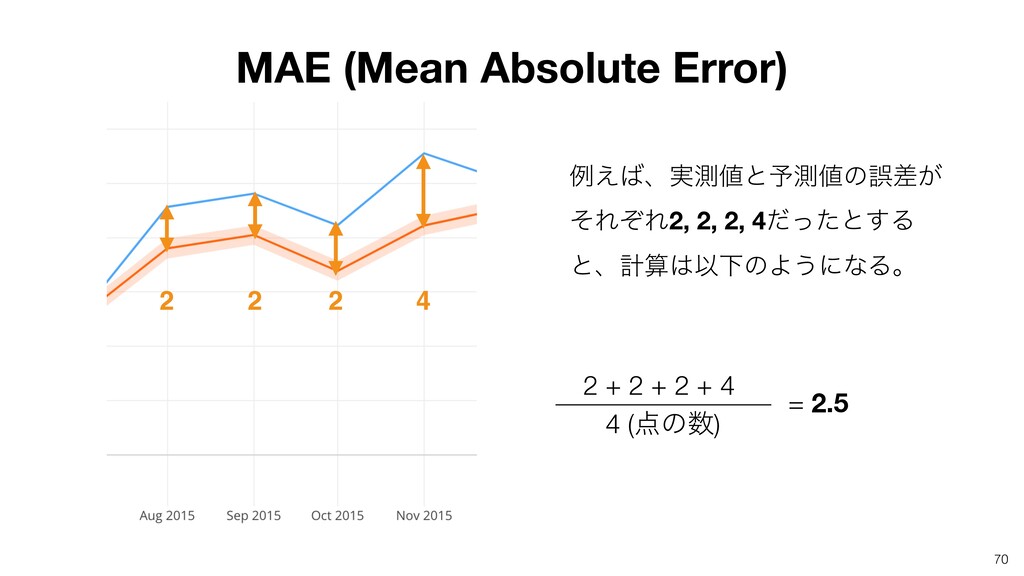
2 + 2 + 2 + 4 4
(ͷ) 70 ྫ͑ɺ࣮ଌͱ༧ଌͷޡ͕ࠩ ͦΕͧΕ2, 2, 2, 4ͩͬͨͱ͢Δ ͱɺܭࢉҎԼͷΑ͏ʹͳΔɻ = 2.5 MAE (Mean Absolute Error) 2 2 4 2
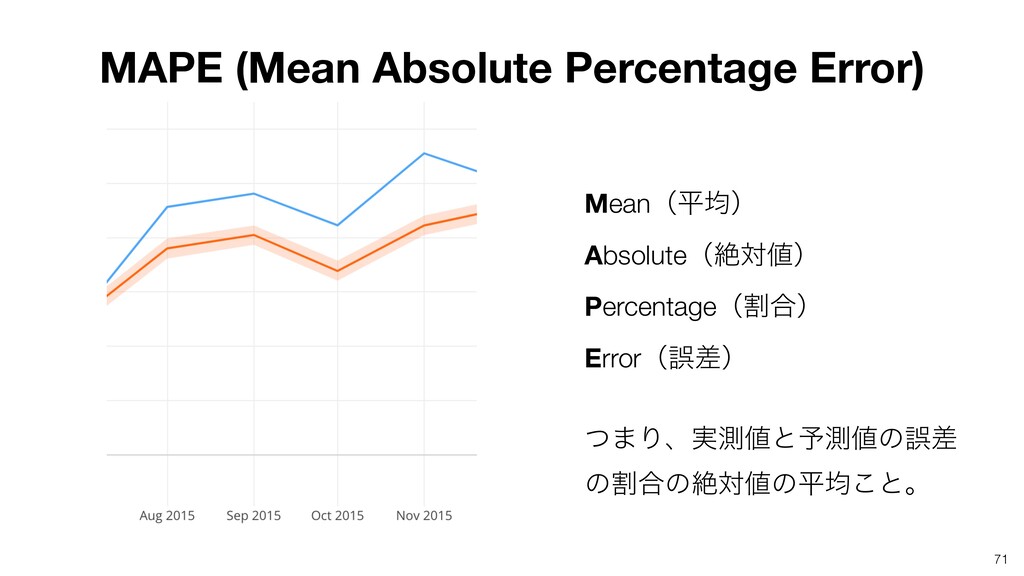
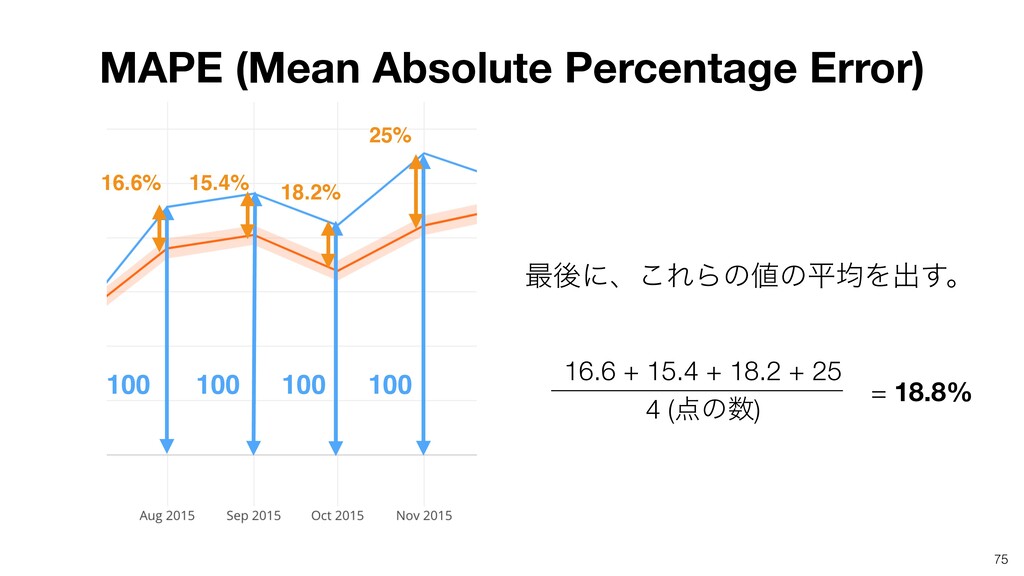
Meanʢฏۉʣ Absoluteʢઈରʣ Percentageʢׂ߹ʣ Errorʢޡࠩʣ ͭ·Γɺ࣮ଌͱ༧ଌͷޡࠩ ͷׂ߹ͷઈରͷฏۉ͜ͱɻ 71 MAPE (Mean Absolute
Percentage Error)
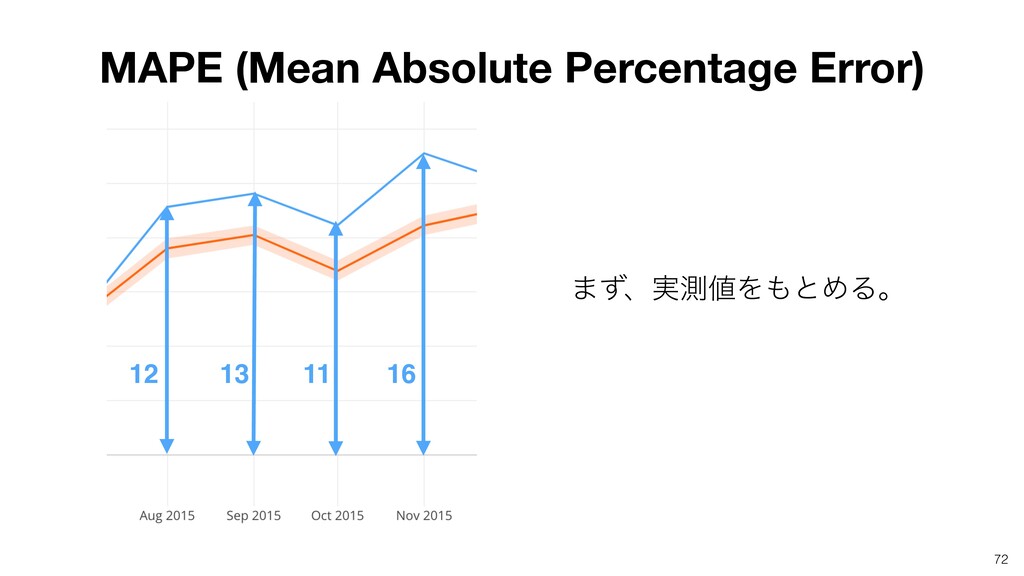
72 12 13 16 11 ·ͣɺ࣮ଌΛͱΊΔɻ MAPE (Mean Absolute Percentage
Error)
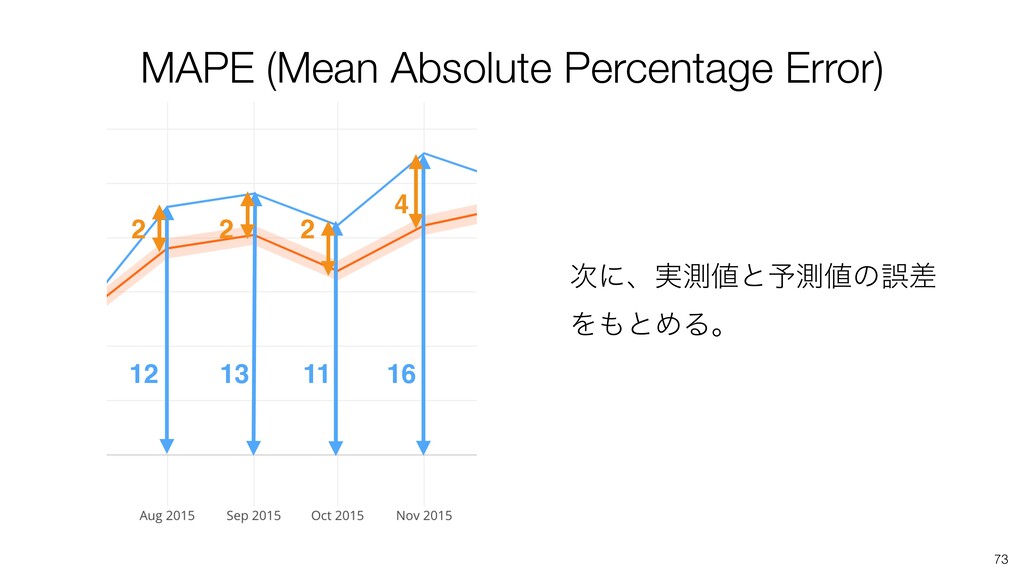
73 12 13 16 11 MAPE (Mean Absolute Percentage Error)
2 2 4 2 ࣍ʹɺ࣮ଌͱ༧ଌͷޡࠩ ΛͱΊΔɻ
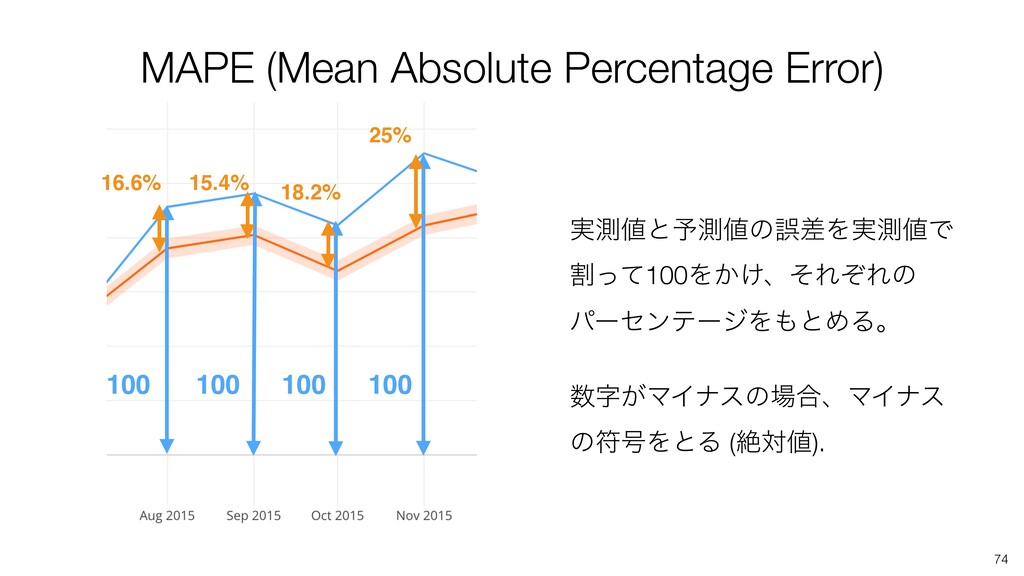
74 100 100 100 100 MAPE (Mean Absolute Percentage Error)
16.6% 15.4% 25% 18.2% ࣮ଌͱ༧ଌͷޡࠩΛ࣮ଌͰ ׂͬͯ100Λ͔͚ɺͦΕͧΕͷ ύʔηϯςʔδΛͱΊΔɻ ࣈ͕ϚΠφεͷ߹ɺϚΠφε ͷූ߸ΛͱΔ (ઈର).
75 100 100 100 100 MAPE (Mean Absolute Percentage Error)
16.6% 15.4% 25% 18.2% 16.6 + 15.4 + 18.2 + 25 4 (ͷ) ࠷ޙʹɺ͜ΕΒͷͷฏۉΛग़͢ɻ = 18.8%
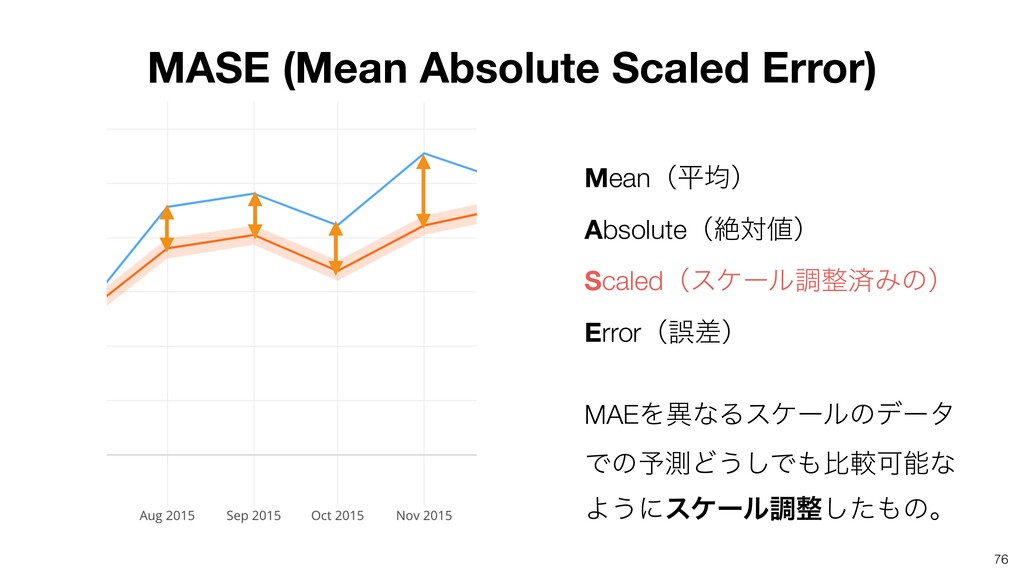
76 Meanʢฏۉʣ Absoluteʢઈରʣ ScaledʢεέʔϧௐࡁΈͷʣ Errorʢޡࠩʣ MAEΛҟͳΔεέʔϧͷσʔλ Ͱͷ༧ଌͲ͏͠ͰൺֱՄೳͳ Α͏ʹεέʔϧௐͨ͠ͷɻ MASE (Mean
Absolute Scaled Error)
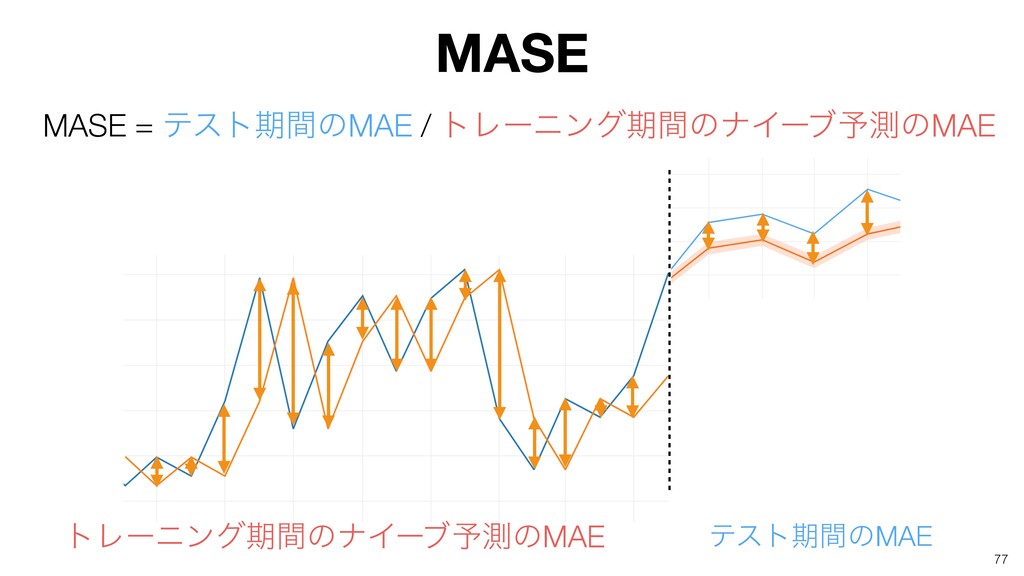
77 MASE = ςετظؒͷMAE / τϨʔχϯάظؒͷφΠʔϒ༧ଌͷMAE MASE ςετظؒͷMAE τϨʔχϯάظؒͷφΠʔϒ༧ଌͷMAE
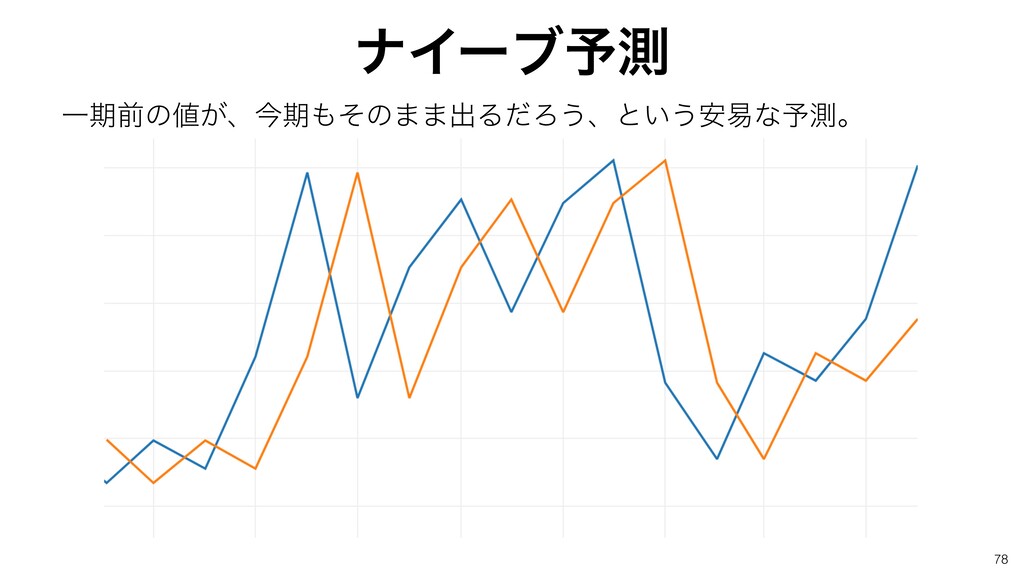
78 Ұظલͷ͕ɺࠓظͦͷ··ग़ΔͩΖ͏ɺͱ͍͏҆қͳ༧ଌɻ φΠʔϒ༧ଌ
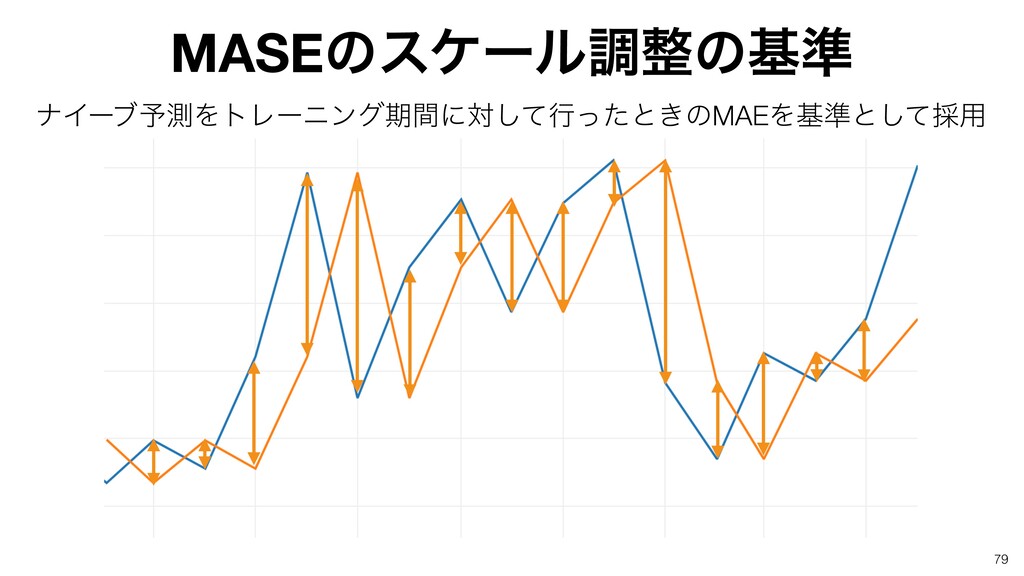
79 φΠʔϒ༧ଌΛτϨʔχϯάظؒʹରͯ͠ߦͬͨͱ͖ͷMAEΛج४ͱͯ͠࠾༻ MASEͷεέʔϧௐͷج४
80 MASE = ςετظؒͷMAE / τϨʔχϯάظؒͷφΠʔϒ༧ଌͷMAE MASE ςετظؒͷMAE τϨʔχϯάظؒͷφΠʔϒ༧ଌͷMAE
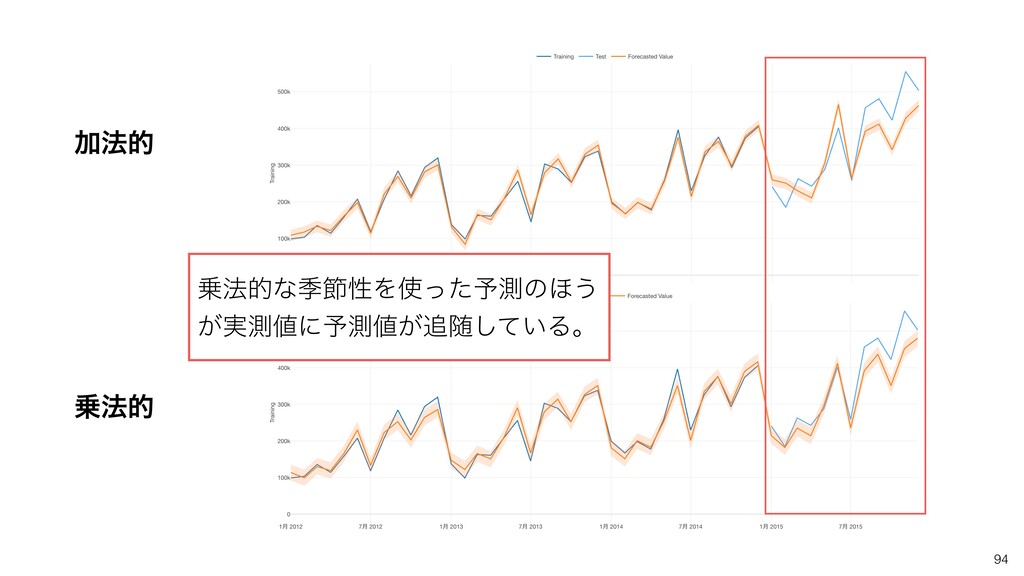
81 قઅੑͷϞʔυ Ճ๏త vs ๏త
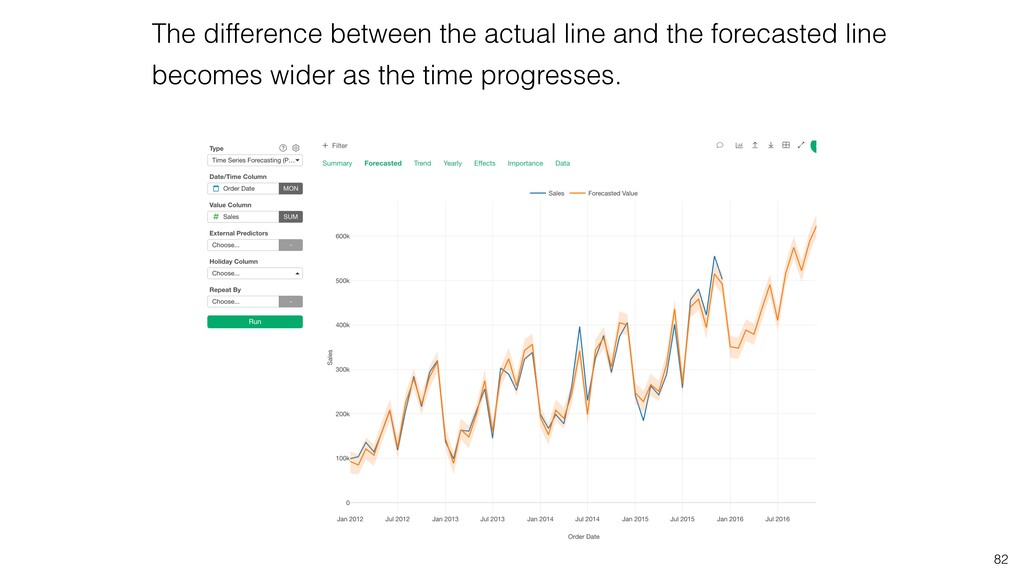
82 The difference between the actual line and the forecasted
line becomes wider as the time progresses.
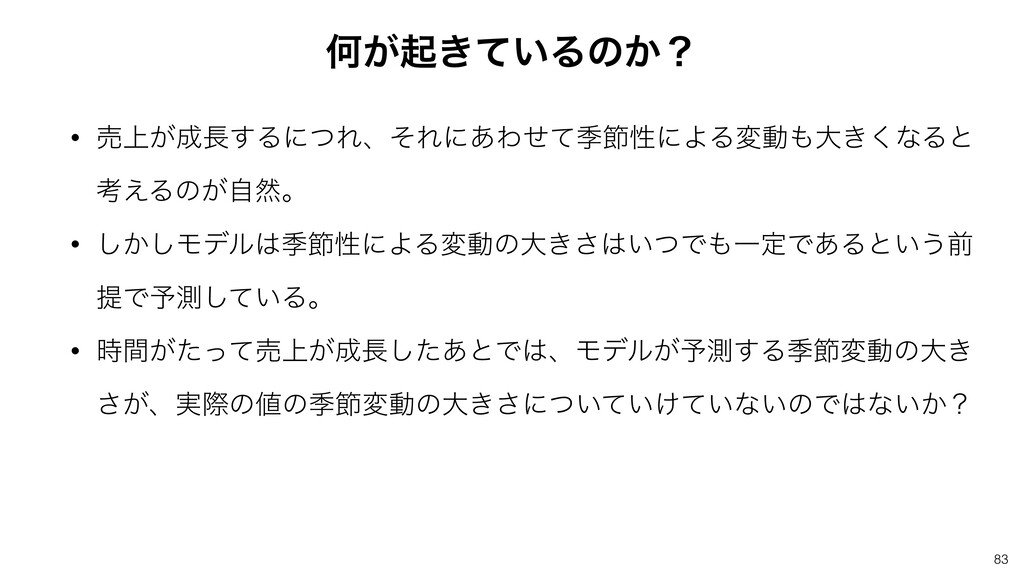
Կ͕ى͖͍ͯΔͷ͔ʁ 83 • ച্͕͢ΔʹͭΕɺͦΕʹ͋ΘͤͯقઅੑʹΑΔมಈେ͖͘ͳΔͱ ߟ͑Δͷ͕ࣗવɻ • ͔͠͠ϞσϧقઅੑʹΑΔมಈͷେ͖͍ͭ͞ͰҰఆͰ͋Δͱ͍͏લ ఏͰ༧ଌ͍ͯ͠Δɻ • ͕࣌ؒͨͬͯച্͕ͨ͋͠ͱͰɺϞσϧ͕༧ଌ͢Δقઅมಈͷେ͖
͕͞ɺ࣮ࡍͷͷقઅมಈͷେ͖͞ʹ͍͍͚͍ͭͯͯͳ͍ͷͰͳ͍͔ʁ
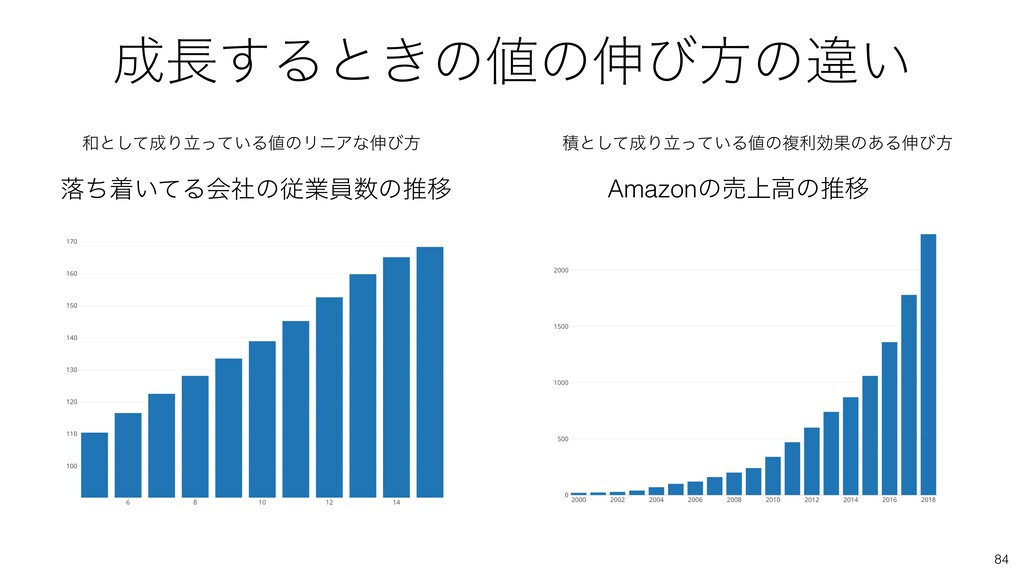
ͱͯ͠Γཱ͍ͬͯΔͷϦχΞͳ৳ͼํ ੵͱͯ͠Γཱ͍ͬͯΔͷෳརޮՌͷ͋Δ৳ͼํ མͪண͍ͯΔձࣾͷैۀһͷਪҠ Amazonͷച্ߴͷਪҠ ͢Δͱ͖ͷͷ৳ͼํͷҧ͍ 84
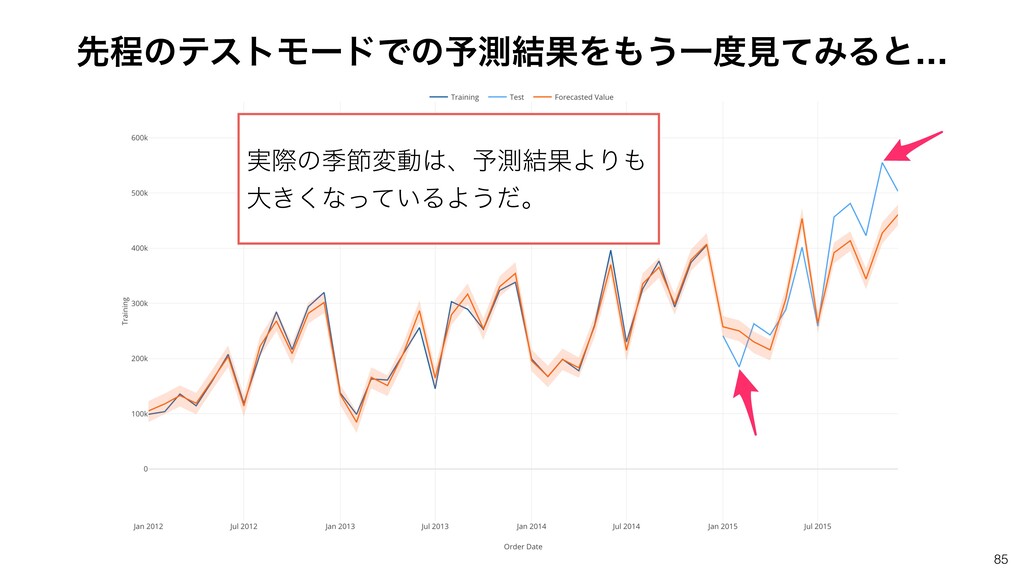
ઌఔͷςετϞʔυͰͷ༧ଌ݁ՌΛ͏ҰݟͯΈΔͱ… 85 ࣮ࡍͷقઅมಈɺ༧ଌ݁ՌΑΓ େ͖͘ͳ͍ͬͯΔΑ͏ͩɻ
Կ͕ى͖͍ͯΔͷ͔ʁ 86 ച্ͷʹͱͳͬͯେ͖͘ͳΔقઅมಈΛϞσϧԽͰ͖ΕΑ͍ͷͰʁ • ച্͕͢ΔʹͭΕɺͦΕʹ͋ΘͤͯقઅੑʹΑΔมಈେ͖͘ͳΔͱ ߟ͑Δͷ͕ࣗવɻ • ͔͠͠ϞσϧقઅੑʹΑΔมಈͷେ͖͍ͭ͞ͰҰఆͰ͋Δͱ͍͏લ ఏͰ༧ଌ͍ͯ͠Δɻ •
͕࣌ؒͨͬͯച্͕ͨ͋͠ͱͰɺϞσϧ͕༧ଌ͢Δقઅมಈͷେ͖ ͕͞ɺ࣮ࡍͷͷقઅมಈͷେ͖͞ʹ͍͍͚͍ͭͯͯͳ͍ͷͰͳ͍͔ʁ
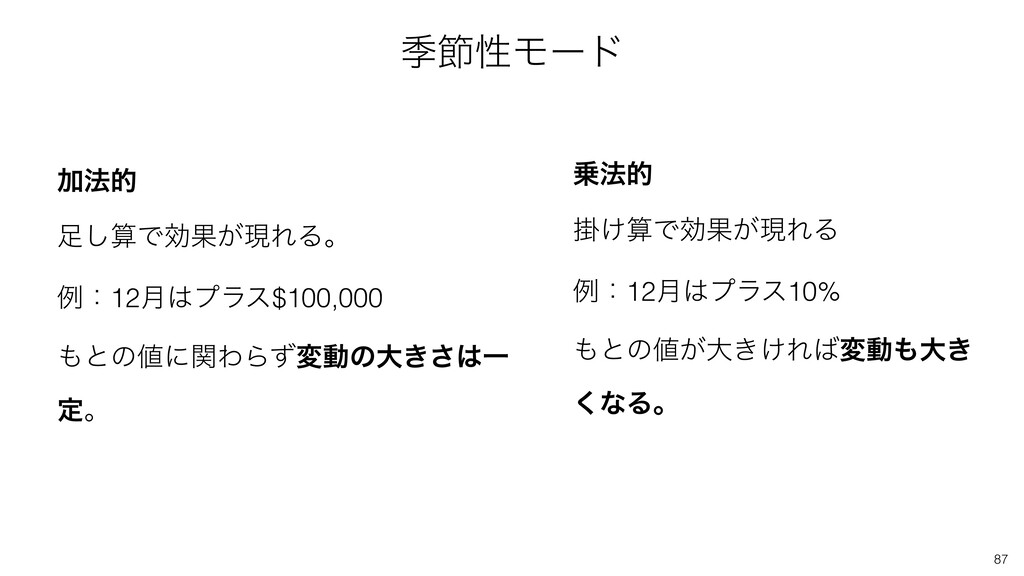
قઅੑϞʔυ 87 Ճ๏త ͠ࢉͰޮՌ͕ݱΕΔɻ ྫɿ12݄ϓϥε$100,000 ͱͷʹؔΘΒͣมಈͷେ͖͞Ұ ఆɻ ๏త ֻ͚ࢉͰޮՌ͕ݱΕΔ ྫɿ12݄ϓϥε10%
ͱͷ͕େ͖͚Εมಈେ͖ ͘ͳΔɻ
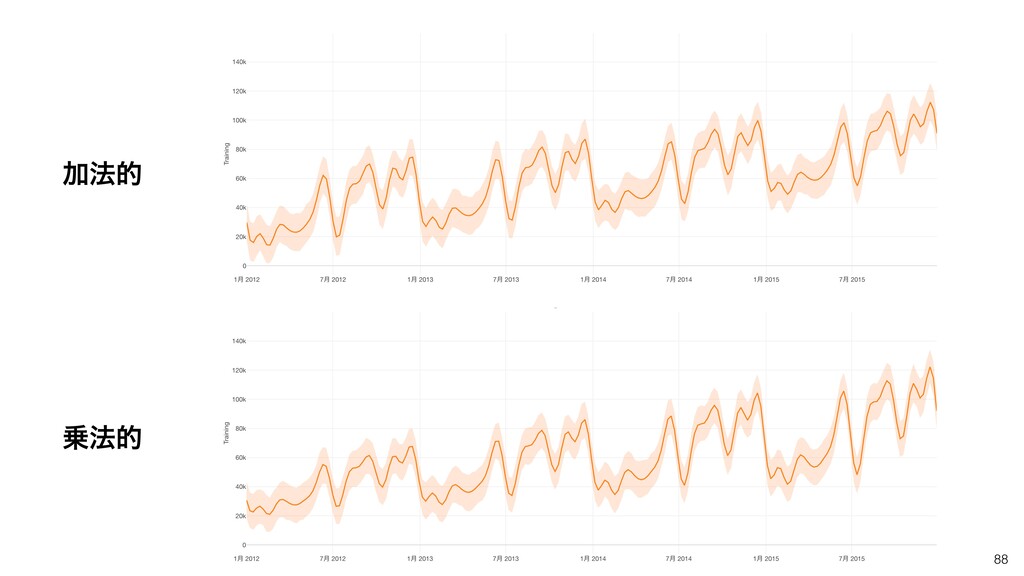
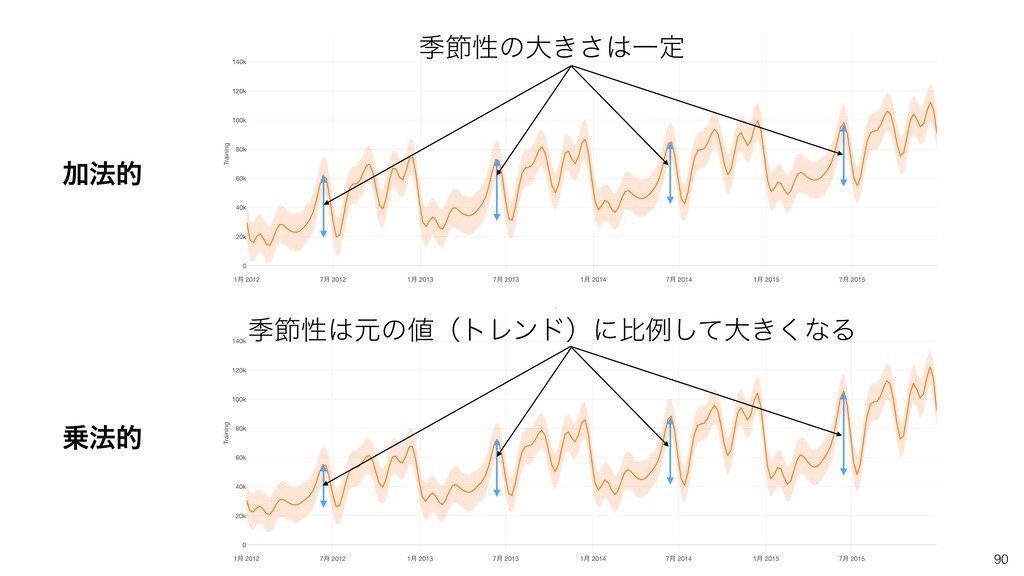
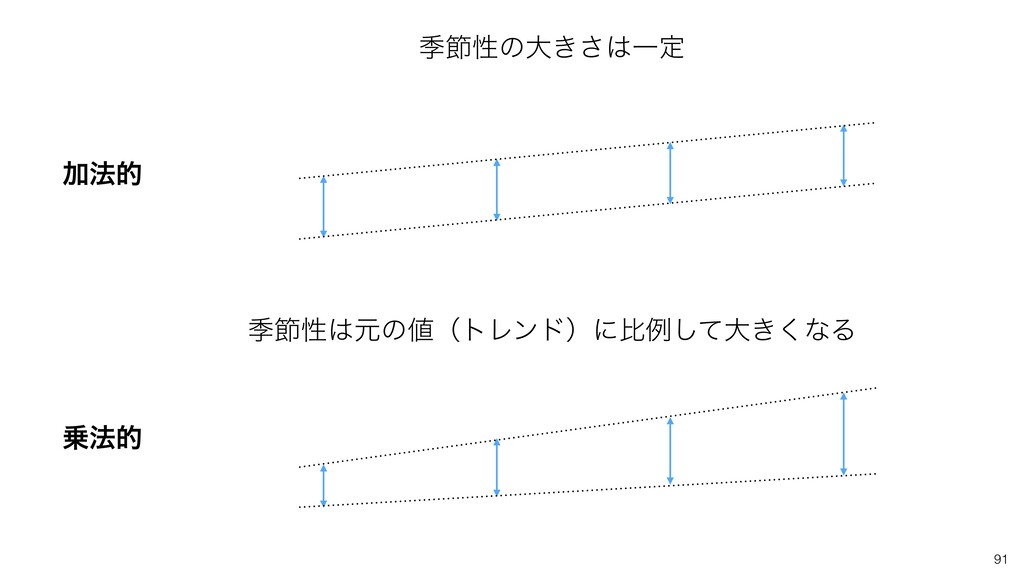
88 Ճ๏త ๏త
89 Ճ๏త ๏త قઅੑͷେ͖͞Ұఆ
90 Ճ๏త ๏త قઅੑͷେ͖͞Ұఆ قઅੑݩͷʢτϨϯυʣʹൺྫͯ͠େ͖͘ͳΔ
91 Ճ๏త ๏త قઅੑͷେ͖͞Ұఆ قઅੑݩͷʢτϨϯυʣʹൺྫͯ͠େ͖͘ͳΔ
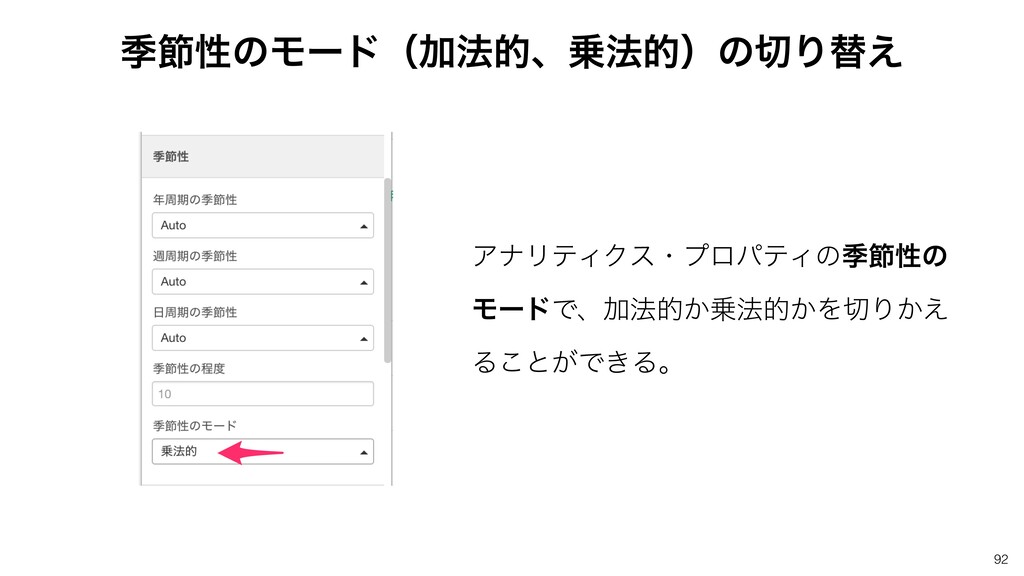
قઅੑͷϞʔυʢՃ๏తɺ๏తʣͷΓସ͑ 92 ΞφϦςΟΫεɾϓϩύςΟͷقઅੑͷ ϞʔυͰɺՃ๏త͔๏త͔ΛΓ͔͑ Δ͜ͱ͕Ͱ͖Δɻ
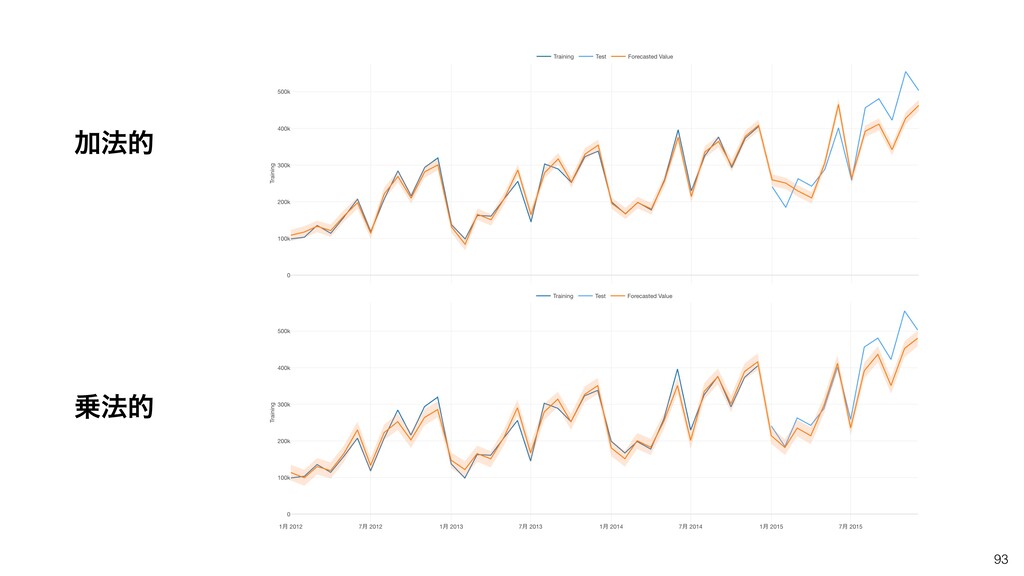
93 Ճ๏త ๏త
94 Ճ๏త ๏త ๏తͳقઅੑΛͬͨ༧ଌͷ΄͏ ͕࣮ଌʹ༧ଌ͕ਵ͍ͯ͠Δɻ
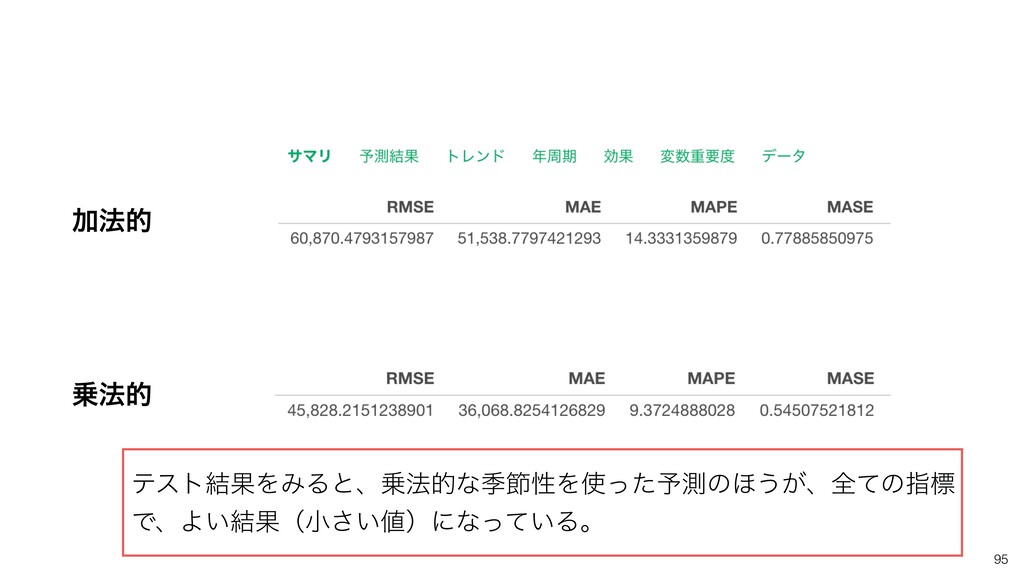
95 Ճ๏త ๏త ςετ݁ՌΛΈΔͱɺ๏తͳقઅੑΛͬͨ༧ଌͷ΄͏͕ɺશͯͷࢦඪ ͰɺΑ͍݁Ռʢখ͍͞ʣʹͳ͍ͬͯΔɻ
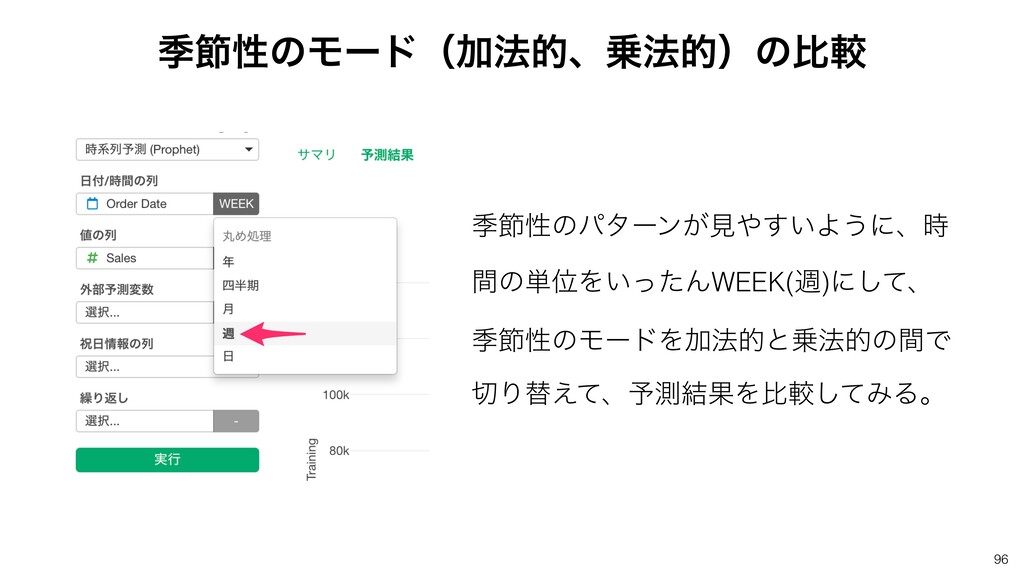
قઅੑͷϞʔυʢՃ๏తɺ๏తʣͷൺֱ 96 قઅੑͷύλʔϯ͕ݟ͍͢Α͏ʹɺ࣌ ؒͷ୯ҐΛ͍ͬͨΜWEEK(ि)ʹͯ͠ɺ قઅੑͷϞʔυΛՃ๏తͱ๏తͷؒͰ Γସ͑ͯɺ༧ଌ݁ՌΛൺֱͯ͠ΈΔɻ
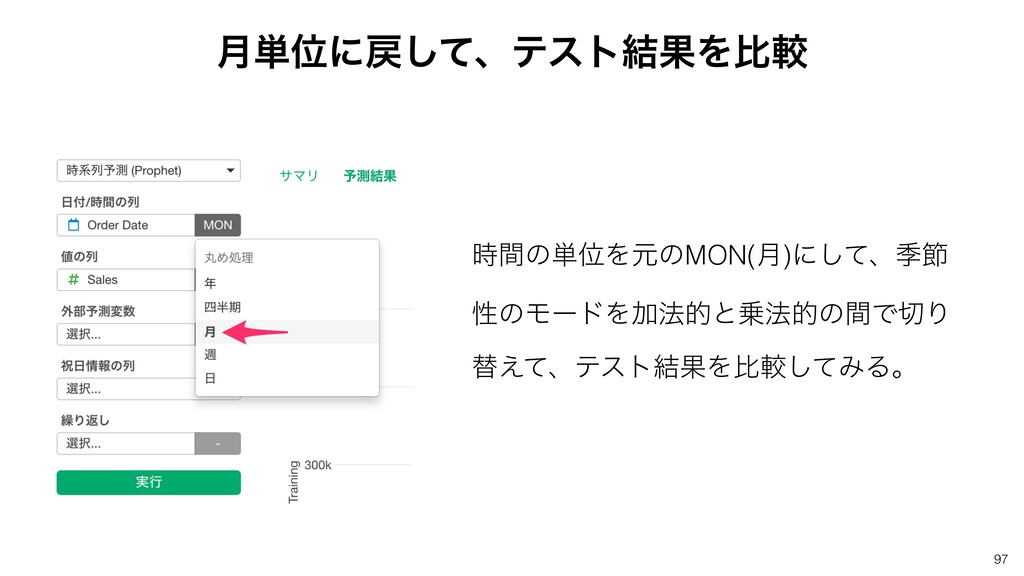
݄୯Ґʹͯ͠ɺςετ݁ՌΛൺֱ 97 ࣌ؒͷ୯ҐΛݩͷMON(݄)ʹͯ͠ɺقઅ ੑͷϞʔυΛՃ๏తͱ๏తͷؒͰΓ ସ͑ͯɺςετ݁ՌΛൺֱͯ͠ΈΔɻ
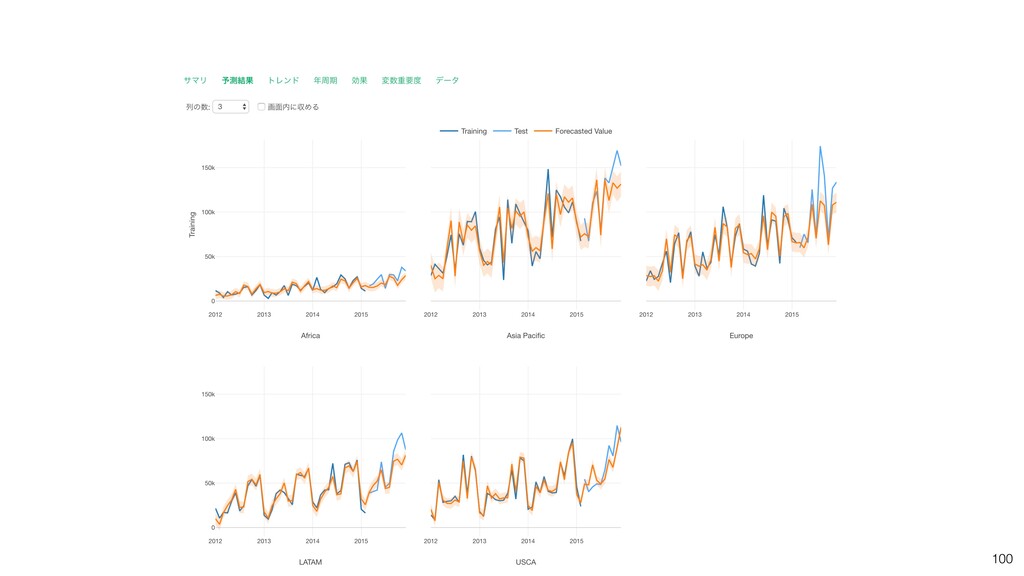
98 ʮ܁Γฦ͠ʯΛͬͯෳͷϞσϧΛ࡞Γɺ ͦΕΒΛൺֱ͢Δ
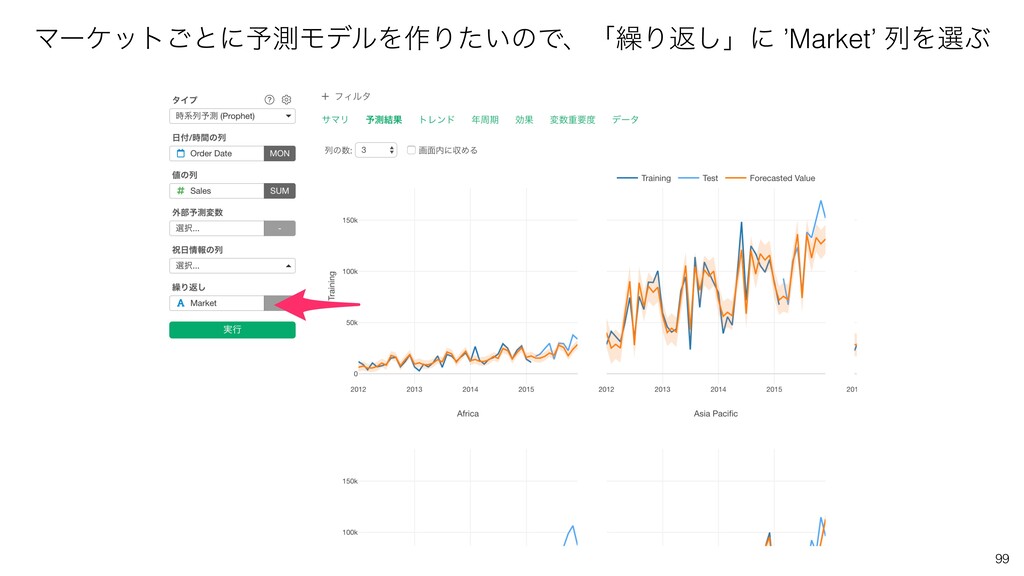
99 Ϛʔέοτ͝ͱʹ༧ଌϞσϧΛ࡞Γ͍ͨͷͰɺʮ܁Γฦ͠ʯʹ ’Market’ ྻΛબͿ
100
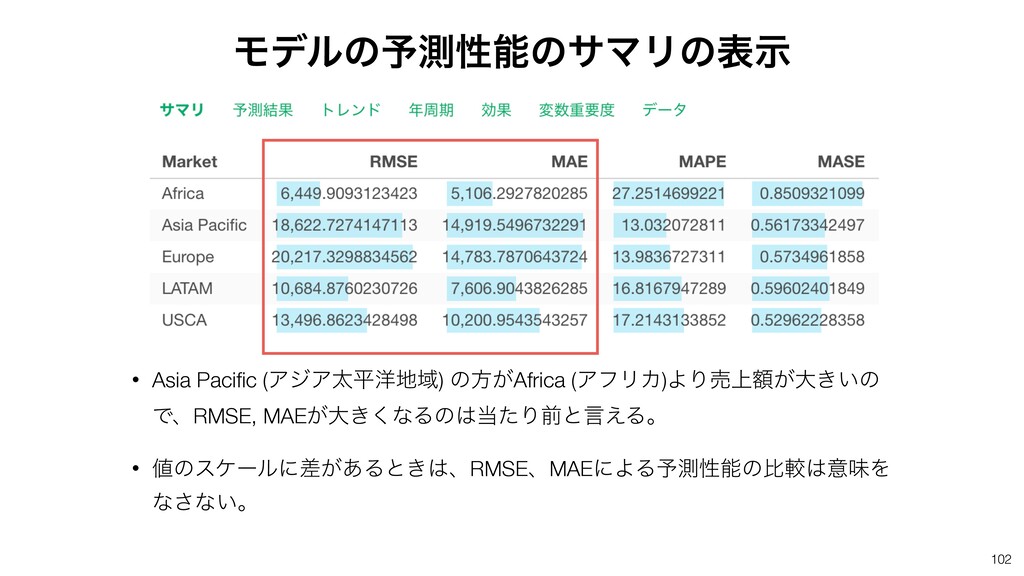
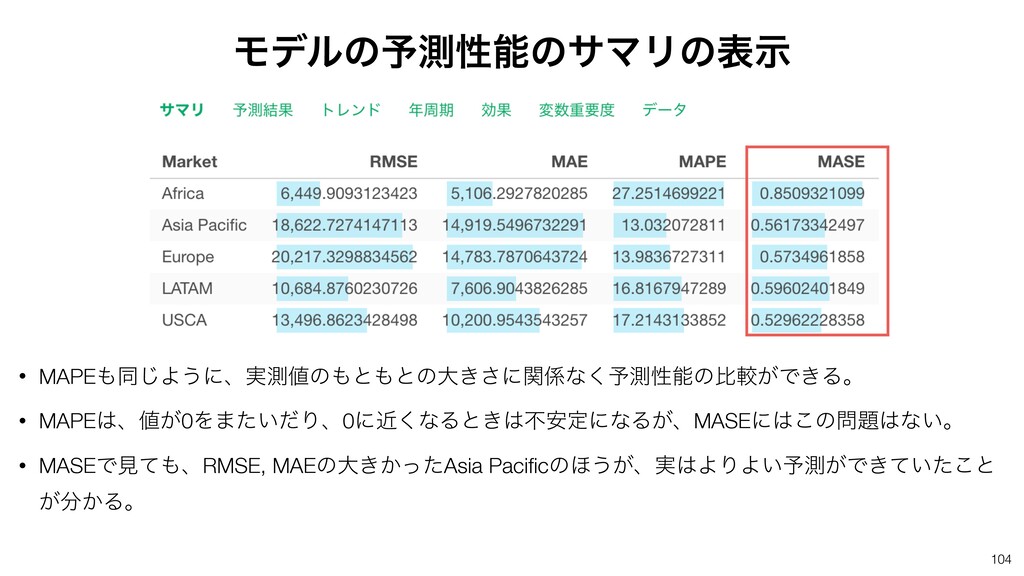
• RMSE, MAEͰݟΔͱɺAfrica (ΞϑϦΧ)ͷ΄͏͕Asia Pacific (ΞδΞଠฏ༸ Ҭ)ΑΓ༧ଌͱ࣮ଌͷ͕ࠩখ͍͜͞ͱ͕͔Δɻ • ͜ΕΛͬͯɺAfricaͷํ͕Α͘༧ଌͰ͖͍ͯΔͱݴ͑ΔͩΖ͏͔ʁ Ϟσϧͷ༧ଌਫ਼ͷࢦඪΛൺΔ
101
• Asia Pacific (ΞδΞଠฏ༸Ҭ) ͷํ͕Africa (ΞϑϦΧ)ΑΓച্ֹ͕େ͖͍ͷ ͰɺRMSE, MAE͕େ͖͘ͳΔͷͨΓલͱݴ͑Δɻ • ͷεέʔϧʹ͕ࠩ͋Δͱ͖ɺRMSEɺMAEʹΑΔ༧ଌੑೳͷൺֱҙຯΛ
ͳ͞ͳ͍ɻ Ϟσϧͷ༧ଌੑೳͷαϚϦͷදࣔ 102
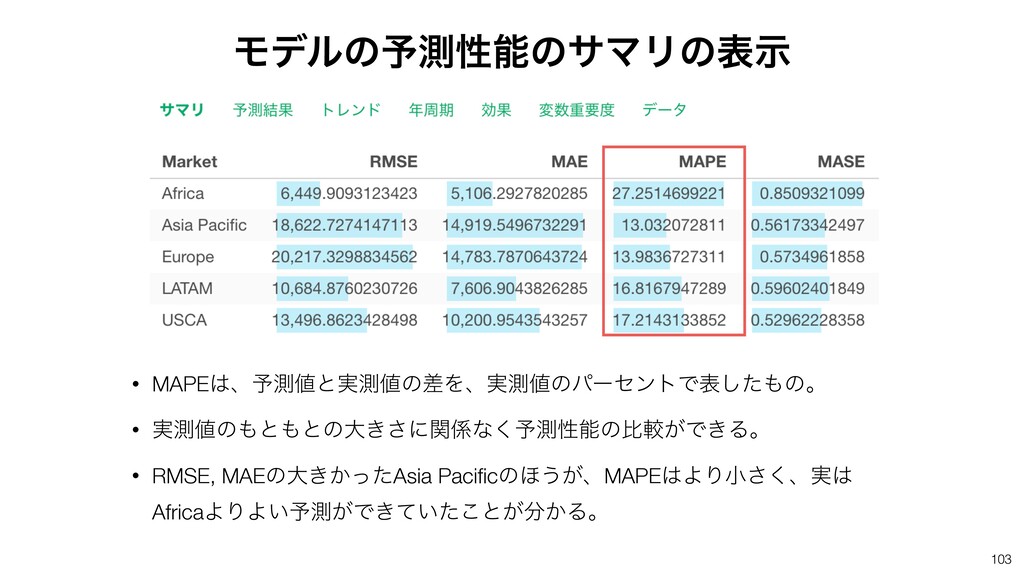
• MAPEɺ༧ଌͱ࣮ଌͷࠩΛɺ࣮ଌͷύʔηϯτͰදͨ͠ͷɻ • ࣮ଌͷͱͱͷେ͖͞ʹؔͳ͘༧ଌੑೳͷൺֱ͕Ͱ͖Δɻ • RMSE, MAEͷେ͖͔ͬͨAsia Pacificͷ΄͏͕ɺMAPEΑΓখ͘͞ɺ࣮ AfricaΑΓΑ͍༧ଌ͕Ͱ͖͍ͯͨ͜ͱ͕͔Δɻ Ϟσϧͷ༧ଌੑೳͷαϚϦͷදࣔ
103
• MAPEಉ͡Α͏ʹɺ࣮ଌͷͱͱͷେ͖͞ʹؔͳ͘༧ଌੑೳͷൺֱ͕Ͱ͖Δɻ • MAPEɺ͕0Λ·͍ͨͩΓɺ0ʹۙ͘ͳΔͱ͖ෆ҆ఆʹͳΔ͕ɺMASEʹ͜ͷͳ͍ɻ • MASEͰݟͯɺRMSE, MAEͷେ͖͔ͬͨAsia Pacificͷ΄͏͕ɺ࣮ΑΓΑ͍༧ଌ͕Ͱ͖͍ͯͨ͜ͱ ͕͔Δɻ Ϟσϧͷ༧ଌੑೳͷαϚϦͷදࣔ
104
֎෦༧ଌม
ച্ʢSalesʣͱ૬ؔؔʹ͋Δม͕͋ͬͨͱͯ͠ɺ͞Βʹͦͷ มͷকདྷͷΛ༧ଌͰ͖Δɺ·ͨίϯτϩʔϧͰ͖Δͱͨ͠ Βɺച্ʢSalesʣΛ͞Βʹྑ͍ਫ਼Ͱ༧ଌͰ͖ΔͷͰͳ͍͔ʁ
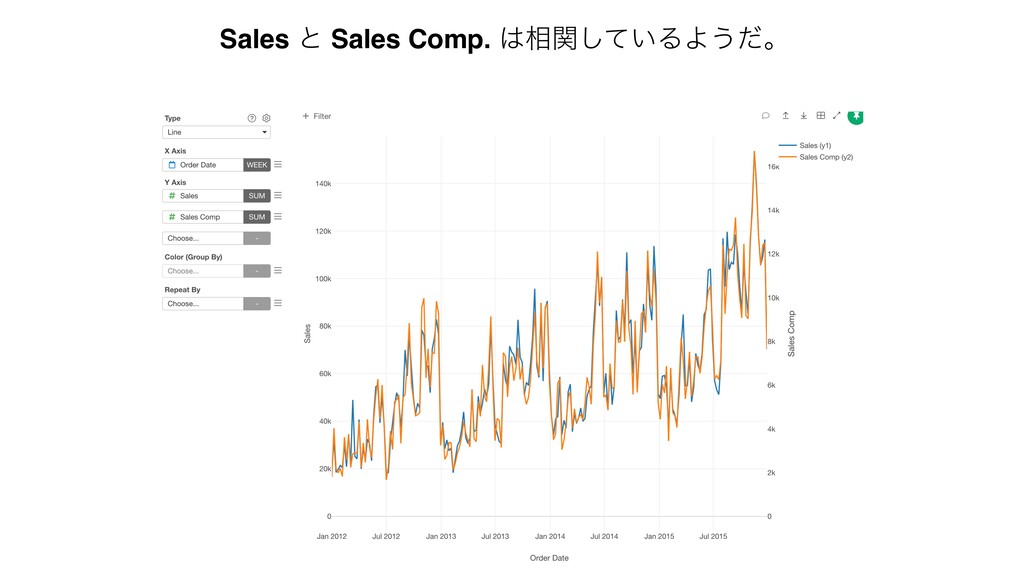
Sales ͱ Sales Comp. ૬͍ؔͯ͠ΔΑ͏ͩɻ
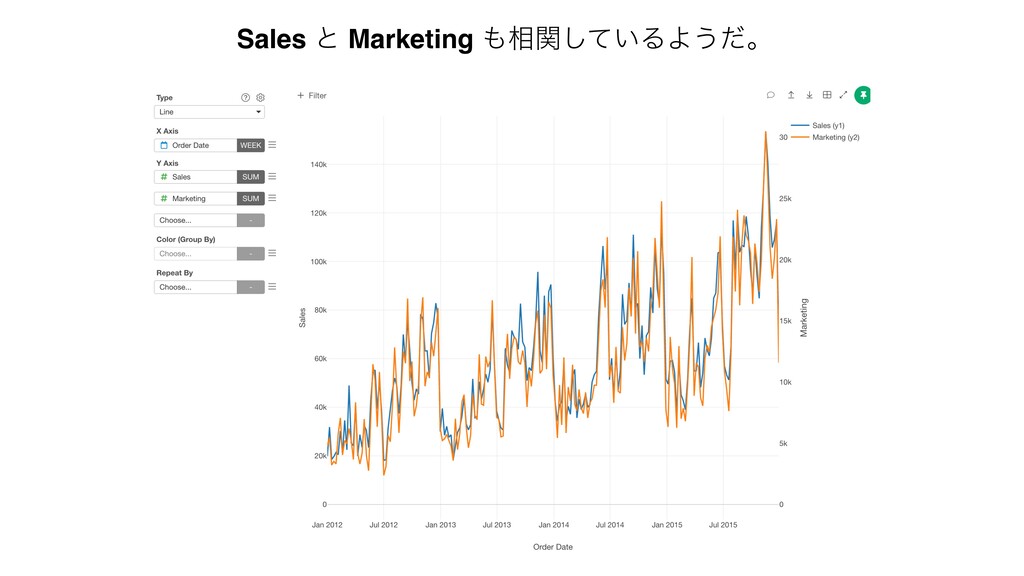
Sales ͱ Marketing ૬͍ؔͯ͠ΔΑ͏ͩɻ
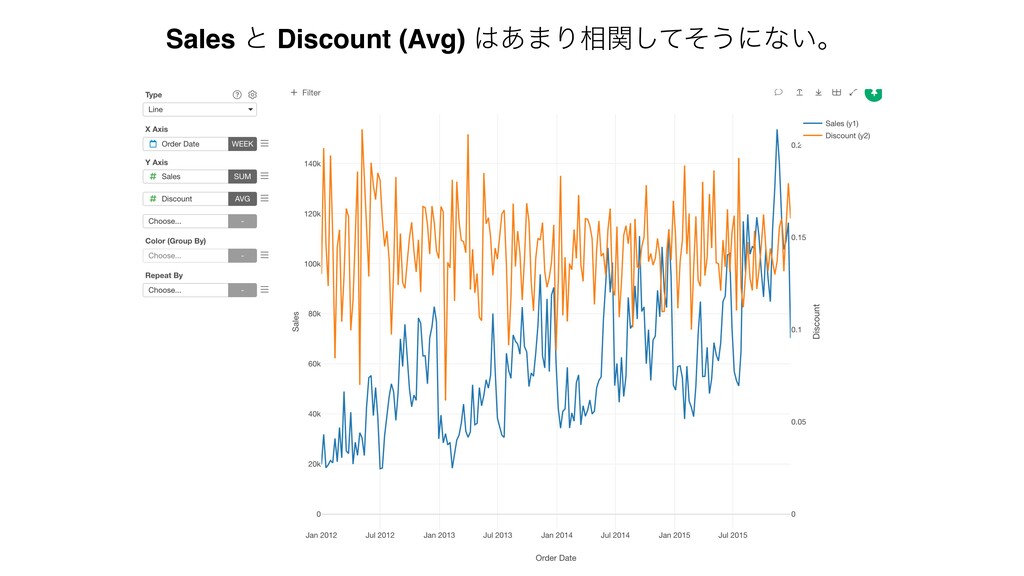
Sales ͱ Discount (Avg) ͋·Γ૬ؔͯͦ͠͏ʹͳ͍ɻ
ϚʔέςΟϯά ࣍ͷ3ϲ݄ɺͲΕ͚ͩࠂʹ͓ۚΛඅ͔͢ίϯτϩʔϧͰ͖Δͱͨ͠ ΒɺͦͷใΛϞσϧʹΈࠐΉ͜ͱͰ͖ͳ͍͔ʁ ྫ
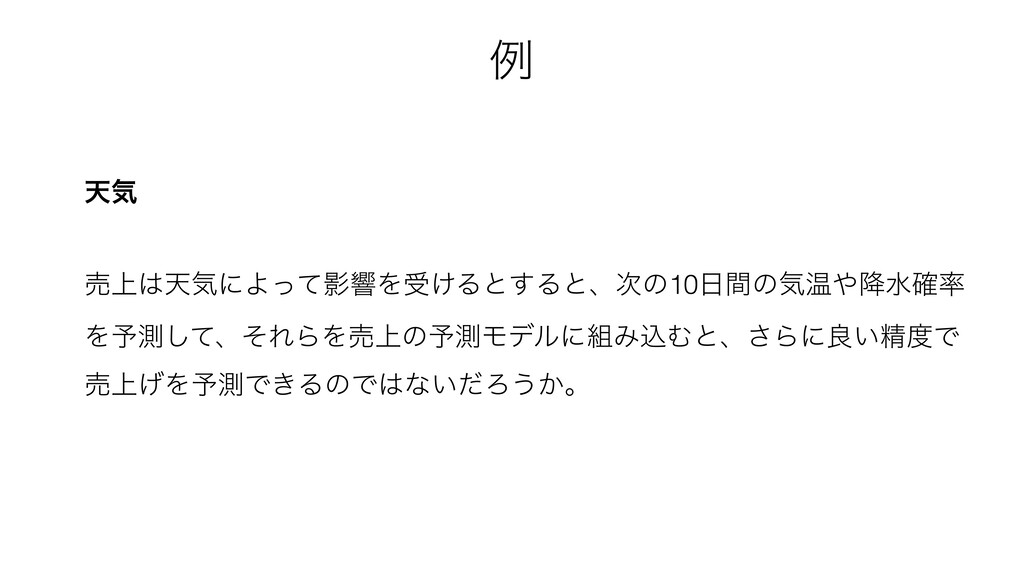
ఱؾ ച্ఱؾʹΑͬͯӨڹΛड͚Δͱ͢Δͱɺ࣍ͷ10ؒͷؾԹ߱ਫ֬ Λ༧ଌͯ͠ɺͦΕΒΛച্ͷ༧ଌϞσϧʹΈࠐΉͱɺ͞Βʹྑ͍ਫ਼Ͱ ച্͛Λ༧ଌͰ͖ΔͷͰͳ͍ͩΖ͏͔ɻ ྫ
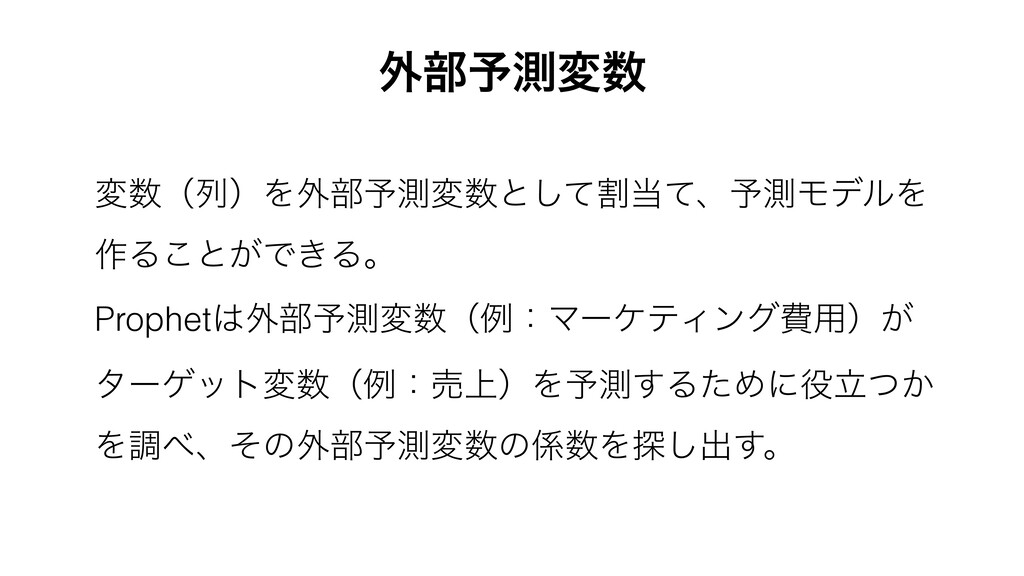
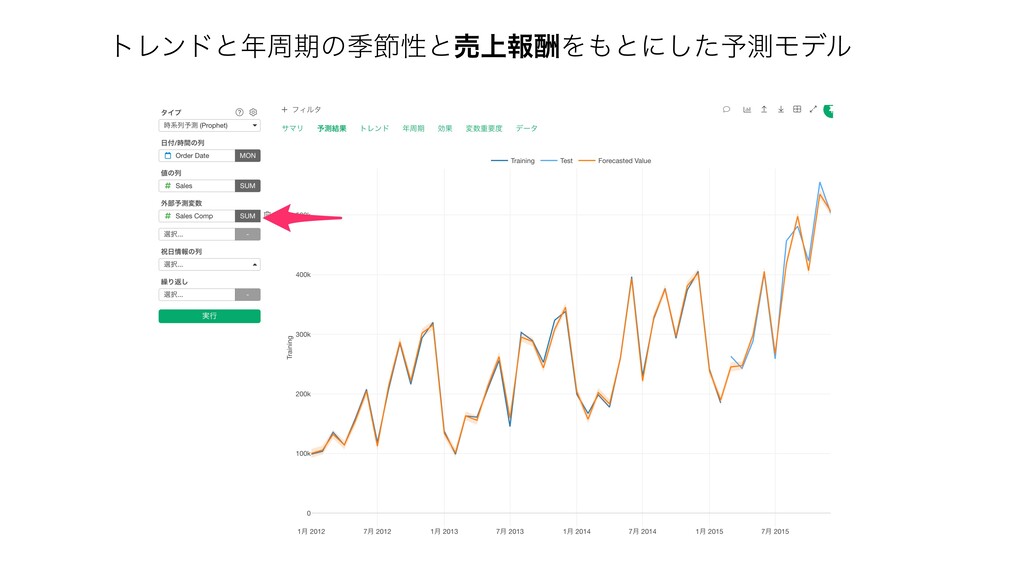
มʢྻʣΛ֎෦༧ଌมͱׂͯͯ͠ɺ༧ଌϞσϧΛ ࡞Δ͜ͱ͕Ͱ͖Δɻ Prophet֎෦༧ଌมʢྫɿϚʔέςΟϯάඅ༻ʣ͕ λʔήοτมʢྫɿച্ʣΛ༧ଌ͢ΔͨΊʹཱ͔ͭ Λௐɺͦͷ֎෦༧ଌมͷΛ୳͠ग़͢ɻ ֎෦༧ଌม
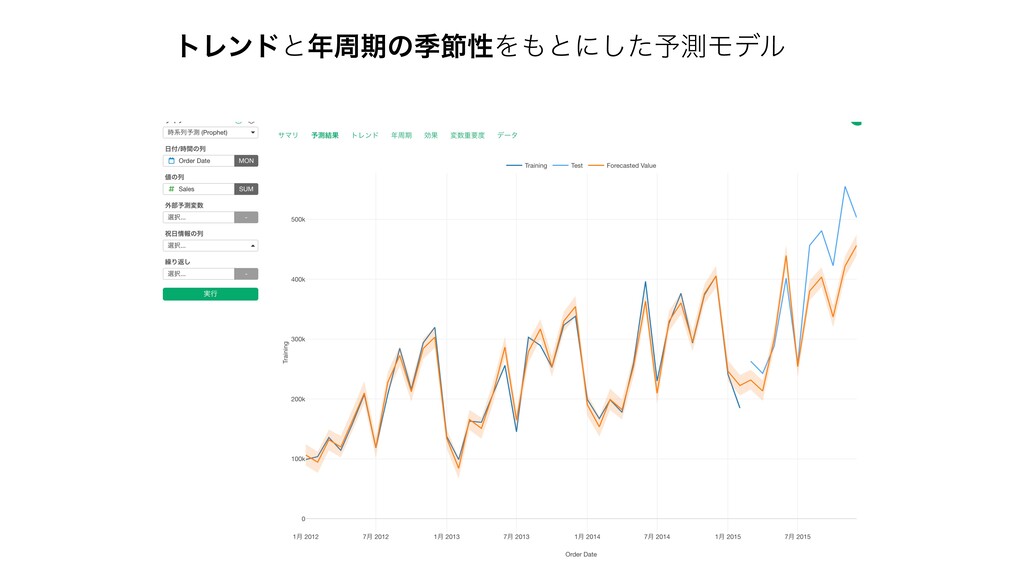
τϨϯυͱपظͷقઅੑΛͱʹͨ͠༧ଌϞσϧ
ϕʔεϞσϧͷධՁ
τϨϯυͱपظͷقઅੑͱച্ใुΛͱʹͨ͠༧ଌϞσϧ
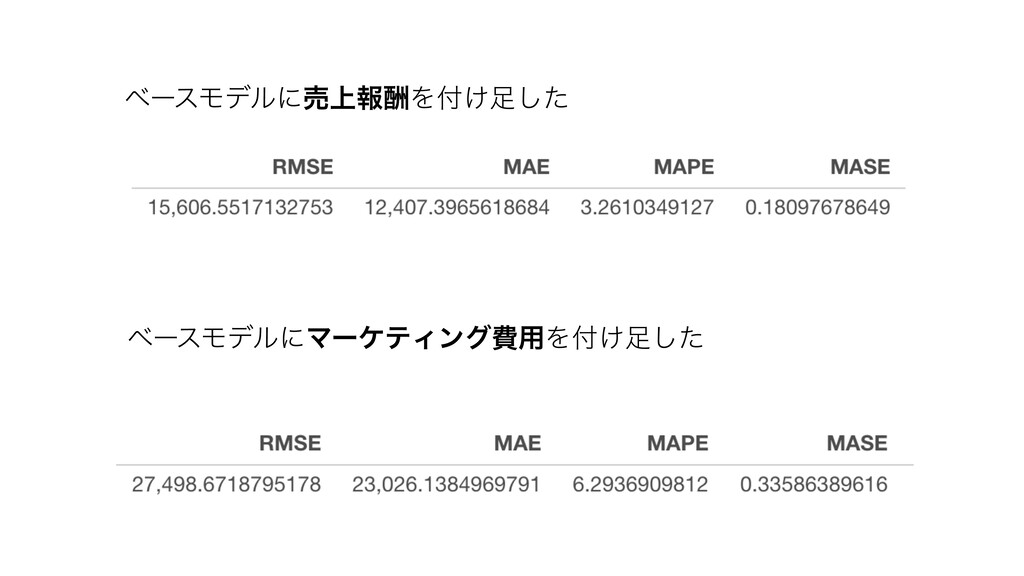
ϞσϧͷධՁ ϕʔεϞσϧ ϕʔεϞσϧʹച্ใुΛ͚ͨ͠
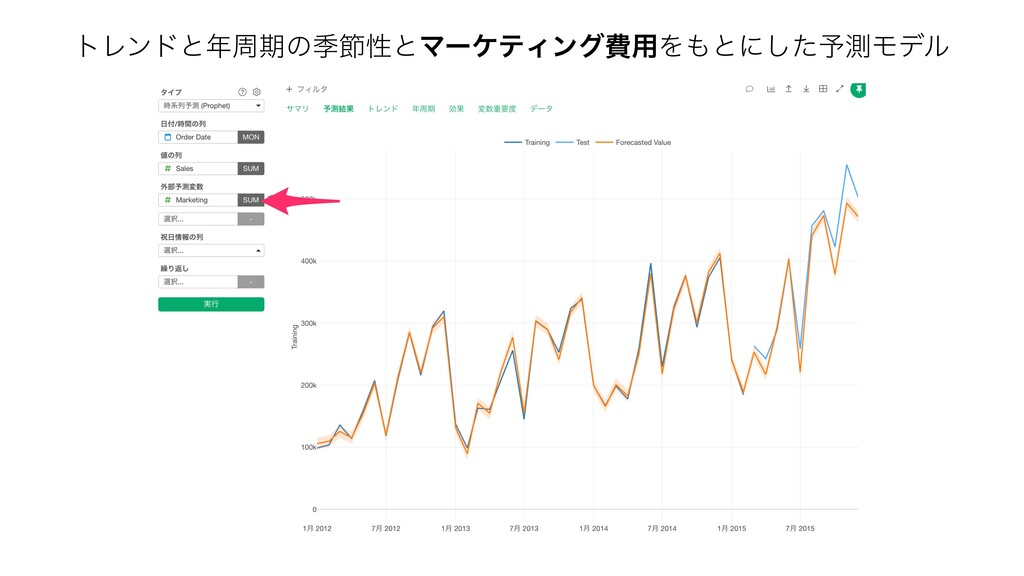
τϨϯυͱपظͷقઅੑͱϚʔέςΟϯάඅ༻Λͱʹͨ͠༧ଌϞσϧ
ϕʔεϞσϧʹച্ใुΛ͚ͨ͠ ϕʔεϞσϧʹϚʔέςΟϯάඅ༻Λ͚ͨ͠
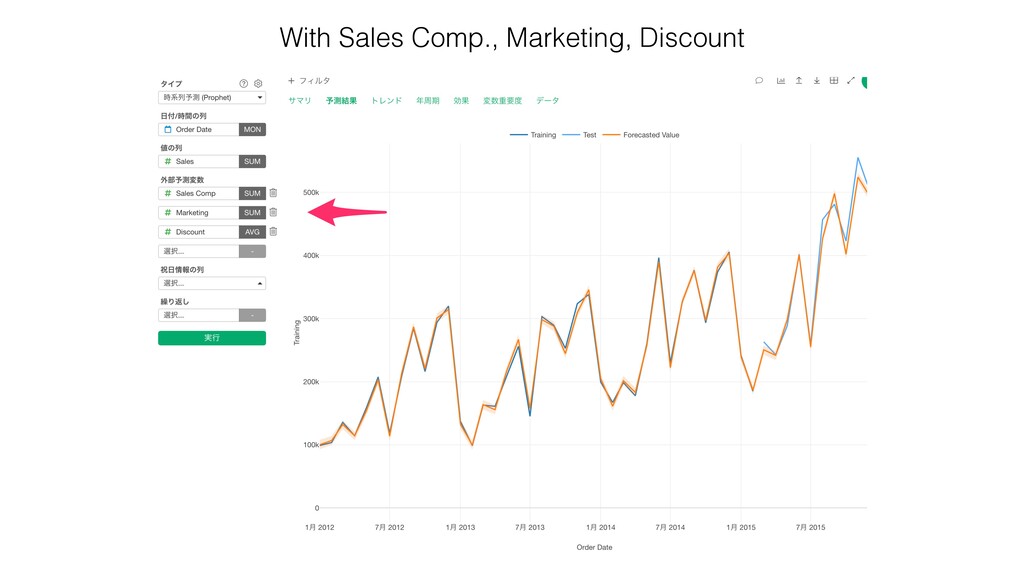
࣍ͷ3ͭશ෦ͯ͠ΈΔ Sales Comp., Marketing, and Discount
With Sales Comp., Marketing, Discount
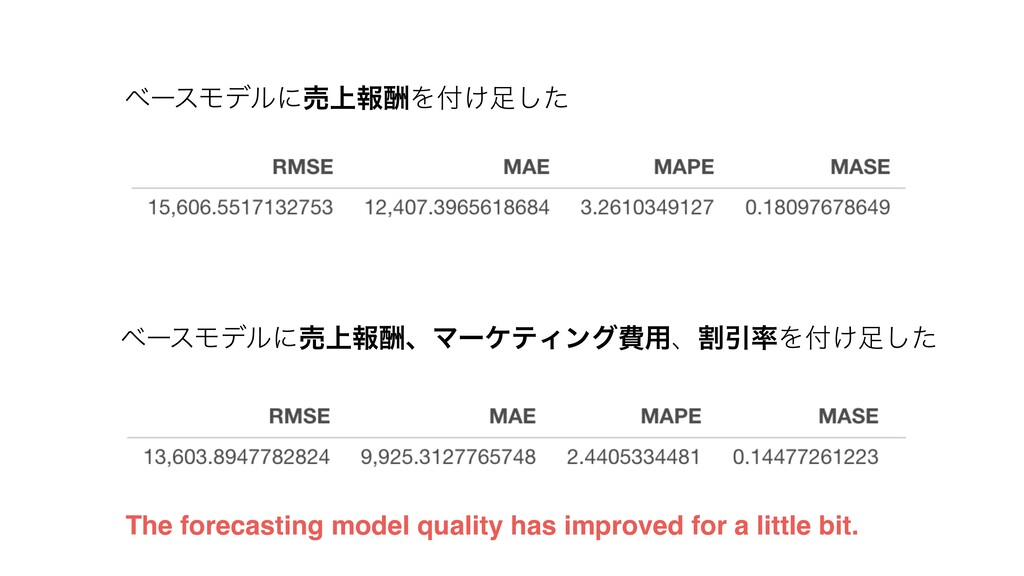
The forecasting model quality has improved for a little bit.
ϕʔεϞσϧʹച্ใुΛ͚ͨ͠ ϕʔεϞσϧʹച্ใुɺϚʔέςΟϯάඅ༻ɺׂҾΛ͚ͨ͠
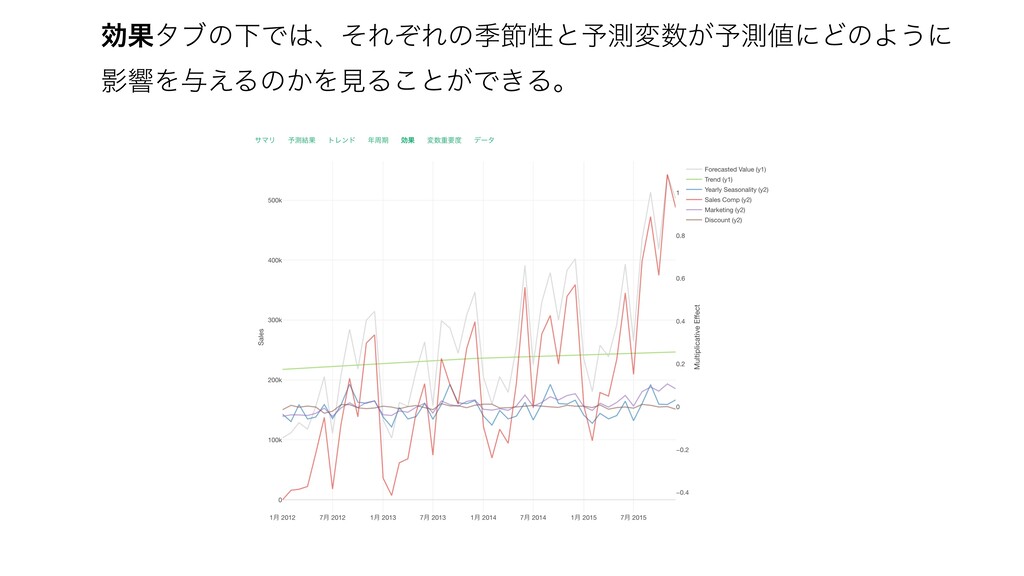
ޮՌλϒͷԼͰɺͦΕͧΕͷقઅੑͱ༧ଌม͕༧ଌʹͲͷΑ͏ʹ ӨڹΛ༩͑Δͷ͔ΛݟΔ͜ͱ͕Ͱ͖Δɻ
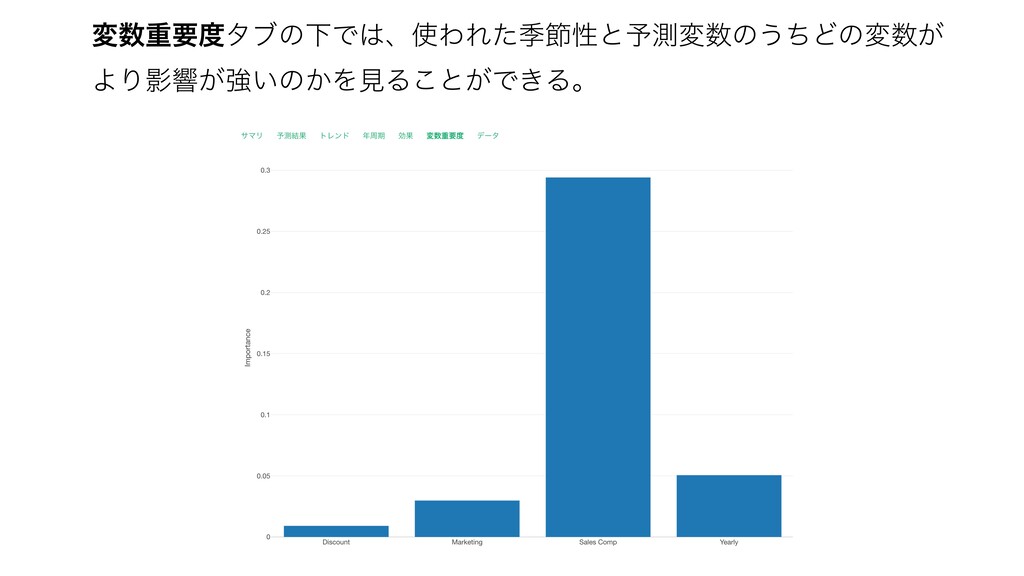
มॏཁλϒͷԼͰɺΘΕͨقઅੑͱ༧ଌมͷ͏ͪͲͷม͕ ΑΓӨڹ͕ڧ͍ͷ͔ΛݟΔ͜ͱ͕Ͱ͖Δɻ
Q & A
࣍ճηϛφʔ
σʔλαΠΤϯε X 3/5 () 1PM (ຊ࣌ؒʣ
None
5݄։࠵ܾఆʂ ฏ൛ɿ26ʢՐʣɺ27ʢਫʣɺ28ʢʣ ि൛ɿ23ʢʣɺ24ʢʣɺ30ʢʣ
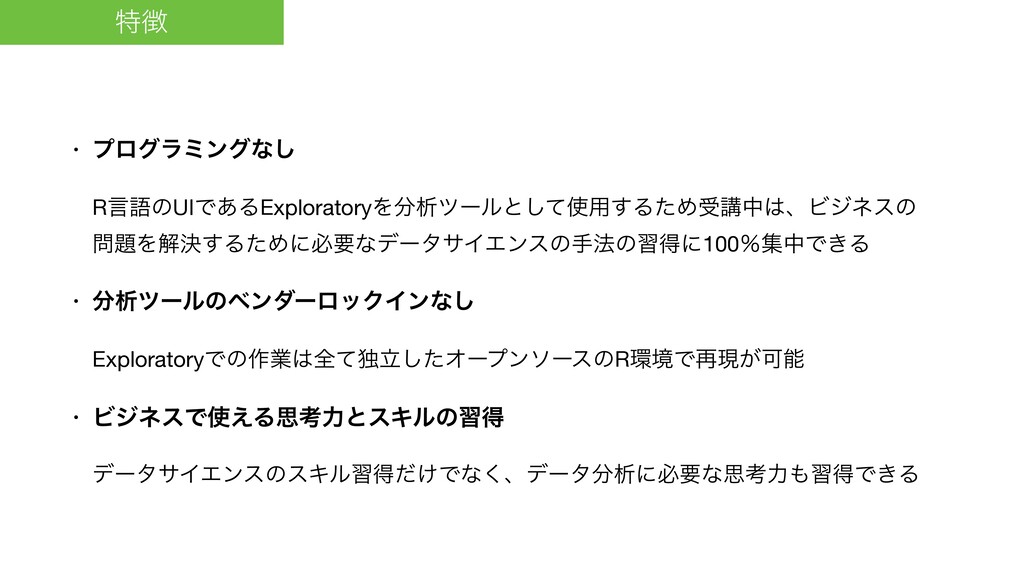
• ϓϩάϥϛϯάͳ͠ RݴޠͷUIͰ͋ΔExploratoryΛੳπʔϧͱͯ͠༻͢ΔͨΊडߨதɺϏδωεͷ Λղܾ͢ΔͨΊʹඞཁͳσʔλαΠΤϯεͷख๏ͷशಘʹ100ˋूதͰ͖Δ • ੳπʔϧͷϕϯμʔϩοΫΠϯͳ͠ ExploratoryͰͷ࡞ۀશͯಠཱͨ͠ΦʔϓϯιʔεͷRڥͰ࠶ݱ͕Մೳ • ϏδωεͰ͑ΔࢥߟྗͱεΩϧͷशಘ σʔλαΠΤϯεͷεΩϧशಘ͚ͩͰͳ͘ɺσʔλੳʹඞཁͳࢥߟྗशಘͰ͖Δ
ಛ
࿈བྷઌ ϝʔϧ
[email protected]
ΣϒαΠτ https://ja.exploratory.io ϒʔτΩϟϯϓɾτϨʔχϯά https://ja.exploratory.io/training-jp Twitter @KanAugust
![࿈བྷઌ ϝʔϧ [email protected] ΣϒαΠτ https://ja.exploratory.io ϒʔτΩϟϯϓɾτϨʔχϯά https://ja.exploratory.io/training-jp Twitter @KanAugust](https://files.speakerdeck.com/presentations/3496d42d39594a3e848a236a9930c349/slide_129.jpg)