about Data 2 Potted History of Monitoring 3 Performance Visualization Basics 4 Monitored Data are Time Series 5 Performance Visualization in R 6 Possible Hacks c 2013 Performance Dynamics Mo e Than Monitoring March 28, 2013 2 / 47
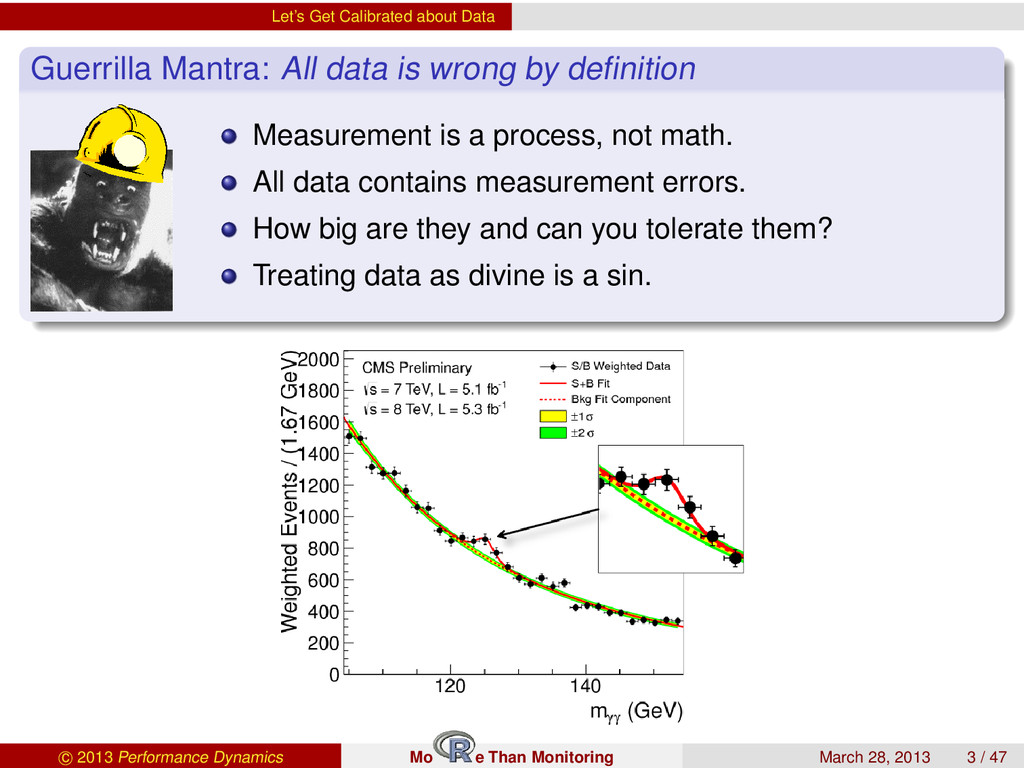
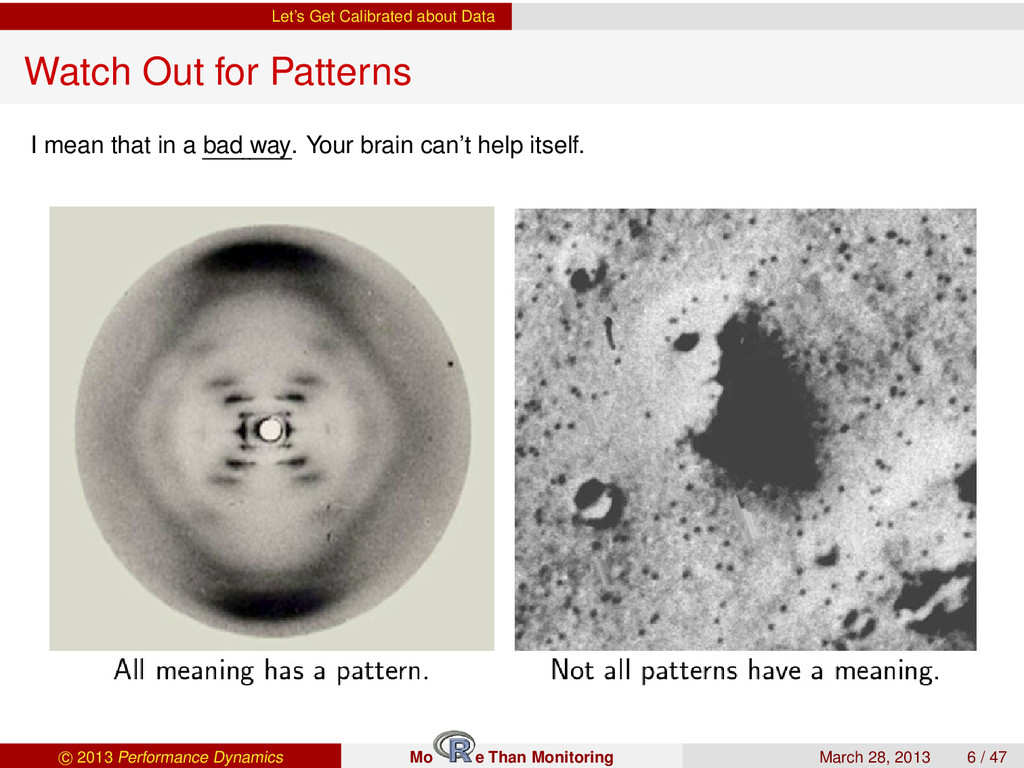
wrong by definition Measurement is a process, not math. All data contains measurement errors. How big are they and can you tolerate them? Treating data as divine is a sin. c 2013 Performance Dynamics Mo e Than Monitoring March 28, 2013 3 / 47
wrong by definition Measurement is a process, not math. All data contains measurement errors. How big are they and can you tolerate them? Treating data as divine is a sin. c 2013 Performance Dynamics Mo e Than Monitoring March 28, 2013 3 / 47
3 performance metrics 1 Time, e.g., cpu_ticks 2 Rate (inverse time), e.g., httpGets/s, 3 Number or count, e.g., RSS c 2013 Performance Dynamics Mo e Than Monitoring March 28, 2013 5 / 47
3 performance metrics 1 Time, e.g., cpu_ticks 2 Rate (inverse time), e.g., httpGets/s, 3 Number or count, e.g., RSS c 2013 Performance Dynamics Mo e Than Monitoring March 28, 2013 5 / 47
Data 2 Potted History of Monitoring 3 Performance Visualization Basics 4 Monitored Data are Time Series 5 Performance Visualization in R 6 Possible Hacks c 2013 Performance Dynamics Mo e Than Monitoring March 28, 2013 7 / 47
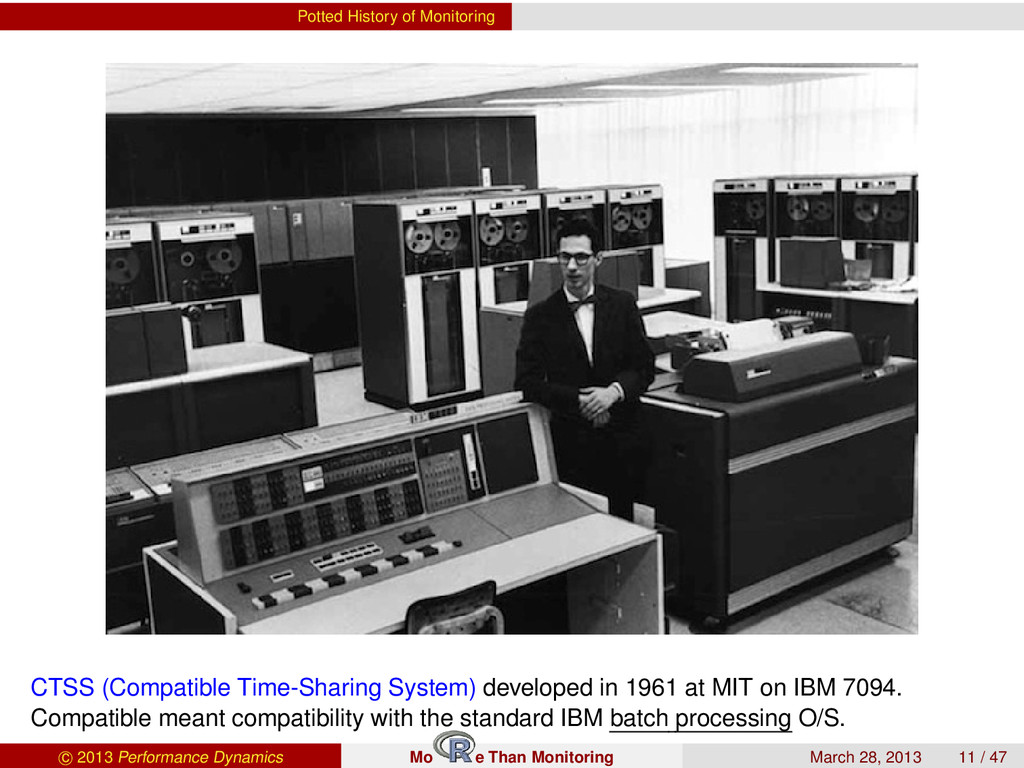
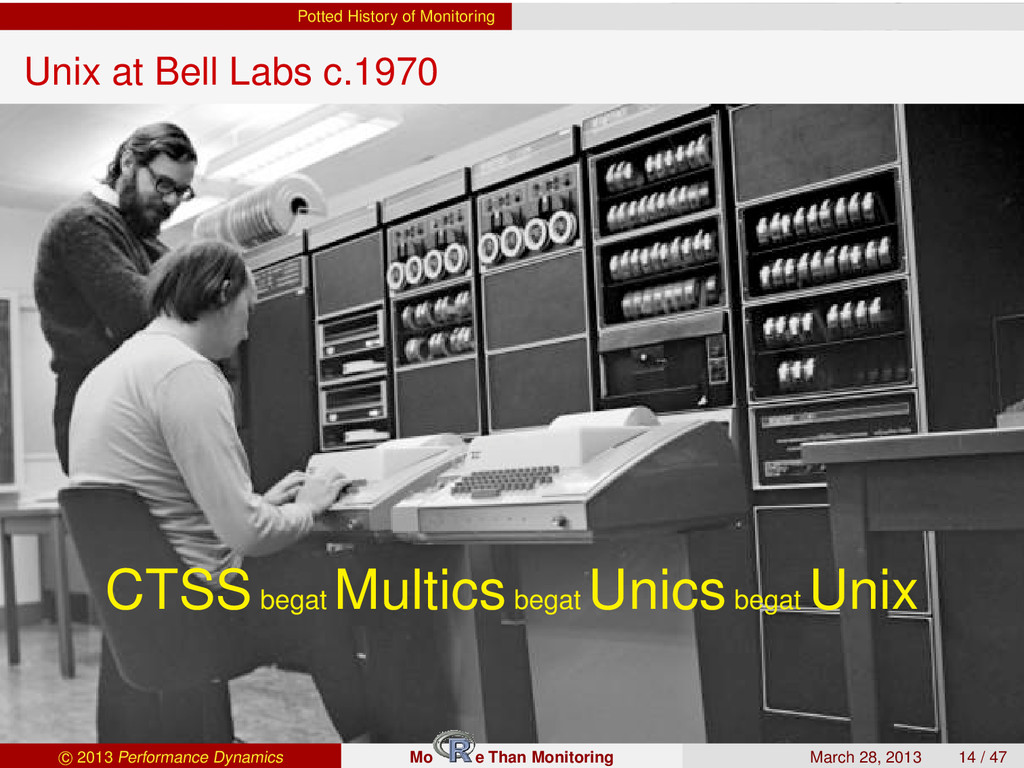
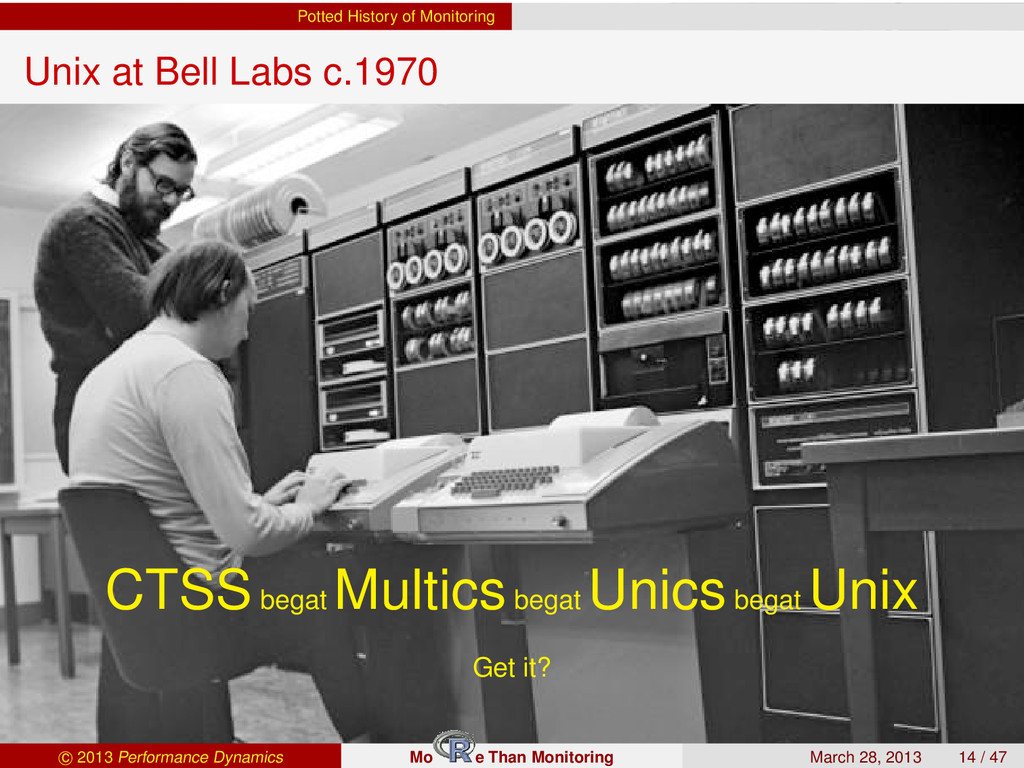
1961 at MIT on IBM 7094. Compatible meant compatibility with the standard IBM batch processing O/S. c 2013 Performance Dynamics Mo e Than Monitoring March 28, 2013 11 / 47
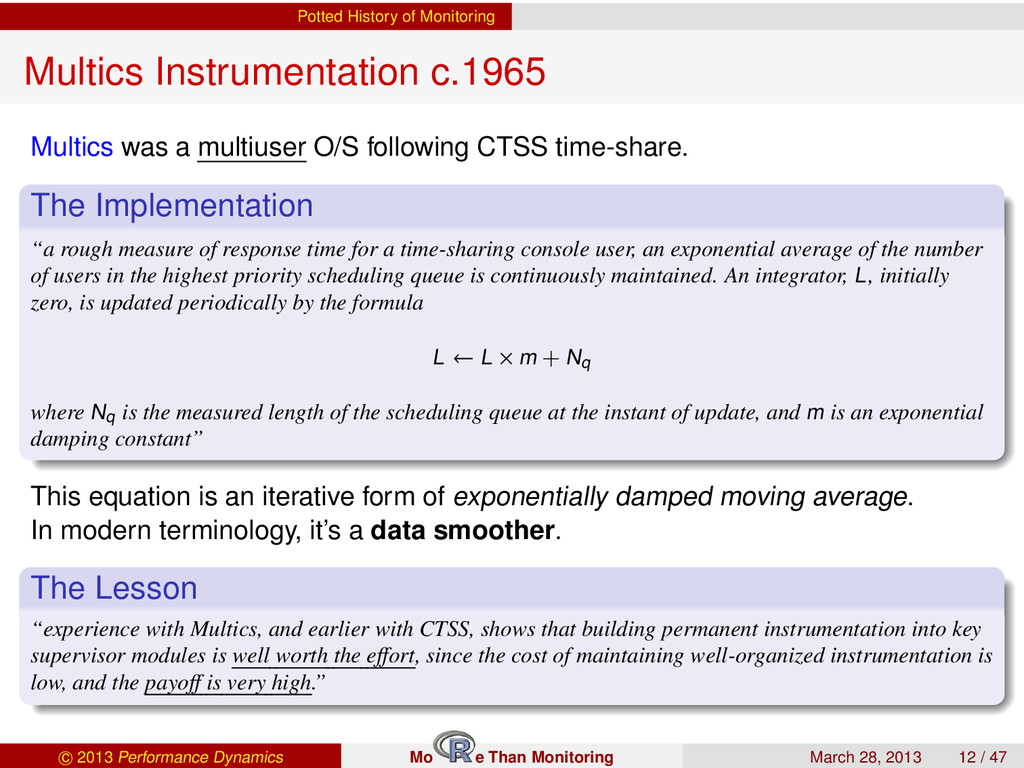
multiuser O/S following CTSS time-share. The Implementation “a rough measure of response time for a time-sharing console user, an exponential average of the number of users in the highest priority scheduling queue is continuously maintained. An integrator, L, initially zero, is updated periodically by the formula L ← L × m + Nq where Nq is the measured length of the scheduling queue at the instant of update, and m is an exponential damping constant” This equation is an iterative form of exponentially damped moving average. In modern terminology, it’s a data smoother. The Lesson “experience with Multics, and earlier with CTSS, shows that building permanent instrumentation into key supervisor modules is well worth the effort, since the cost of maintaining well-organized instrumentation is low, and the payoff is very high.” c 2013 Performance Dynamics Mo e Than Monitoring March 28, 2013 12 / 47
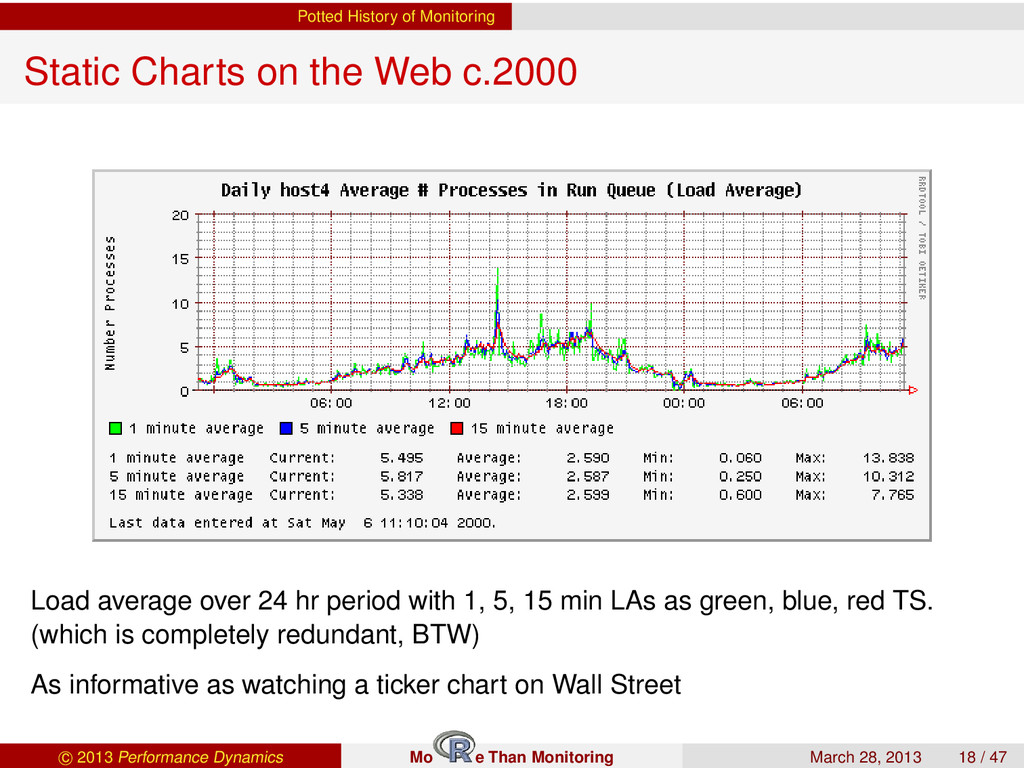
Load average over 24 hr period with 1, 5, 15 min LAs as green, blue, red TS. (which is completely redundant, BTW) As informative as watching a ticker chart on Wall Street c 2013 Performance Dynamics Mo e Than Monitoring March 28, 2013 18 / 47
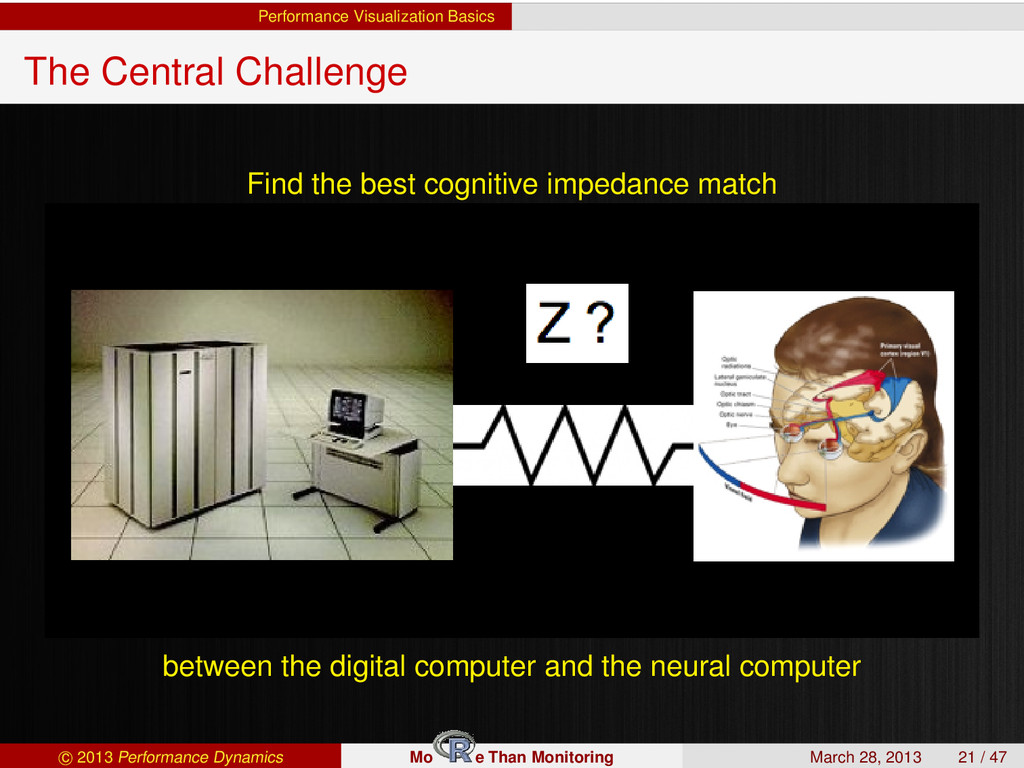
2 Potted History of Monitoring 3 Performance Visualization Basics 4 Monitored Data are Time Series 5 Performance Visualization in R 6 Possible Hacks c 2013 Performance Dynamics Mo e Than Monitoring March 28, 2013 20 / 47
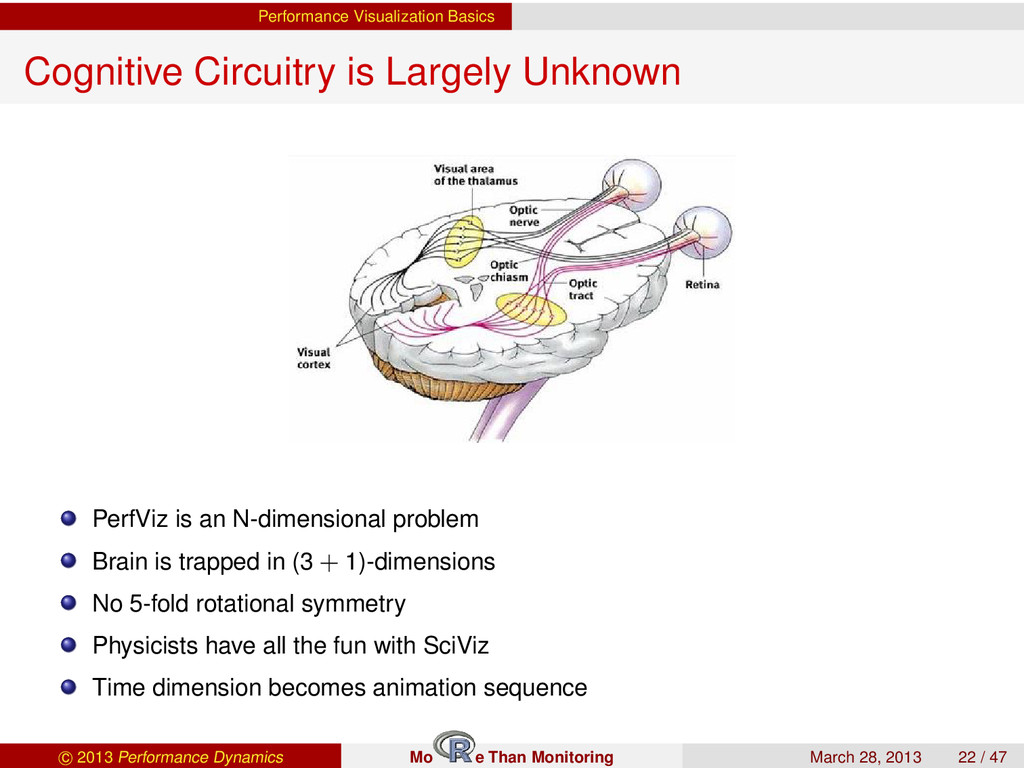
an N-dimensional problem Brain is trapped in (3 + 1)-dimensions No 5-fold rotational symmetry Physicists have all the fun with SciViz Time dimension becomes animation sequence c 2013 Performance Dynamics Mo e Than Monitoring March 28, 2013 22 / 47
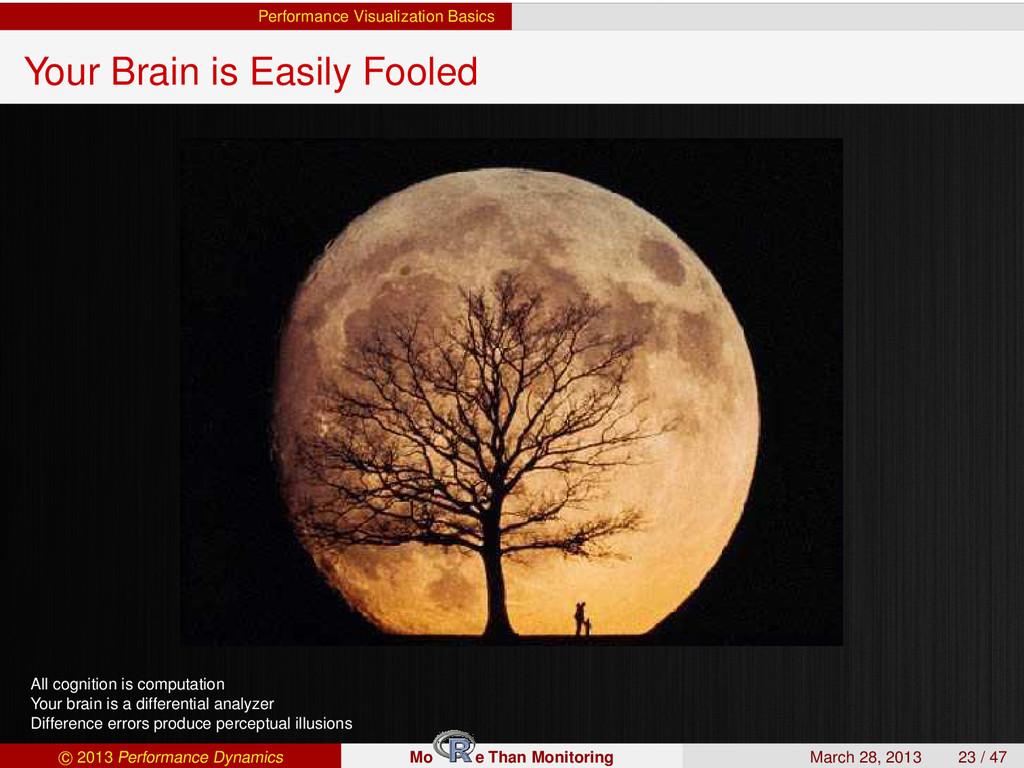
is computation Your brain is a differential analyzer Difference errors produce perceptual illusions c 2013 Performance Dynamics Mo e Than Monitoring March 28, 2013 23 / 47
about Data 2 Potted History of Monitoring 3 Performance Visualization Basics 4 Monitored Data are Time Series 5 Performance Visualization in R 6 Possible Hacks c 2013 Performance Dynamics Mo e Than Monitoring March 28, 2013 24 / 47
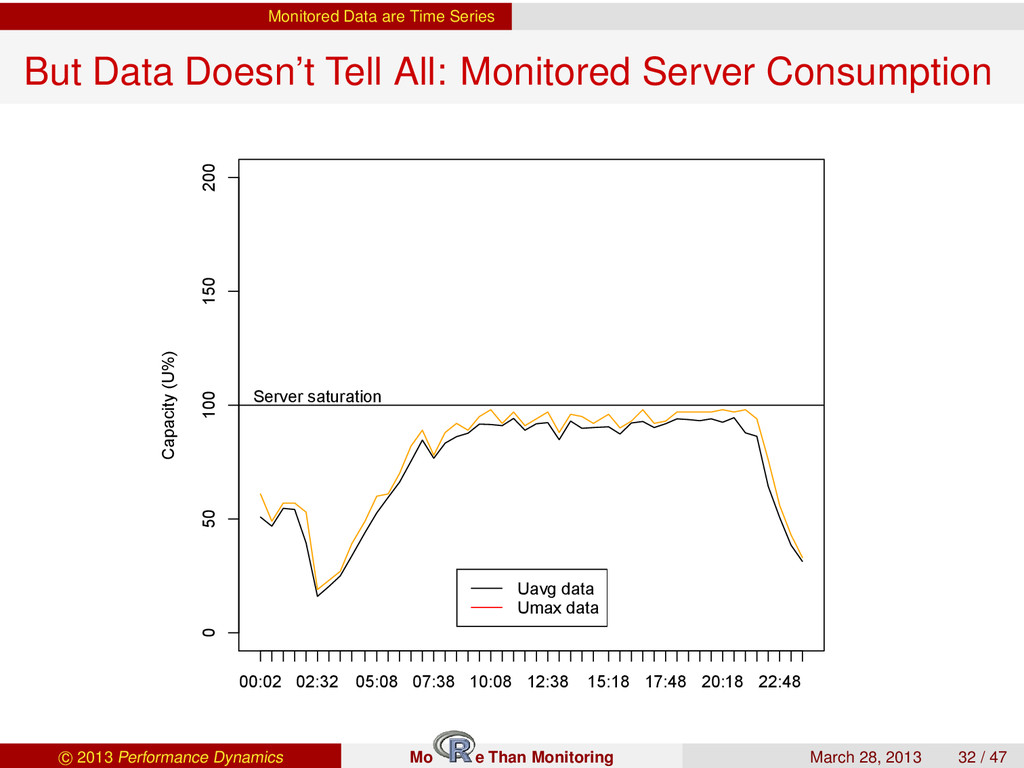
Monitored Server Consumption 0 50 100 150 200 Time (m:s) Capacity (U%) 00:02 02:32 05:08 07:38 10:08 12:38 15:18 17:48 20:18 22:48 Server saturation Uavg data Umax data Monitored Server Consumption c 2013 Performance Dynamics Mo e Than Monitoring March 28, 2013 32 / 47
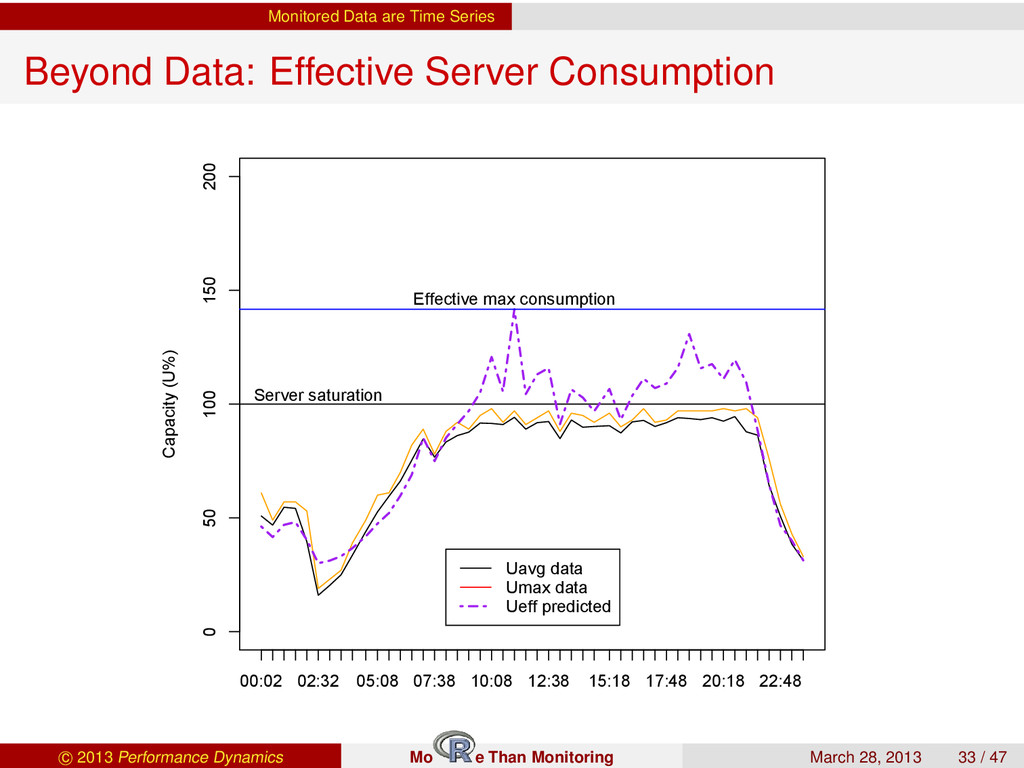
0 50 100 150 200 Time (m:s) Capacity (U%) 00:02 02:32 05:08 07:38 10:08 12:38 15:18 17:48 20:18 22:48 Effective max consumption Server saturation Uavg data Umax data Ueff predicted Lookahead Server Consumption c 2013 Performance Dynamics Mo e Than Monitoring March 28, 2013 33 / 47
Data 2 Potted History of Monitoring 3 Performance Visualization Basics 4 Monitored Data are Time Series 5 Performance Visualization in R 6 Possible Hacks c 2013 Performance Dynamics Mo e Than Monitoring March 28, 2013 34 / 47
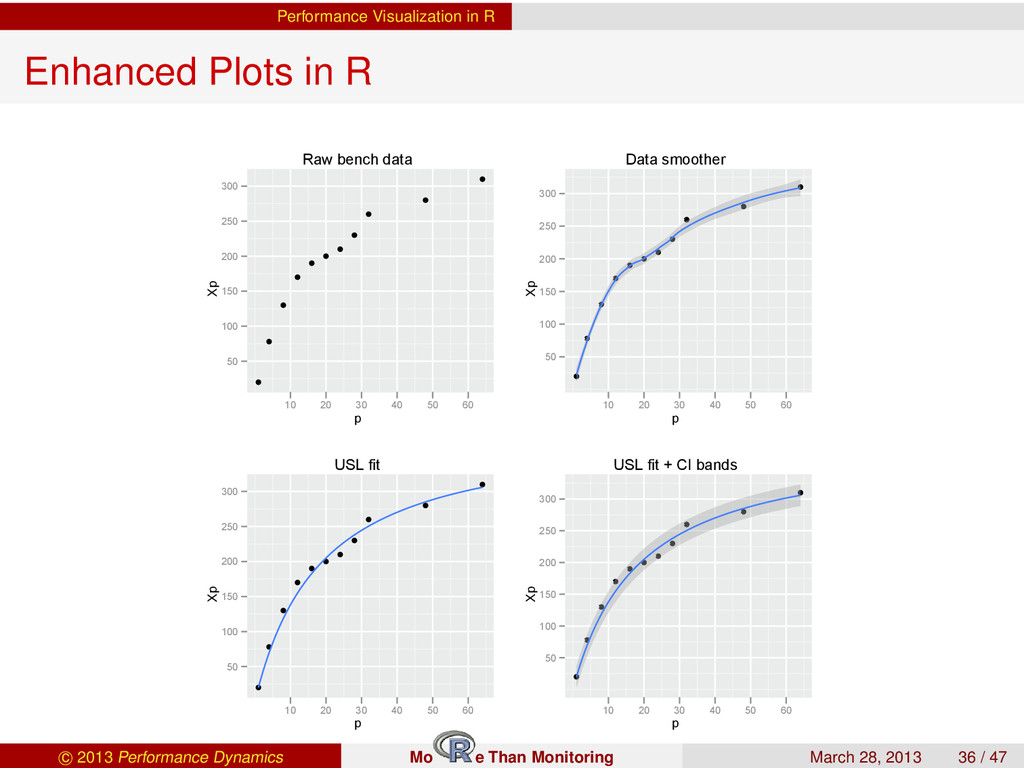
data p Xp 50 100 150 200 250 300 10 20 30 40 50 60 Data smoother p Xp 50 100 150 200 250 300 10 20 30 40 50 60 USL fit p Xp 50 100 150 200 250 300 10 20 30 40 50 60 USL fit + CI bands p Xp 50 100 150 200 250 300 10 20 30 40 50 60 c 2013 Performance Dynamics Mo e Than Monitoring March 28, 2013 36 / 47
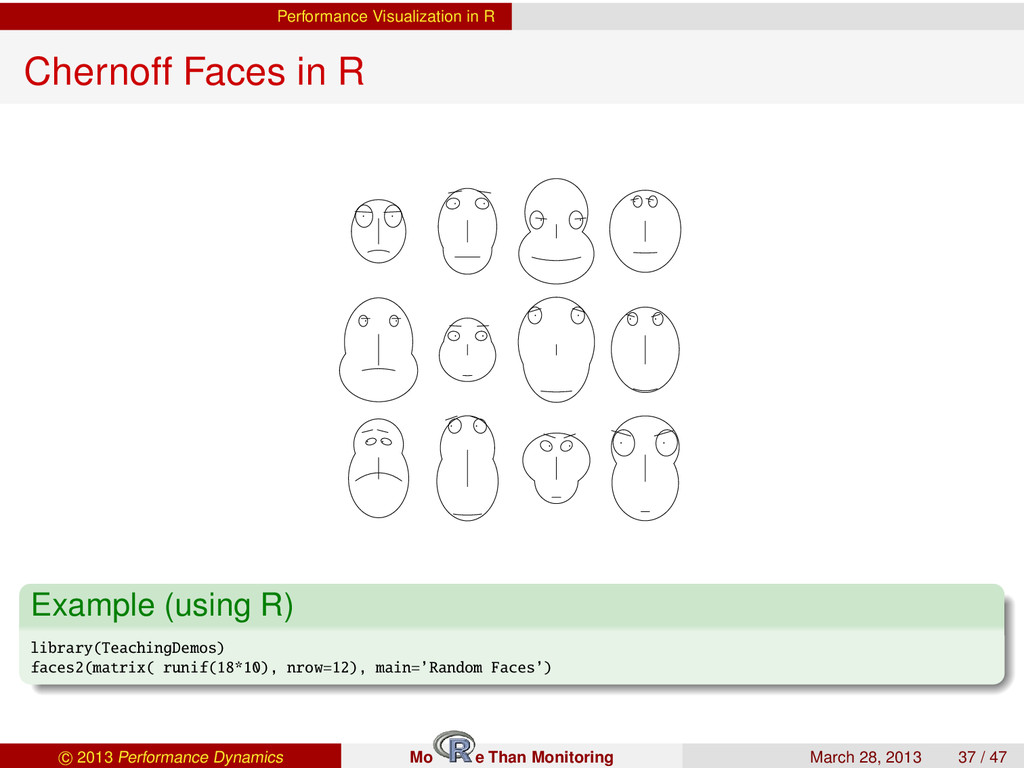
R) library(TeachingDemos) faces2(matrix( runif(18*10), nrow=12), main=’Random Faces’) c 2013 Performance Dynamics Mo e Than Monitoring March 28, 2013 37 / 47
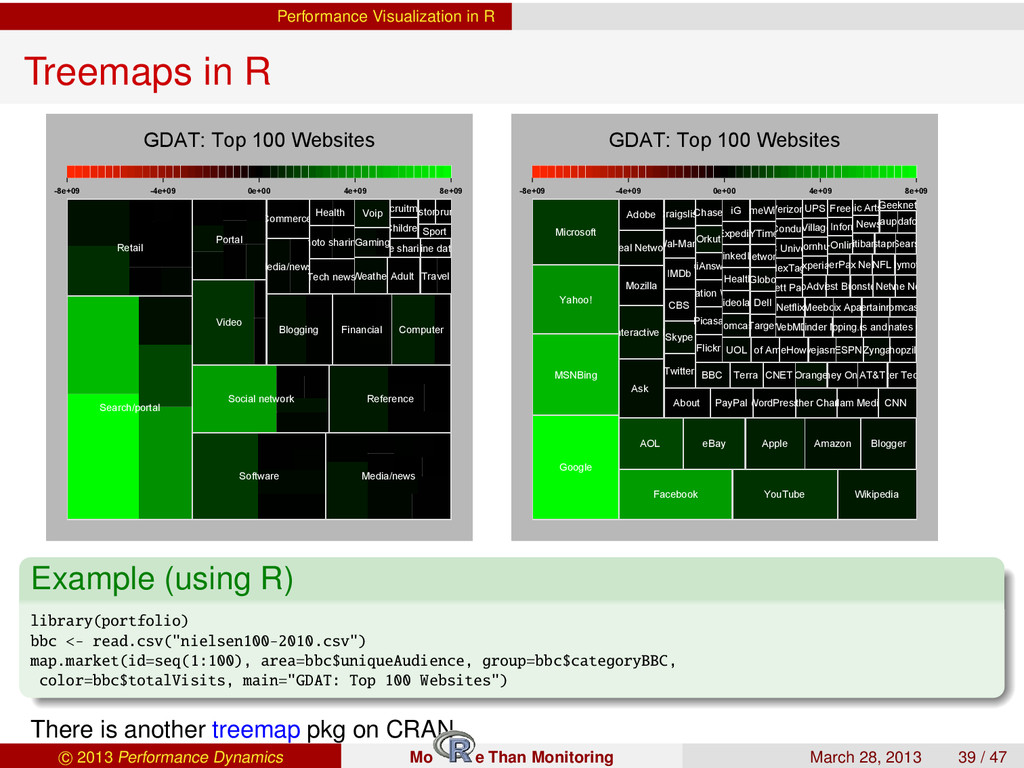
Websites -8e+09 -4e+09 0e+00 4e+09 8e+09 Search/portal Retail Software Media/news Social network Reference Video Portal Blogging Financial Computer Media/news Commerce Tech news Photo sharing Health WeatherAdult Travel Gaming Voip File sharing Online dating Children Recruitment Sport File storage Forum GDAT: Top 100 Websites -8e+09 -4e+09 0e+00 4e+09 8e+09 Google MSNBing Yahoo! Microsoft Facebook YouTube Wikipedia AOL eBay Apple Amazon Blogger Ask Fox Interactive Media Mozilla Real Network Adobe About PayPalWordPress Weather Channel Glam MediaCNN Twitter Skype CBS IMDb Wal-Mart Craigslist BBC Terra CNETOrange Disney Online AT&T NetShelter Technology Flickr Picasa Gorilla Nation Websites WikiAnswers Orkut Chase UOL Bank of America eHow Livejasmin ESPN Zynga Shopzilla Comcast Videolan Everyday Health Network LinkedIn Expedia iG Target Dell Globo Scripps Networks Digital NYTimes LimeWire WebMD FriendFinder Network Shopping.com Nickelodeon Kids and Family Network Classmates Online NetflixMeebo Six Apart Turner Sports & Entertainment Digital Network Comcast Hewlett Packard NexTag NBC Universal Conduit Verizon TripAdvisor Best Buy Monster RTL Network Priceline Network Experian Pornhub iVillage UPS SuperPages Fox News NFL Dailymotion T-Online Reed Business Information Network Free Citibank Vistaprint Sears Tribune Newspapers Electronic Arts Online Megaupload Vodafone Geeknet Example (using R) library(portfolio) bbc <- read.csv("nielsen100-2010.csv") map.market(id=seq(1:100), area=bbc$uniqueAudience, group=bbc$categoryBBC, color=bbc$totalVisits, main="GDAT: Top 100 Websites") There is another treemap pkg on CRAN c 2013 Performance Dynamics Mo e Than Monitoring March 28, 2013 39 / 47
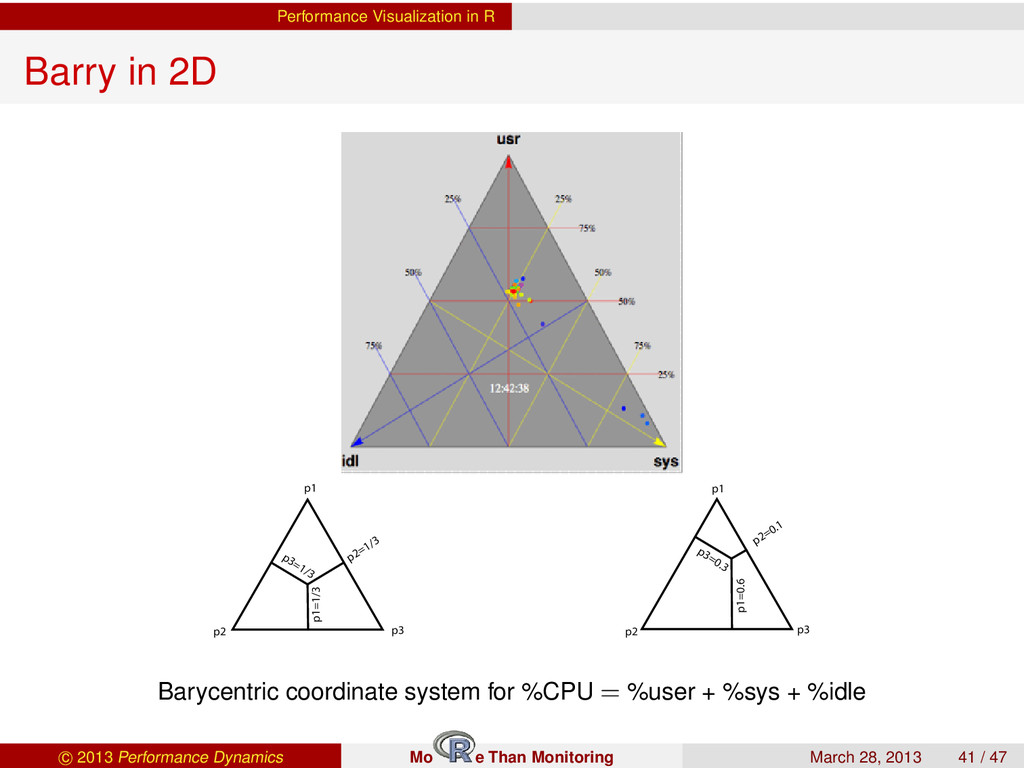
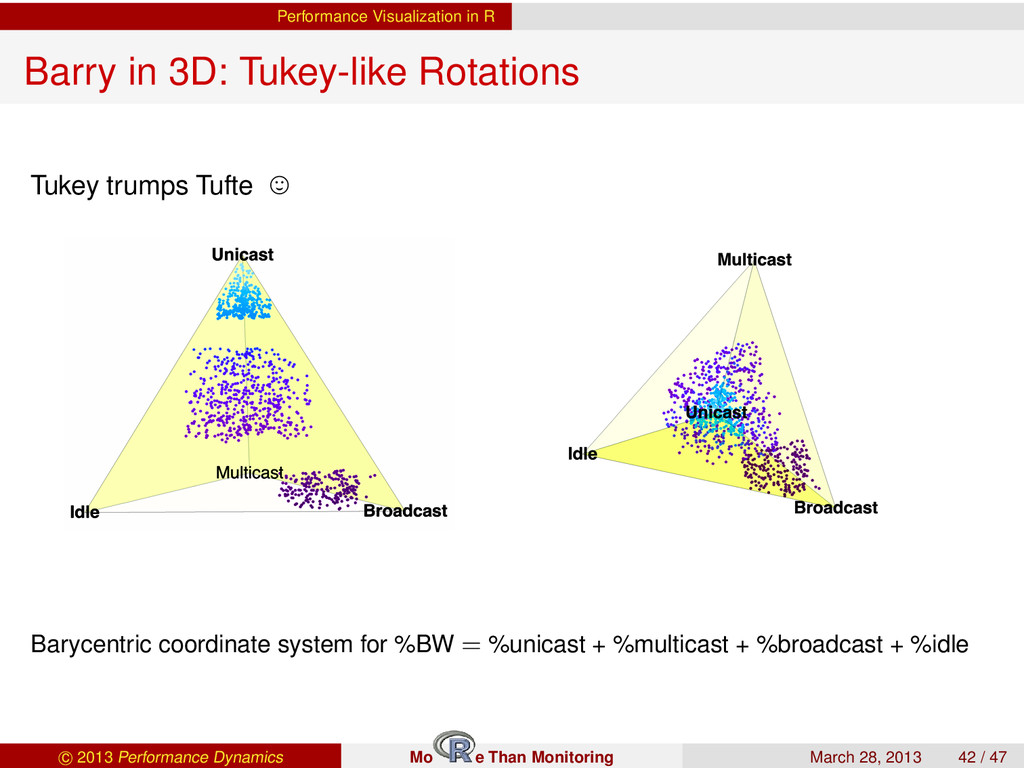
trumps Tufte Barycentric coordinate system for %BW = %unicast + %multicast + %broadcast + %idle c 2013 Performance Dynamics Mo e Than Monitoring March 28, 2013 42 / 47
Potted History of Monitoring 3 Performance Visualization Basics 4 Monitored Data are Time Series 5 Performance Visualization in R 6 Possible Hacks c 2013 Performance Dynamics Mo e Than Monitoring March 28, 2013 43 / 47
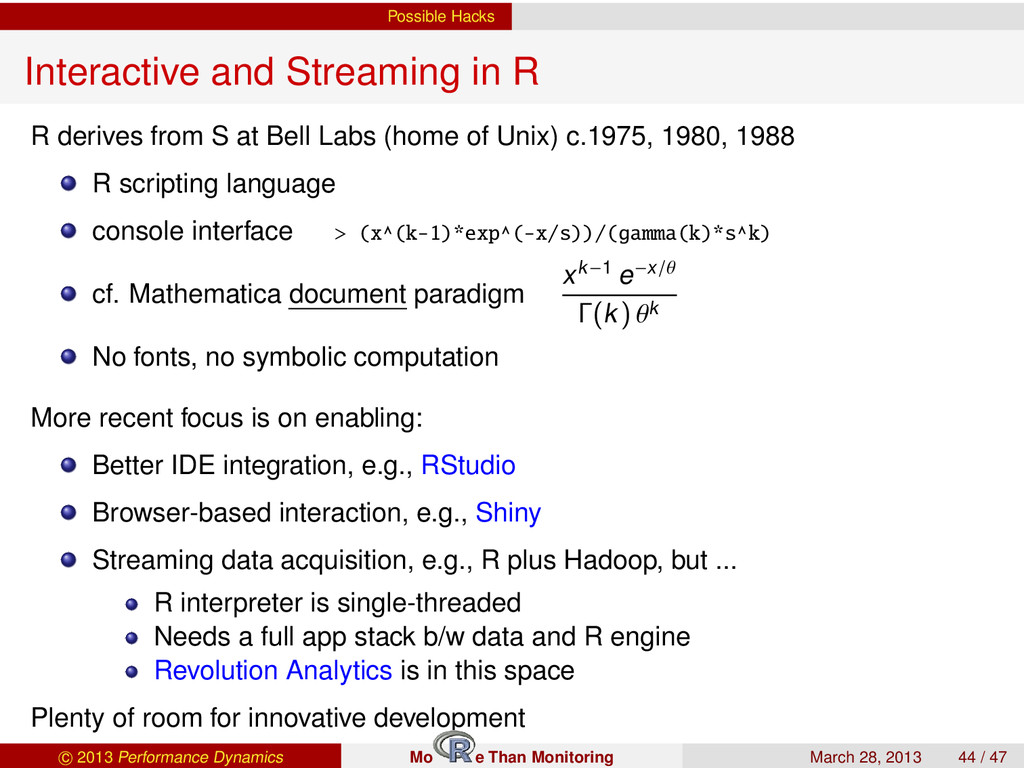
S at Bell Labs (home of Unix) c.1975, 1980, 1988 R scripting language console interface > (x^(k-1)*exp^(-x/s))/(gamma(k)*s^k) cf. Mathematica document paradigm xk−1 e−x/θ Γ(k) θk No fonts, no symbolic computation More recent focus is on enabling: Better IDE integration, e.g., RStudio Browser-based interaction, e.g., Shiny Streaming data acquisition, e.g., R plus Hadoop, but ... R interpreter is single-threaded Needs a full app stack b/w data and R engine Revolution Analytics is in this space Plenty of room for innovative development c 2013 Performance Dynamics Mo e Than Monitoring March 28, 2013 44 / 47
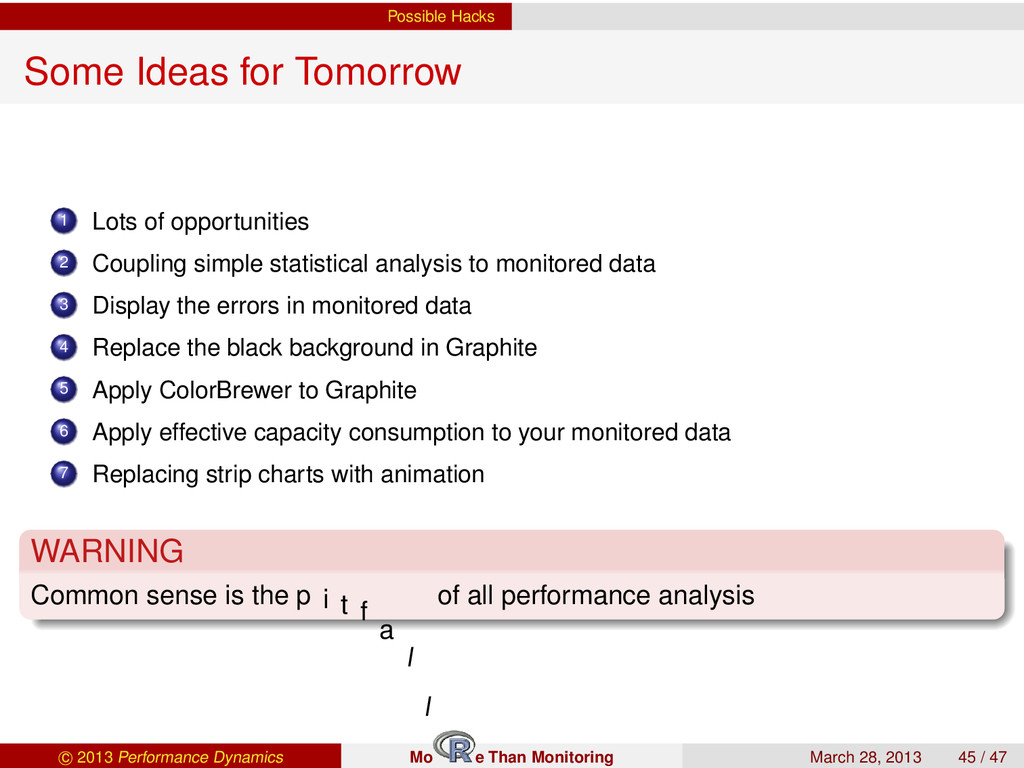
2 Coupling simple statistical analysis to monitored data 3 Display the errors in monitored data 4 Replace the black background in Graphite 5 Apply ColorBrewer to Graphite 6 Apply effective capacity consumption to your monitored data 7 Replacing strip charts with animation WARNING Common sense is the p i t f a l l of all performance analysis c 2013 Performance Dynamics Mo e Than Monitoring March 28, 2013 45 / 47
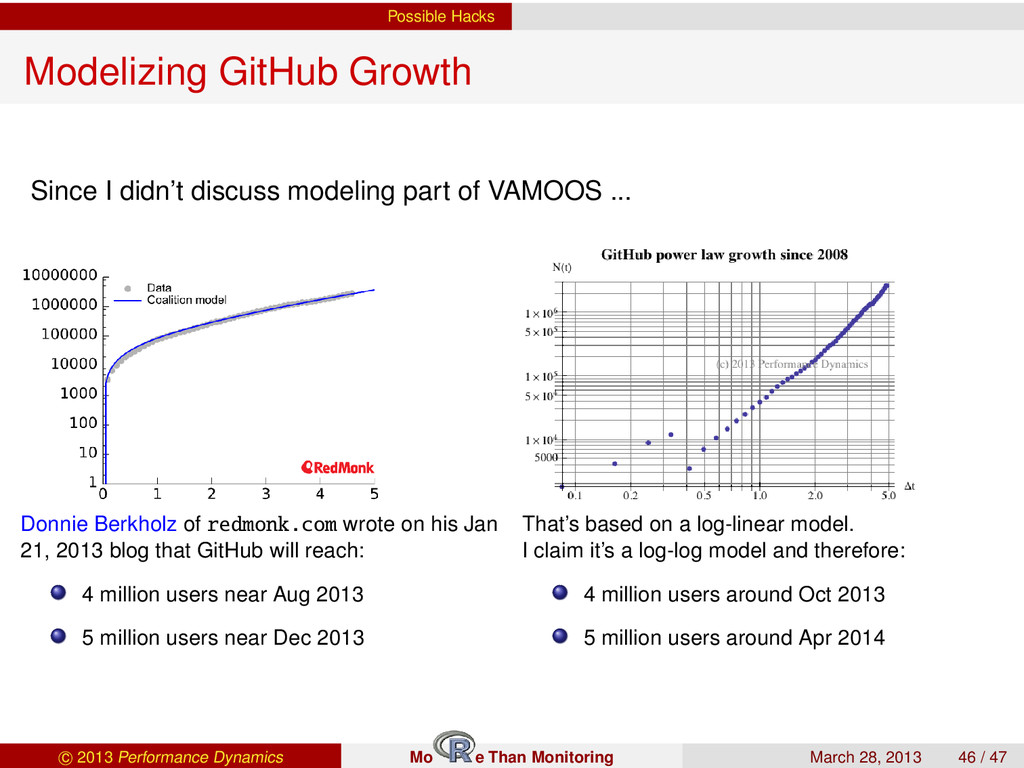
part of VAMOOS ... Donnie Berkholz of redmonk.com wrote on his Jan 21, 2013 blog that GitHub will reach: 4 million users near Aug 2013 5 million users near Dec 2013 That’s based on a log-linear model. I claim it’s a log-log model and therefore: 4 million users around Oct 2013 5 million users around Apr 2014 c 2013 Performance Dynamics Mo e Than Monitoring March 28, 2013 46 / 47