General concepts → Before a marker is routinely used in practice its ability to distinguish between diseased and non-diseased states must be rigorously assessed. → We assume the existence of a gold standard, that is, a marker/procedure/test that perfectly classifies the individuals as diseased and non-diseased. → Compared to the truth one wants to know how well the marker being evaluated performs. Vanda Inácio (UoE) BNP Youden Index Regression July 3, 2017 2 / 21
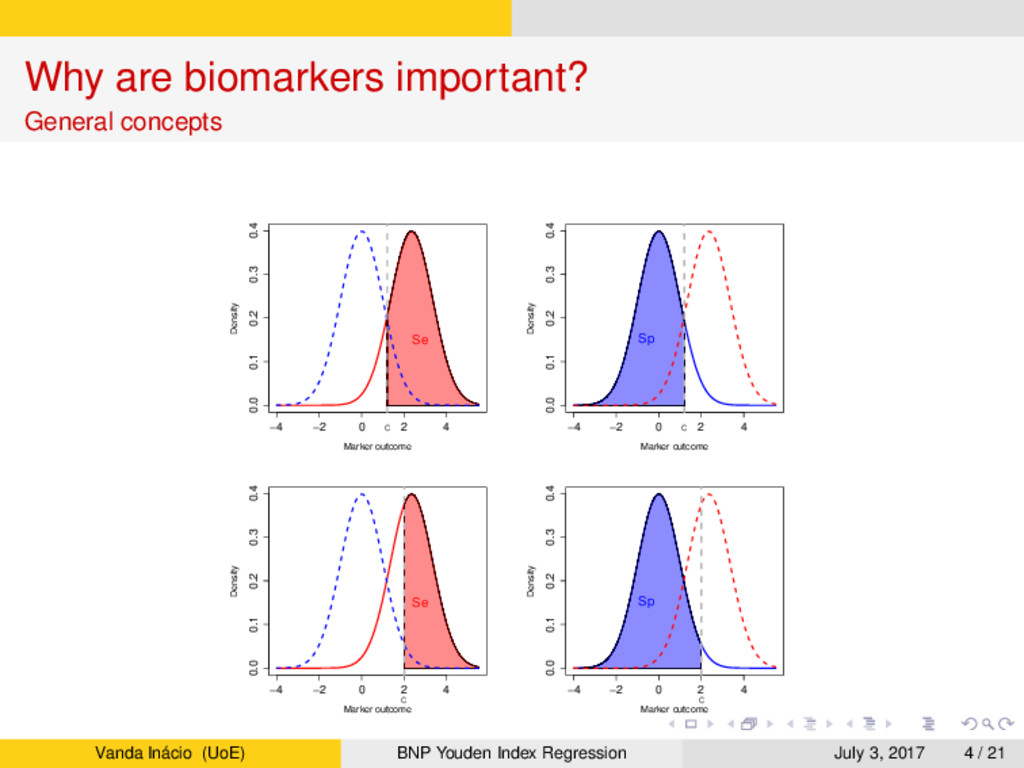
General concepts → Let Y0 and Y1 be two independent continuous random variables denoting the marker outcomes in the non-diseased and diseased populations, with CDF F0 and F1, respectively. → Further, let c be a cutoff for defining a positive marker result. → Without loss of generality, we proceed with the assumption that a subject is classified as diseased when the marker outcome is greater or equal than c and as non-diseased when it is below c. → Then, for each cutoff value c, the accuracy of the marker can be summarized by its sensitivity (Se) and specificity (Sp) Se(c) = Pr(Y1 ≥ c) = 1 − F1(c), Sp(c) = Pr(Y0 < c) = F0(c). → Obviously, for each cutoff value c we obtain a different sensitivity and specificity. Vanda Inácio (UoE) BNP Youden Index Regression July 3, 2017 3 / 21
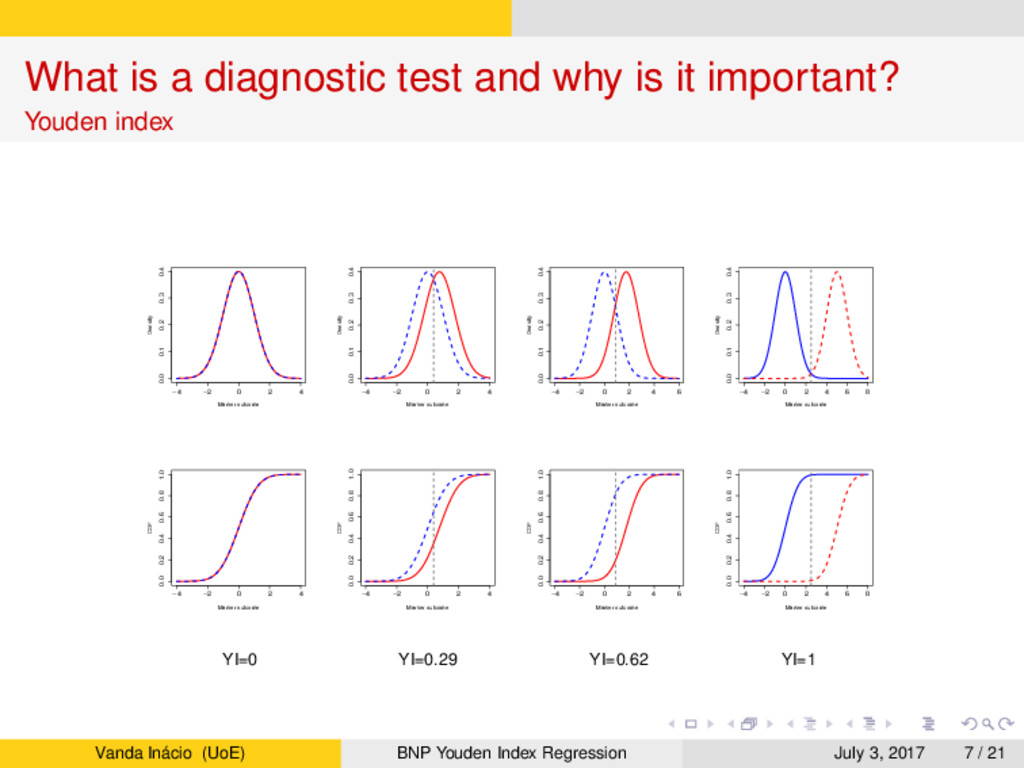
Youden index → A commonly used global summary measure of diagnostic accuracy is the Youden index (Youden, 1950), which is defined as YI = max c∈R {Se(c) + Sp(c) − 1} = max c∈R {F0(c) − F1(c)}. → The YI ranges from 0 to 1: → YI = 0 corresponds to complete overlap of the data distributions for the D = 0 and D = 1 populations (i.e., F0(c) = F1(c), for all c). → YI = 1 when the data distributions are completely separated. → YI between 0 and 1 corresponds to different levels of stochastic ordering between F0 and F1. Vanda Inácio (UoE) BNP Youden Index Regression July 3, 2017 5 / 21
Youden index → In addition to providing a global measure of marker accuracy, YI provides a criterion to select an optimal threshold to screen subjects in clinical practice. → The criterion is to choose the cutoff value for which sensitivity plus specificity is maximized, i.e., c∗ = arg max c∈R {F0(c) − F1(c)}. → The Youden index criterion to select the optimal threshold c∗ is thus based on maximizing the correct classification rate. Vanda Inácio (UoE) BNP Youden Index Regression July 3, 2017 6 / 21
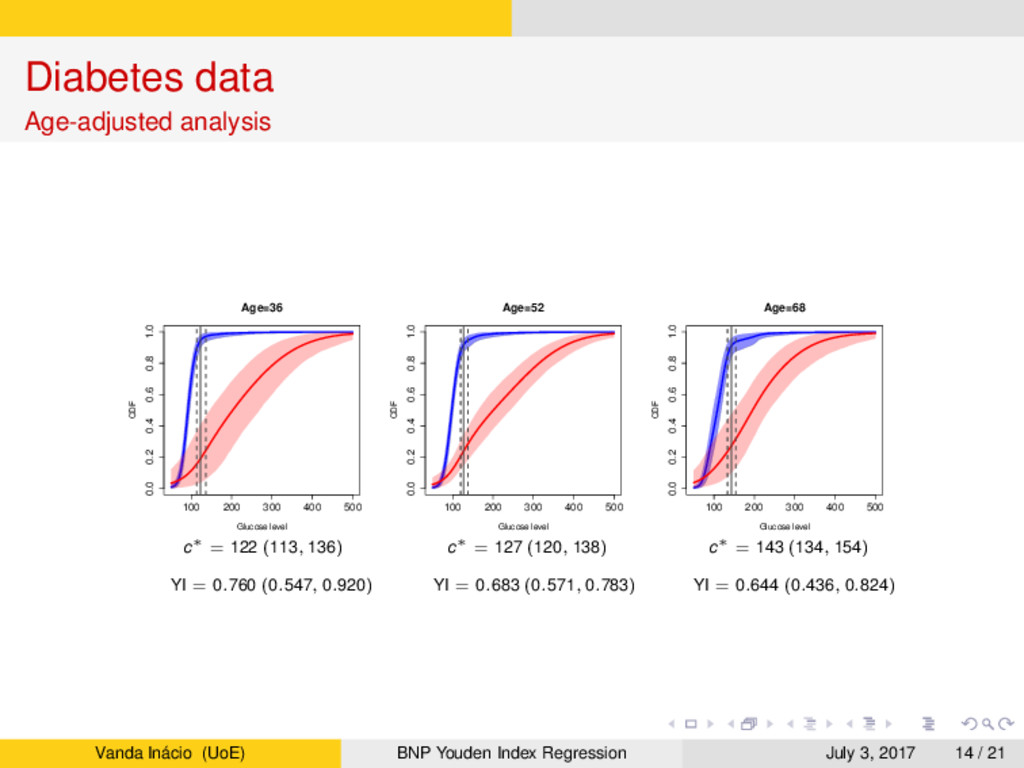
Covariate information → Moreover, recently the interest on the subject has moved beyond determining the basic accuracy of a marker. → It has been recognized that the discriminatory ability of a marker is often affected by patient-specific characteristics, such as age or gender. → In this setting, sensitivity and specificity depend on a covariate vector x so that Se(c | x) = Pr(Y1 > c | x) = 1 − F1(c | x) and Sp(c | x) = F0(c | x). → We thus define the covariate-dependent Youden index and the covariate-dependent optimal cutoff as YI(x) = max c∈R {F0(c | x) − F1(c | x)}, c∗(x) = arg max c∈R {F0(c | x) − F1(c | x)}. Vanda Inácio (UoE) BNP Youden Index Regression July 3, 2017 8 / 21
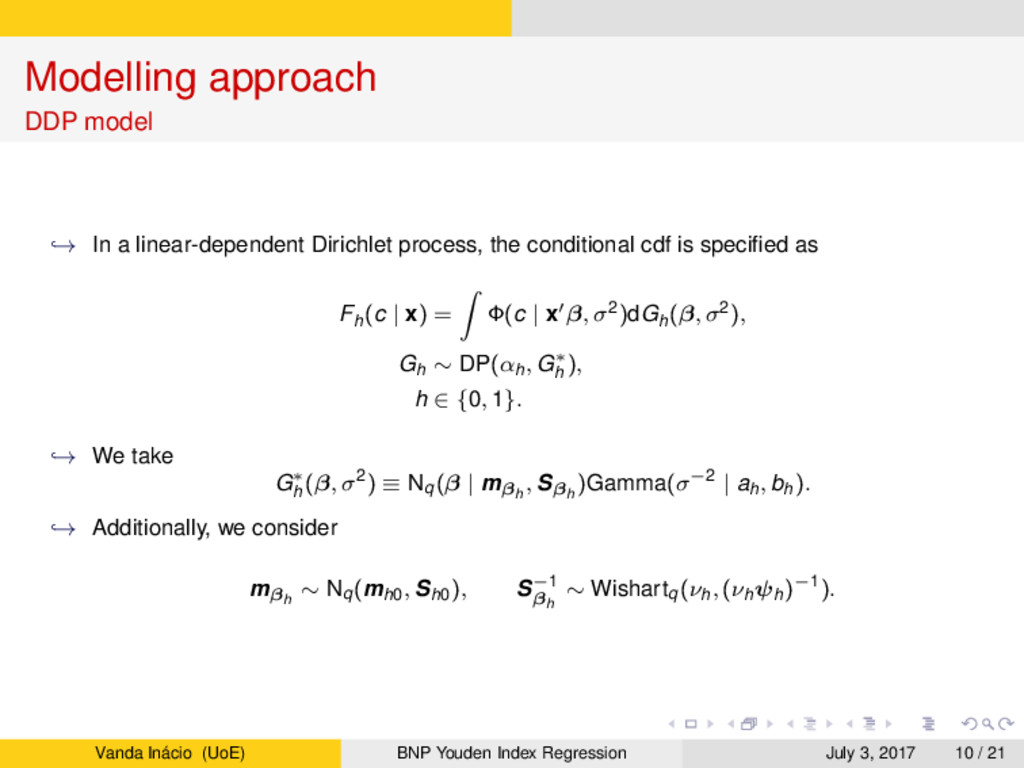
on mixture models induced by a dependent Dirichlet process (DDP), which allows the entire distribution of the marker outcomes, in each population, to smoothly change as a function of covariates. → Let {(x01, Y01), . . . , (x0n0 , Y0n0 )} and {(x11, Y11), . . . , (x1n1 , Y1n1 )} be regression data for the non-diseased and diseased groups. → It is assumed that given the covariates, the marker outcomes in each population are independent and that Y0i | x0i ind ∼ F0(· | x0i ), i = 1, . . . , n0, Y1j | x1j ind ∼ F1(· | x1j ), j = 1, . . . , n1. Vanda Inácio (UoE) BNP Youden Index Regression July 3, 2017 9 / 21
Sethuraman (1994), the conditional cdf can be written as Fh(c | x) = ∞ k=1 ωhk Φ(c | x βhk , σ2 hk ). → The weights follow the so-called stick-breaking construction ωhk = vhk l<k (1 − vhl ), vhk ∼ Beta(1, αh), k = 1, . . . , ∞. → This representation characterises the conditional cdf using an infinite mixture of Gaussian linear models. → The model can also accommodate nonlinearities through the inclusion of B-splines. → Posterior inference is conducted through the blocked Gibbs sampler of Ishwaran and James (2001). Vanda Inácio (UoE) BNP Youden Index Regression July 3, 2017 11 / 21
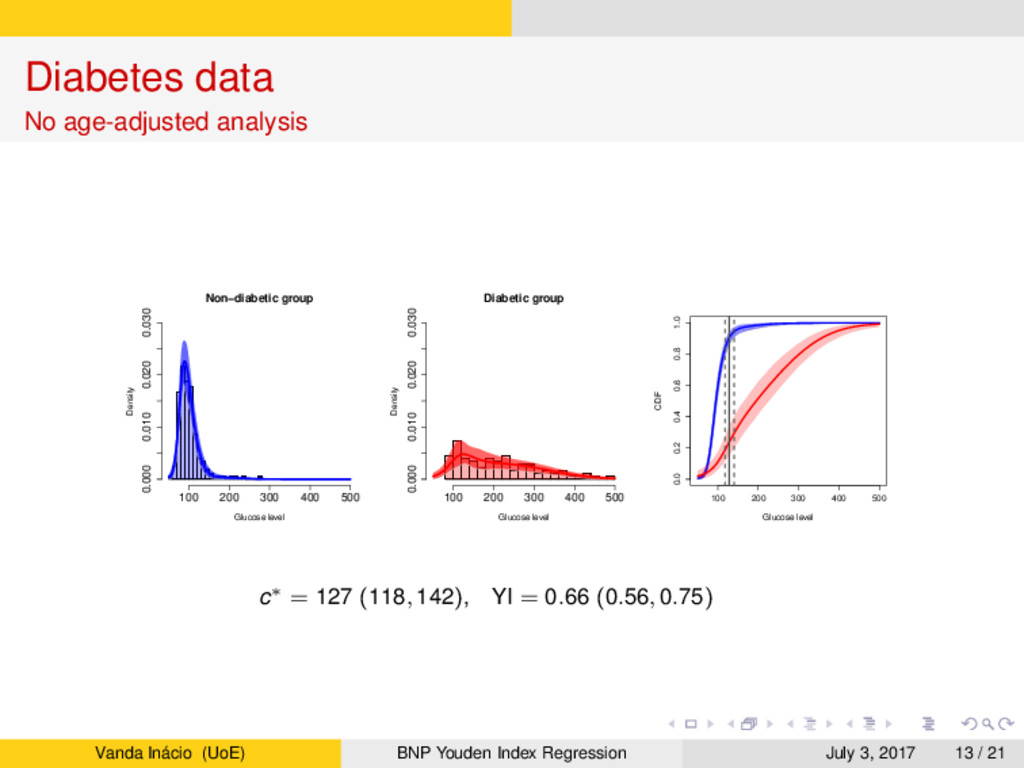
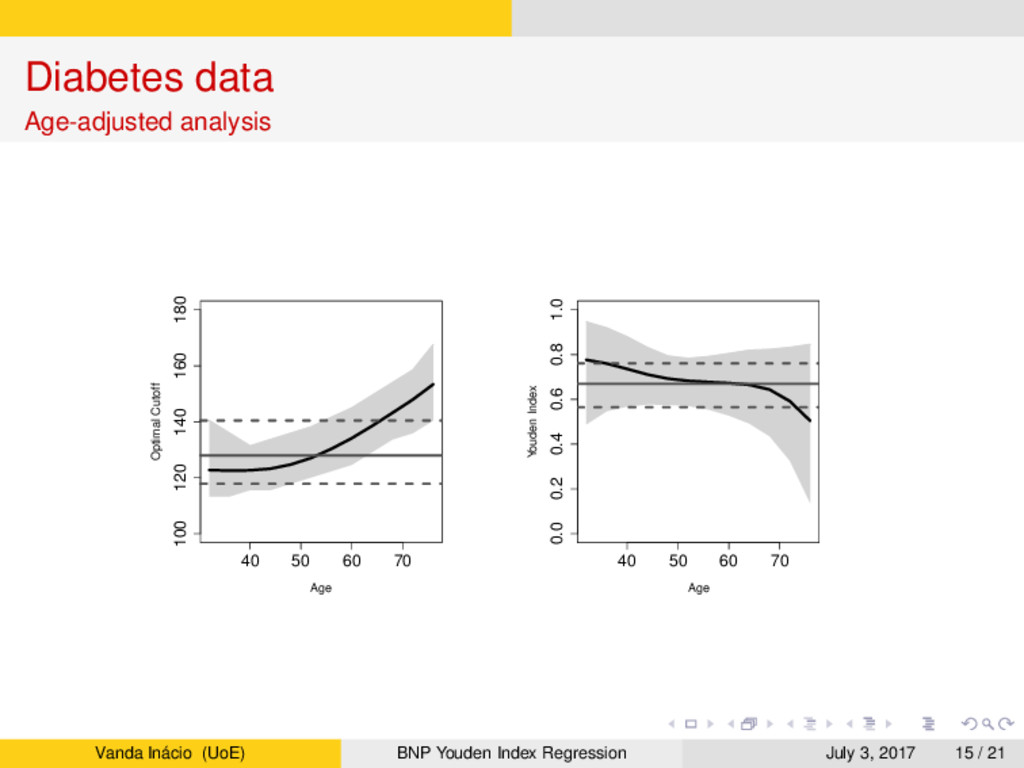
a population-based survey in Cairo, Egypt (Smith and Thompson, 1996). → In this study, postprandial glucose measurements were obtained from a fingerstick on 286 subjects. → Accordingly to the gold standard, 88 subjects were classified as diabetic and 198 subjects were classified as non-diabetic. → Age is believed to play a key role, especially in the non-diabetic group, whose subjects tend to have higher glucose levels. → Our aim is two-fold: → Assess the accuracy of the glucose levels as a marker for diabetes and determine the optimal glucose level to screen subjects in practice. → Assess how the accuracy and optimal cutoff change as a function of age. Vanda Inácio (UoE) BNP Youden Index Regression July 3, 2017 12 / 21
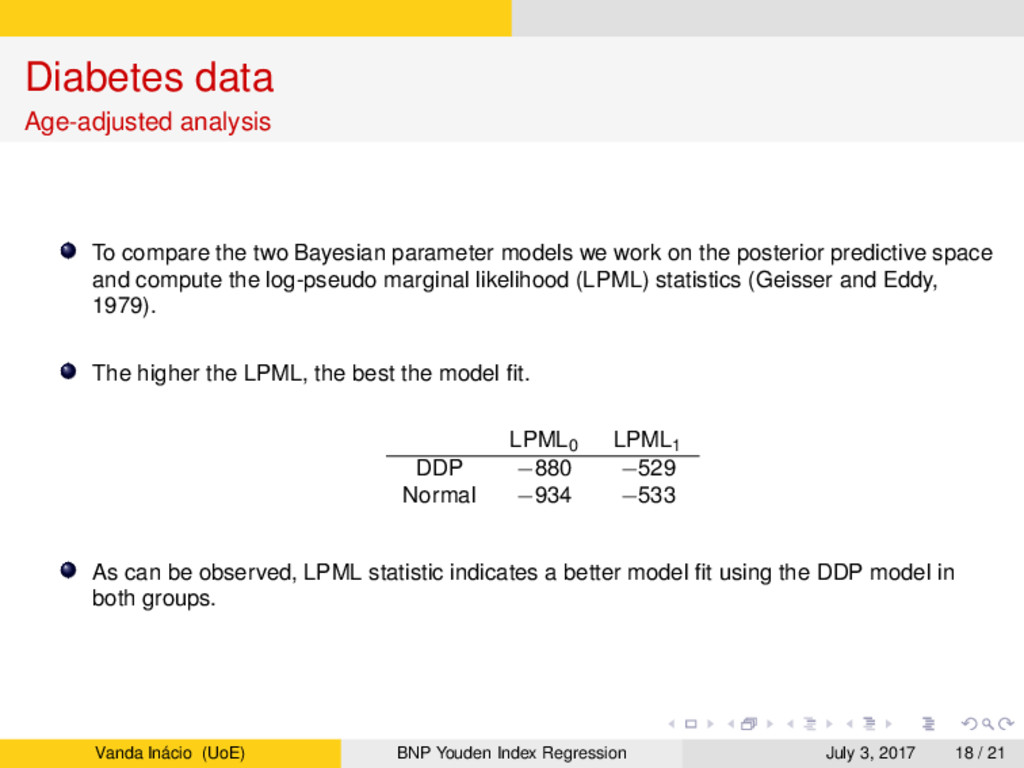
models we work on the posterior predictive space and compute the log-pseudo marginal likelihood (LPML) statistics (Geisser and Eddy, 1979). The higher the LPML, the best the model fit. LPML0 LPML1 DDP −880 −529 Normal −934 −533 As can be observed, LPML statistic indicates a better model fit using the DDP model in both groups. Vanda Inácio (UoE) BNP Youden Index Regression July 3, 2017 18 / 21
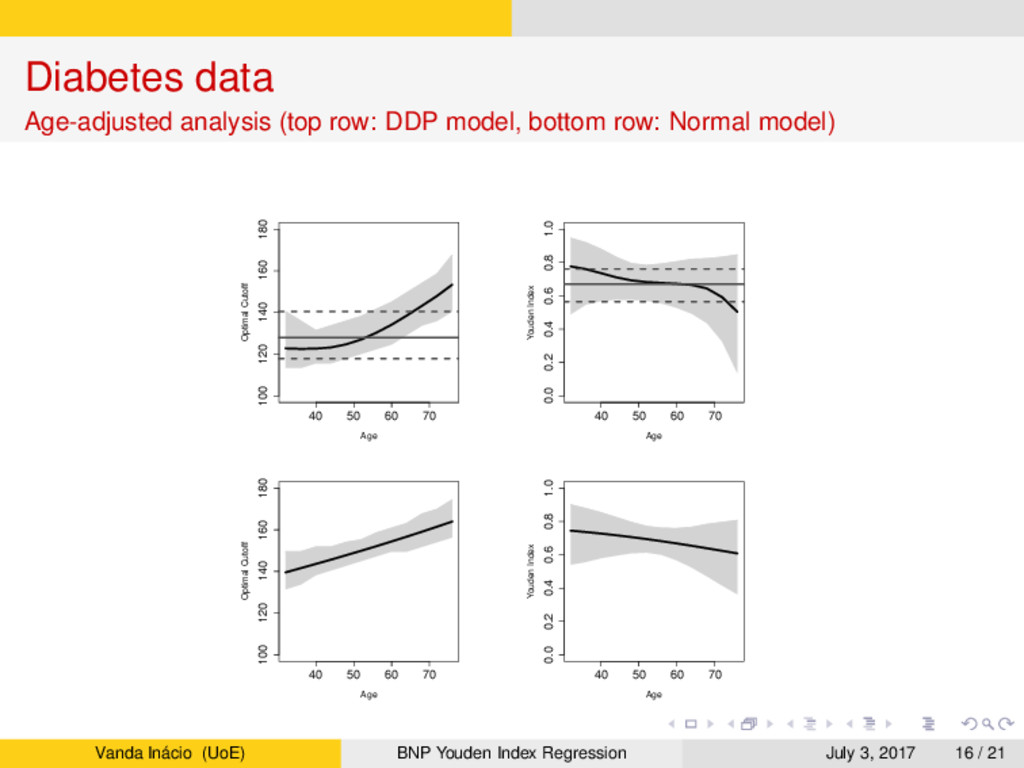
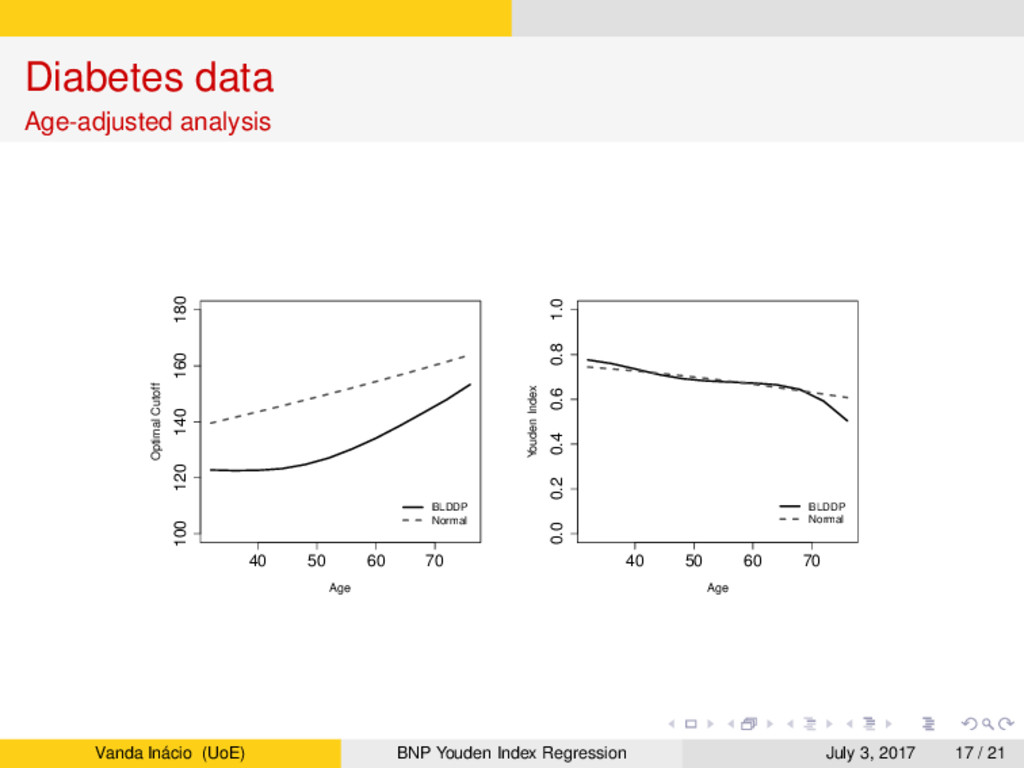
estimate the covariate-specific Youden index and the corresponding optimal cutoff. → The extreme flexibility of our model arises from using dependent Dirichlet process mixtures combined with B-splines regression. → Our investigation into the potential of glucose to serve as a biomarker of diabetes found that its classification accuracy decreases with age and the optimal cutoff to screen subjects in practice increases with age. → LPML criterion indicated a preference for our nonparametric model over a parametric linear regression, which gave much higher estimates of the optimal cutoff across age compared to the nonparametric estimates. → Our simulation study illustrated the ability of the model to dynamically respond to complex data distributions in a variety of scenarios, with little price to be paid in terms of decreased posterior precision for the extra generality of our nonparametric estimator when compared with parametric estimates (even when the parametric model holds). Vanda Inácio (UoE) BNP Youden Index Regression July 3, 2017 19 / 21
V., de Carvalho, M., Branscum, A. J. Nonparametric Bayesian covariate-adjusted estimation of the Youden index Biometrics DOI: 10.1111/biom.12686 Vanda Inácio (UoE) BNP Youden Index Regression July 3, 2017 20 / 21