Upgrade to Pro — share decks privately, control downloads, hide ads and more …

Lecture 22: More protein-DNA interactions

Avatar for shaunmahony shaunmahony
April 04, 2022
47

Lecture 22: More protein-DNA interactions

BMMB 554: Lecture 22

Avatar for shaunmahony

shaunmahony

April 04, 2022
Tweet

Transcript

  1. Learning objectives • How can we determine the precise locations

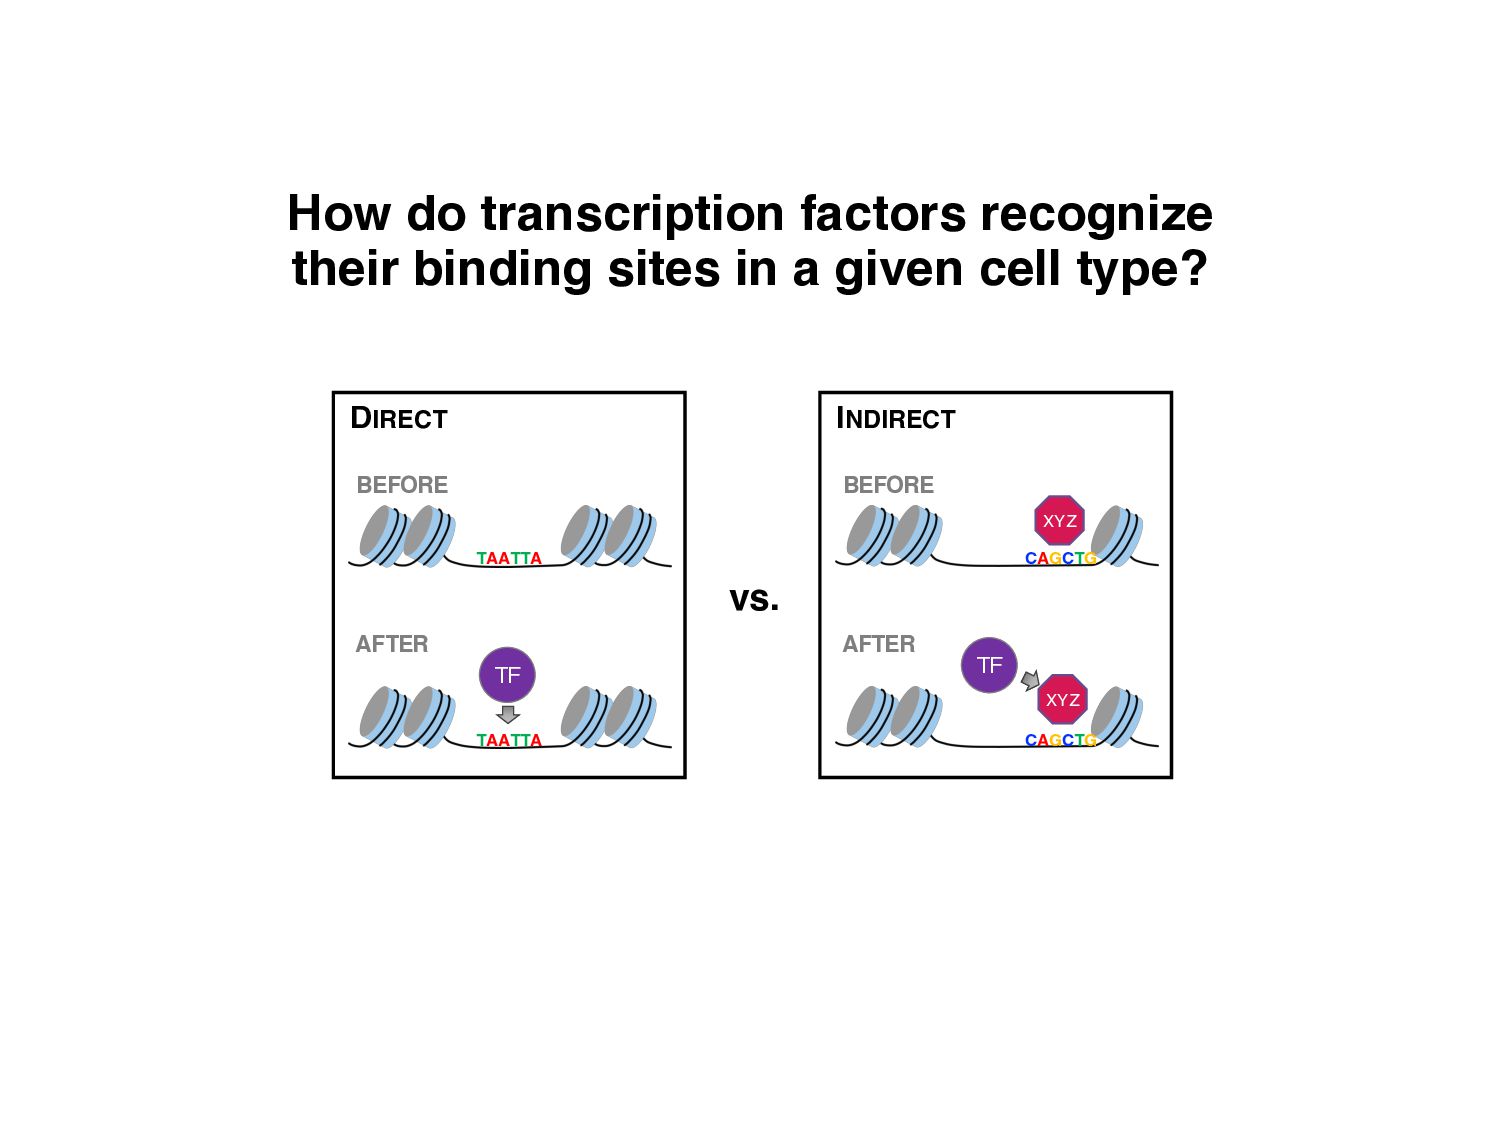
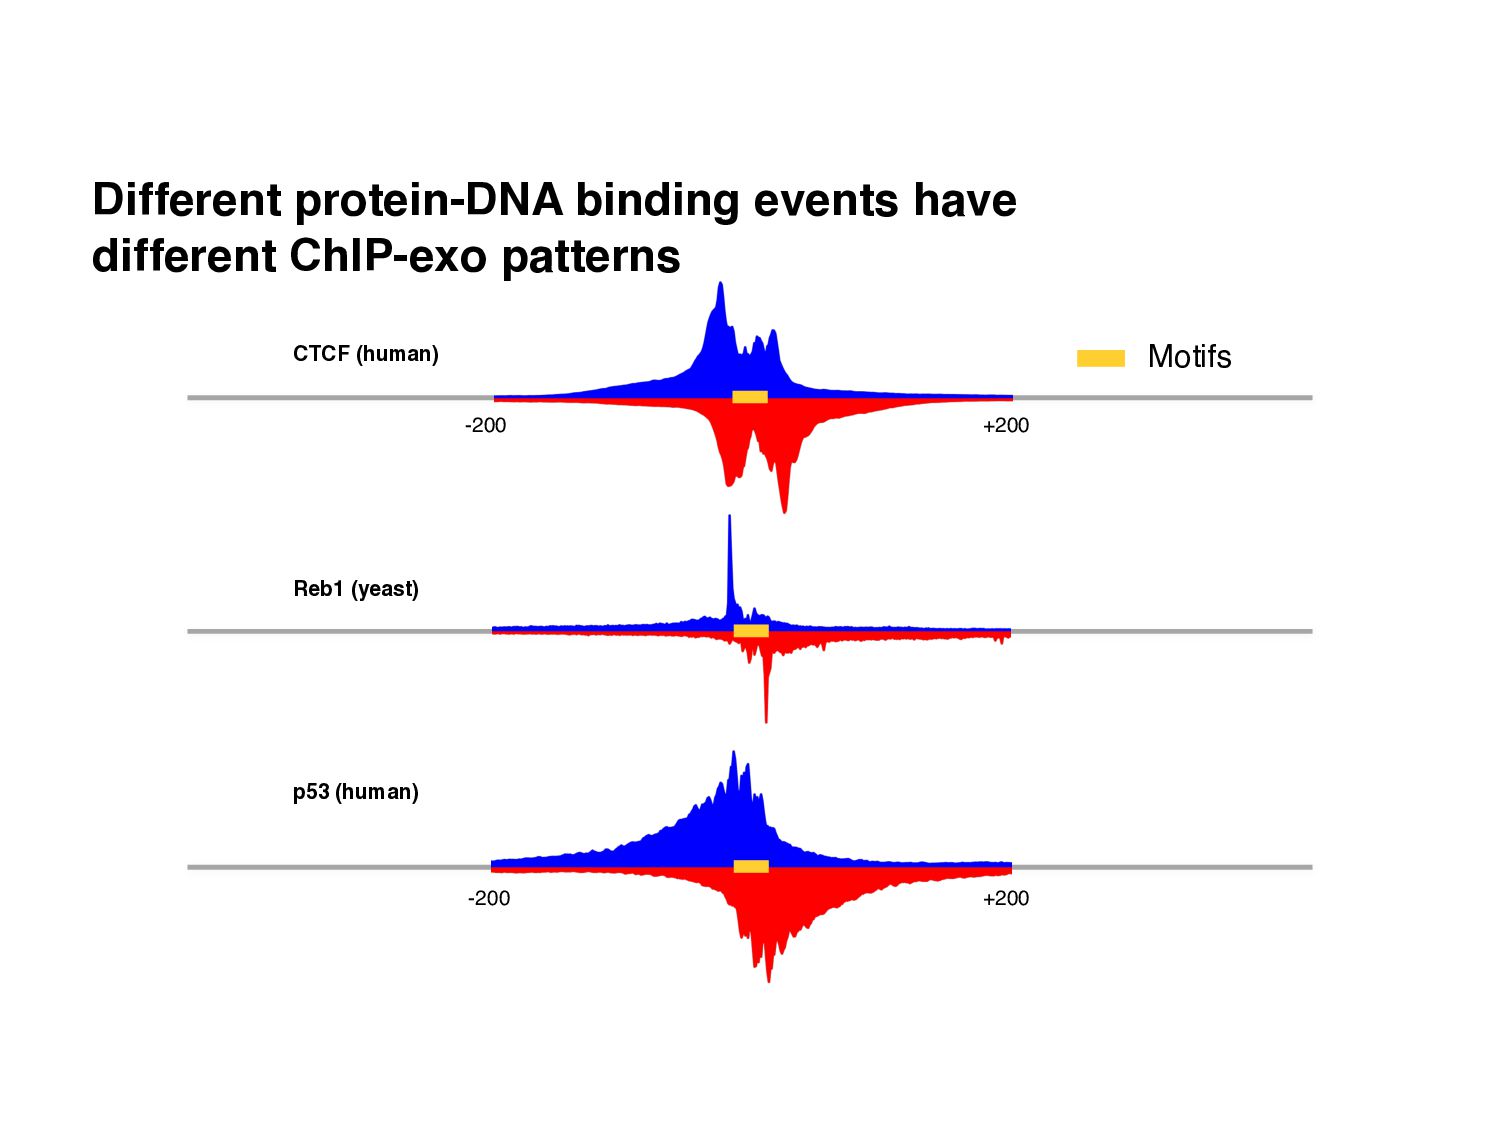
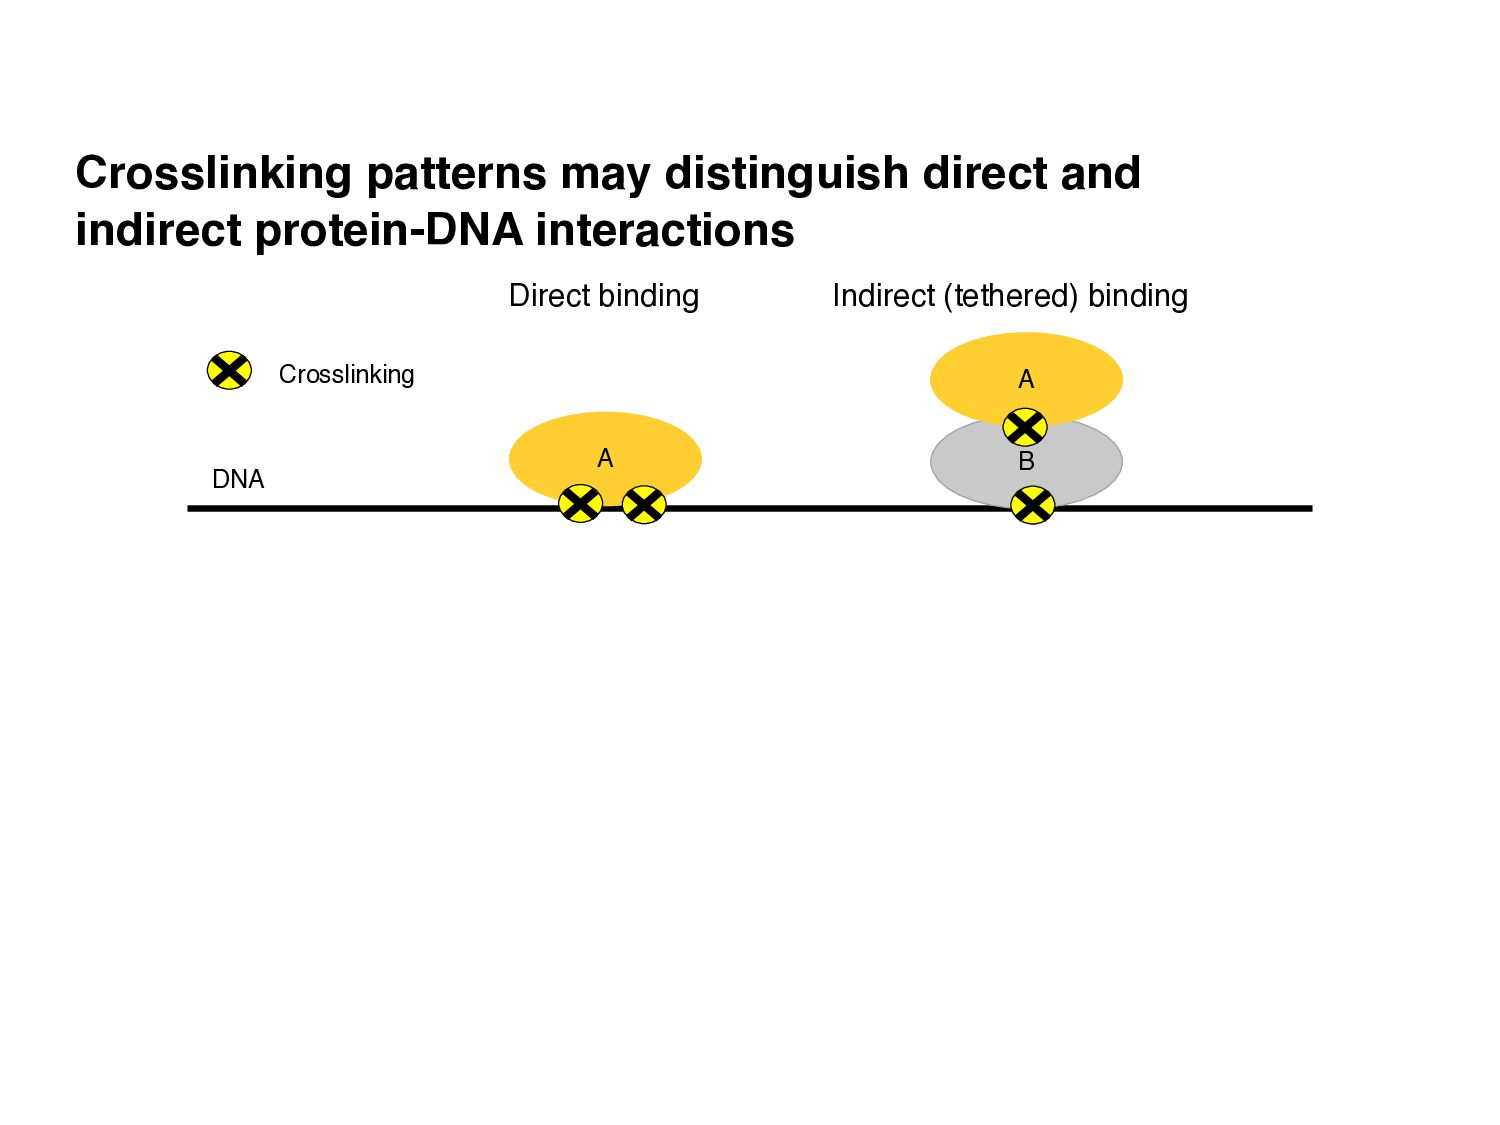
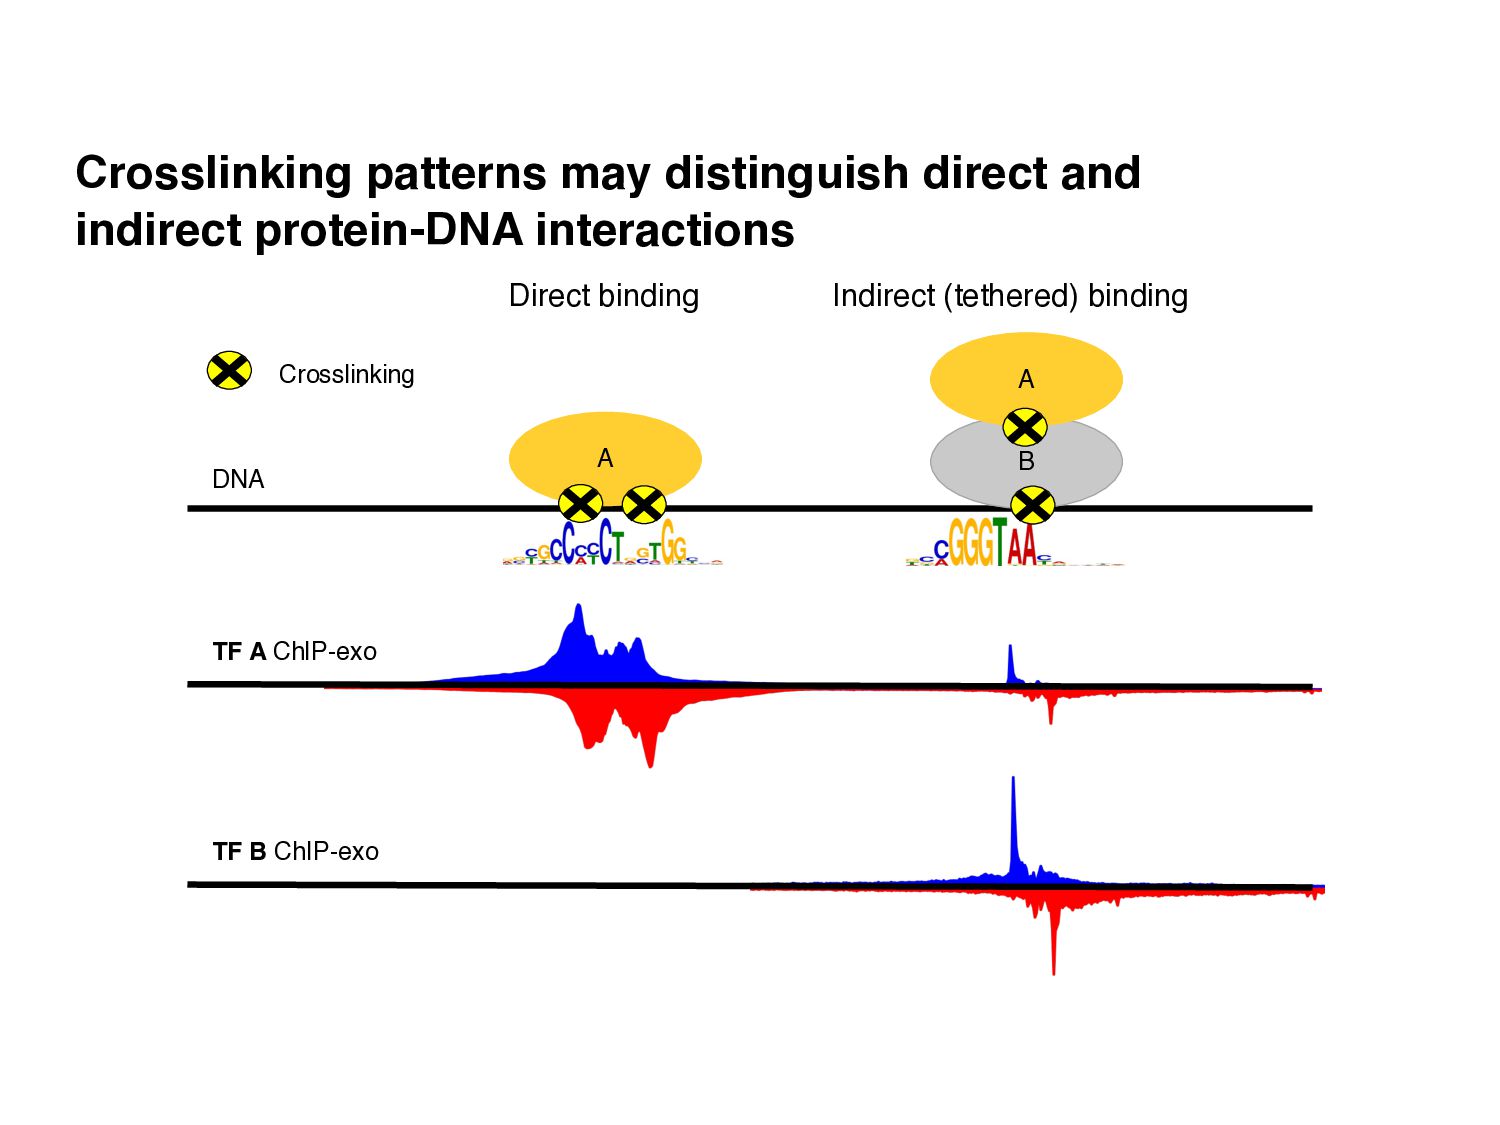
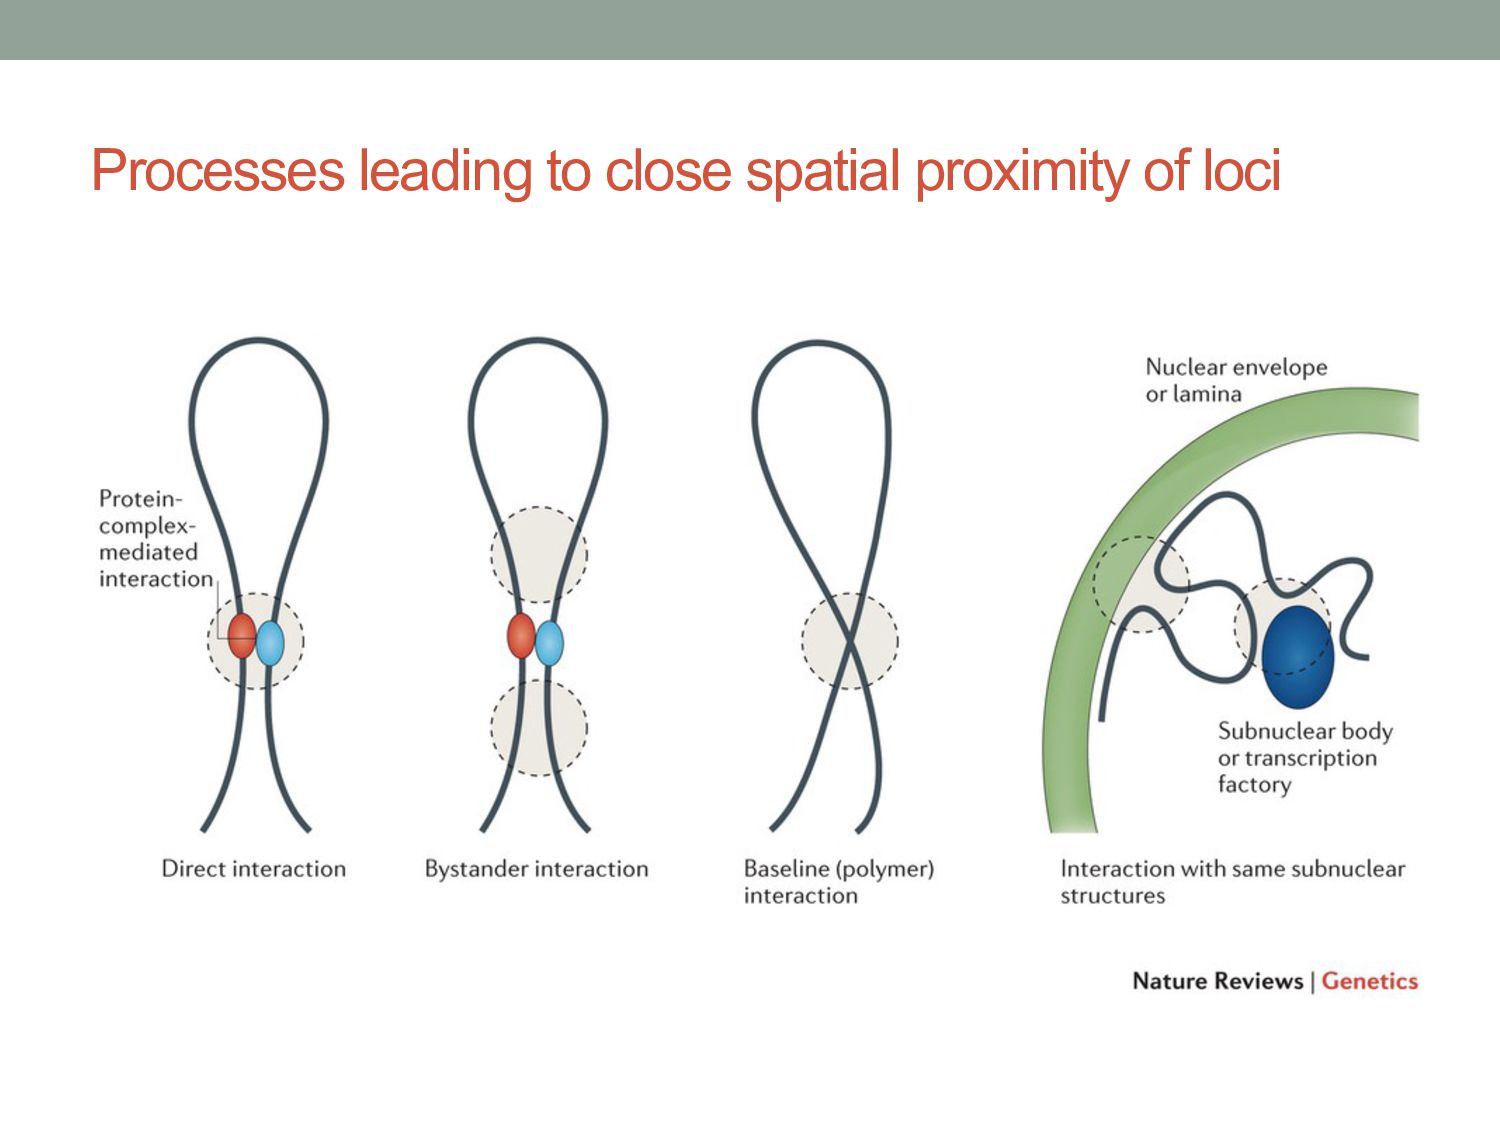
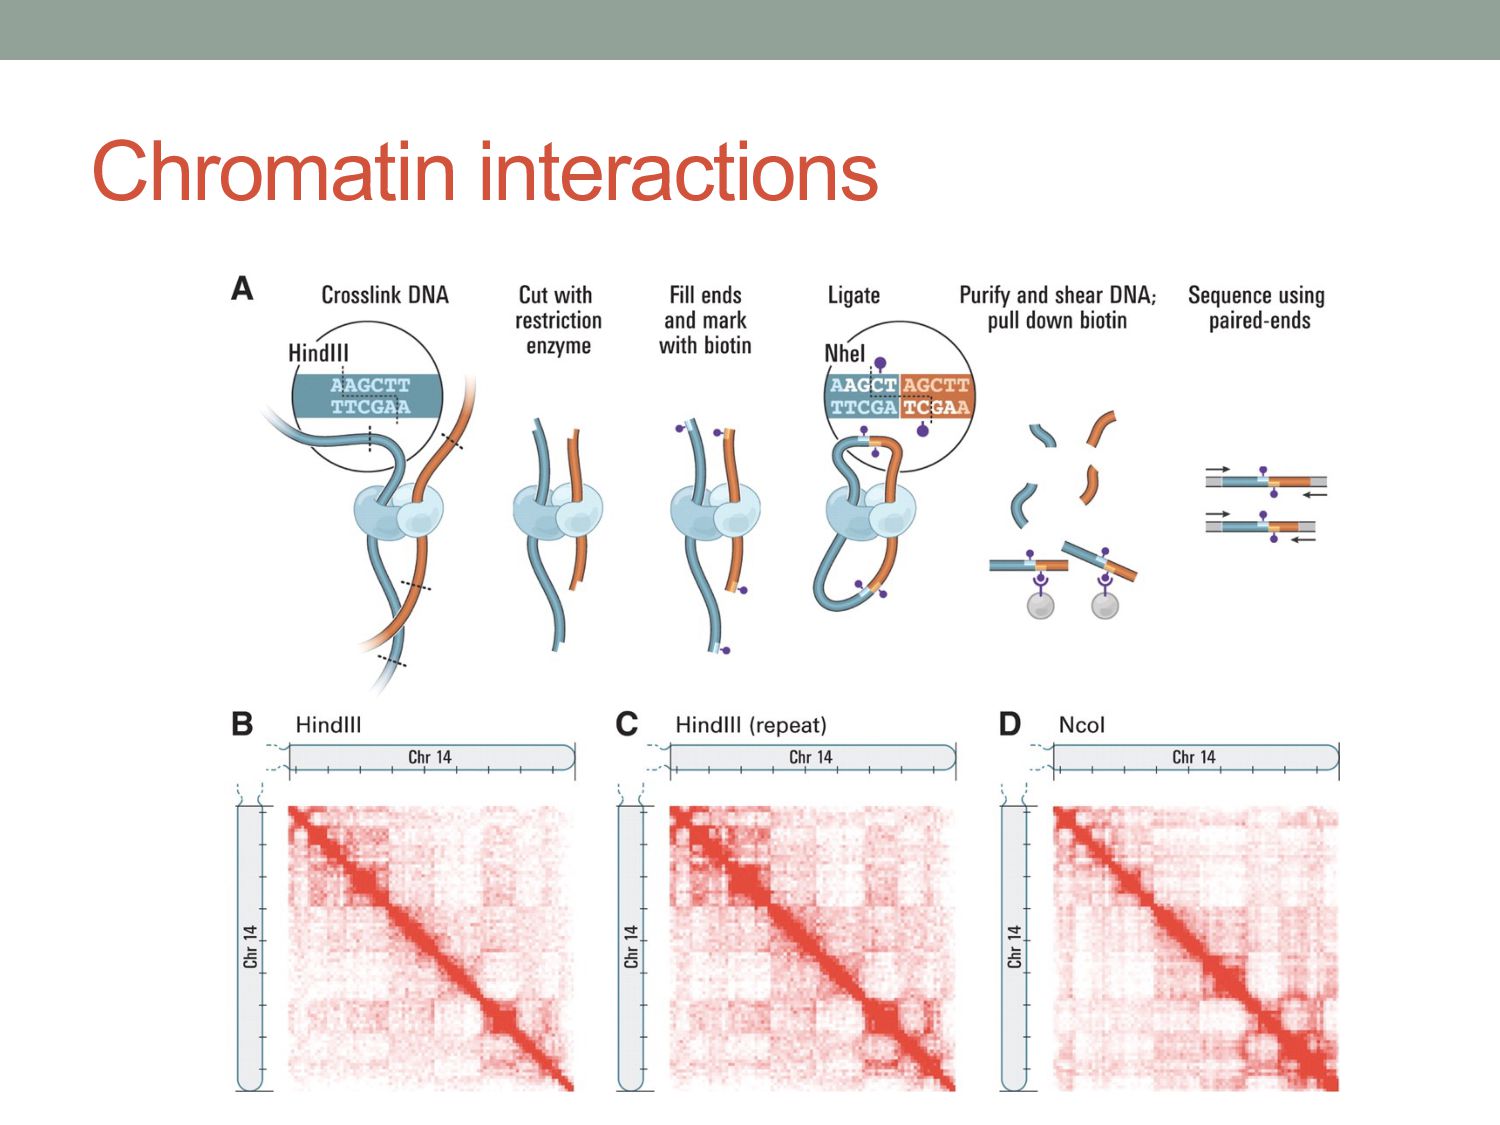
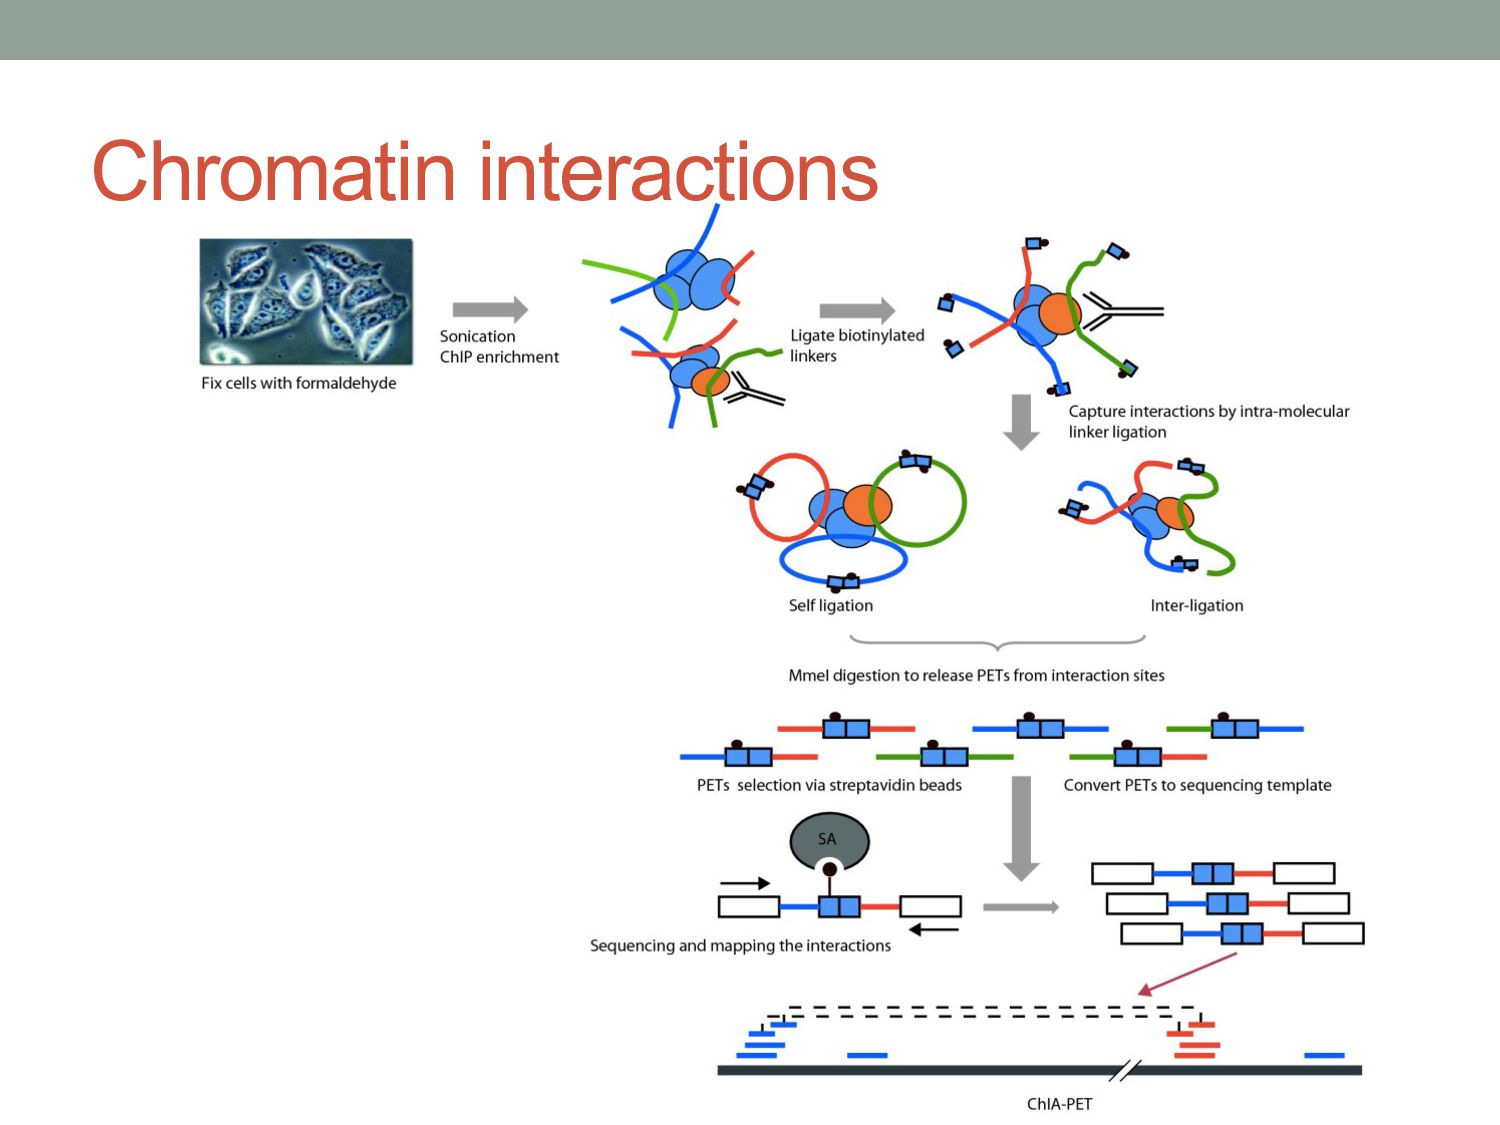
    of protein-DNA interaction from ChIP-seq data? • How can we find differences in regulatory signals across conditions? • Can we determine whether proteins are bound directly or indirectly to DNA? • Can we assay three-dimensional interactions in chromatin?
  2. Identifying precise TF binding locations • ChIP-seq reads are distributed

    bimodally around binding sites. • Regions of ChIP-enrichment are known as “peaks”. Valouev, et al. Nature Methods (2008)
  3. Computational challenge: resolve the structure of TF binding events from

    ChIP-seq data How many binding events are here? How close to the actual bound bases are event predictions? + -
  4. Next steps in regulatory analysis • We’ve found: – TF

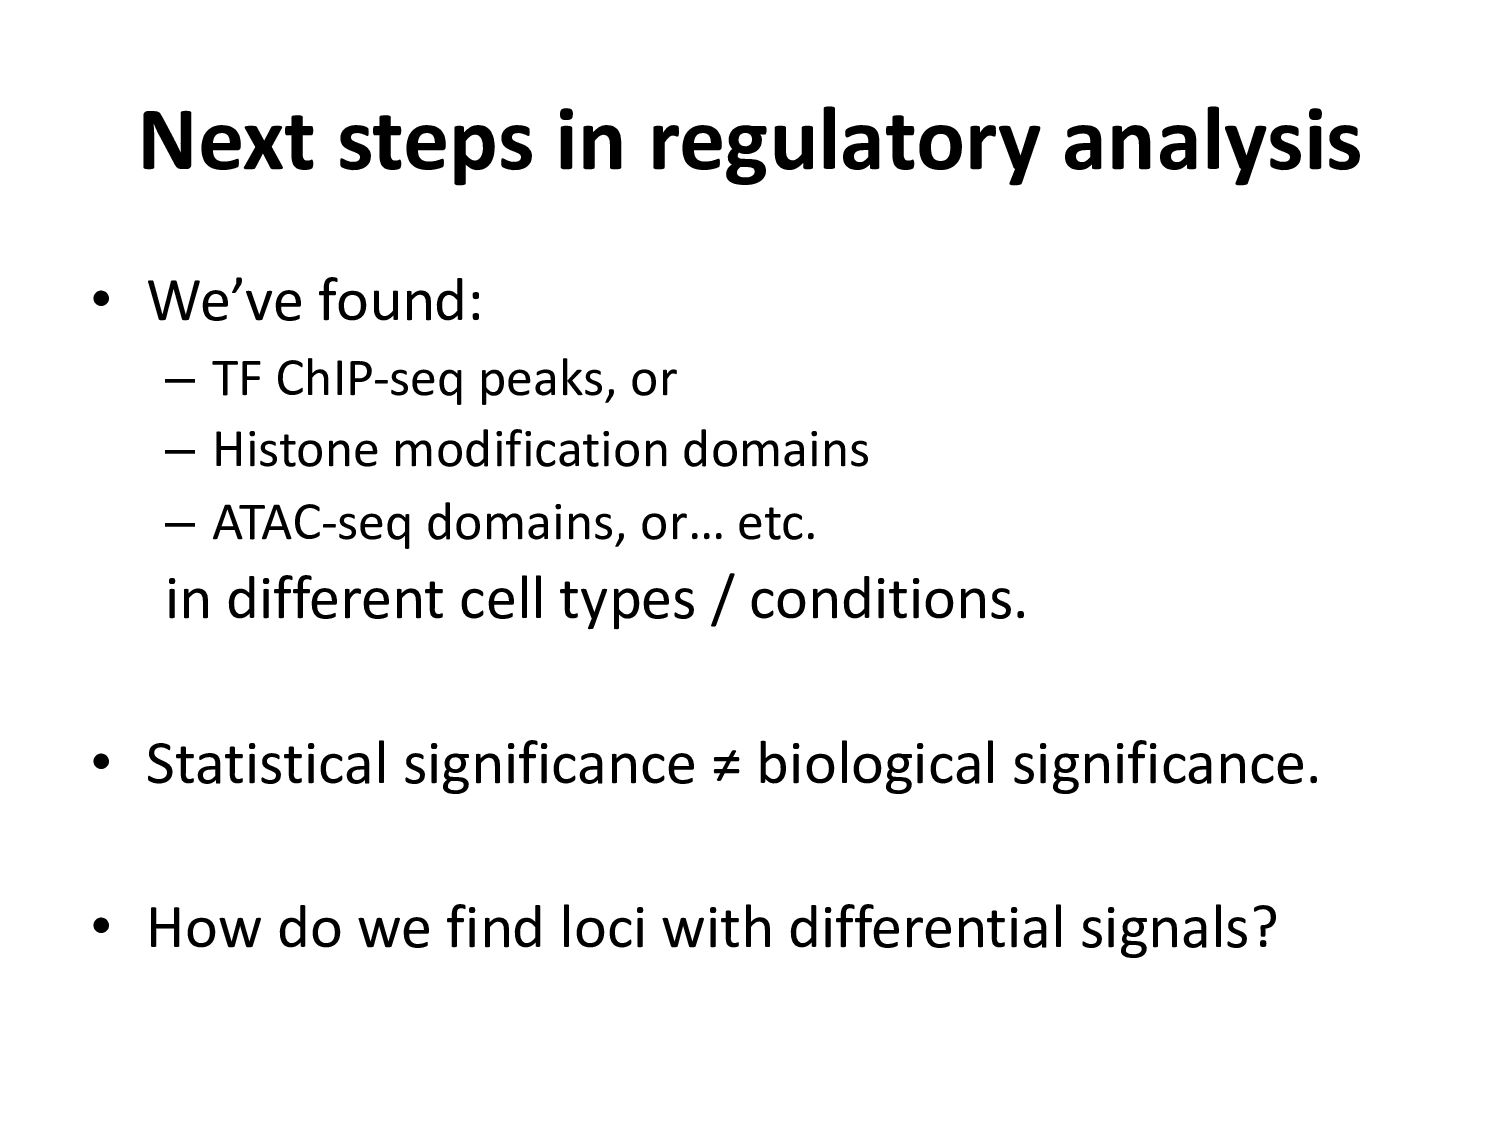
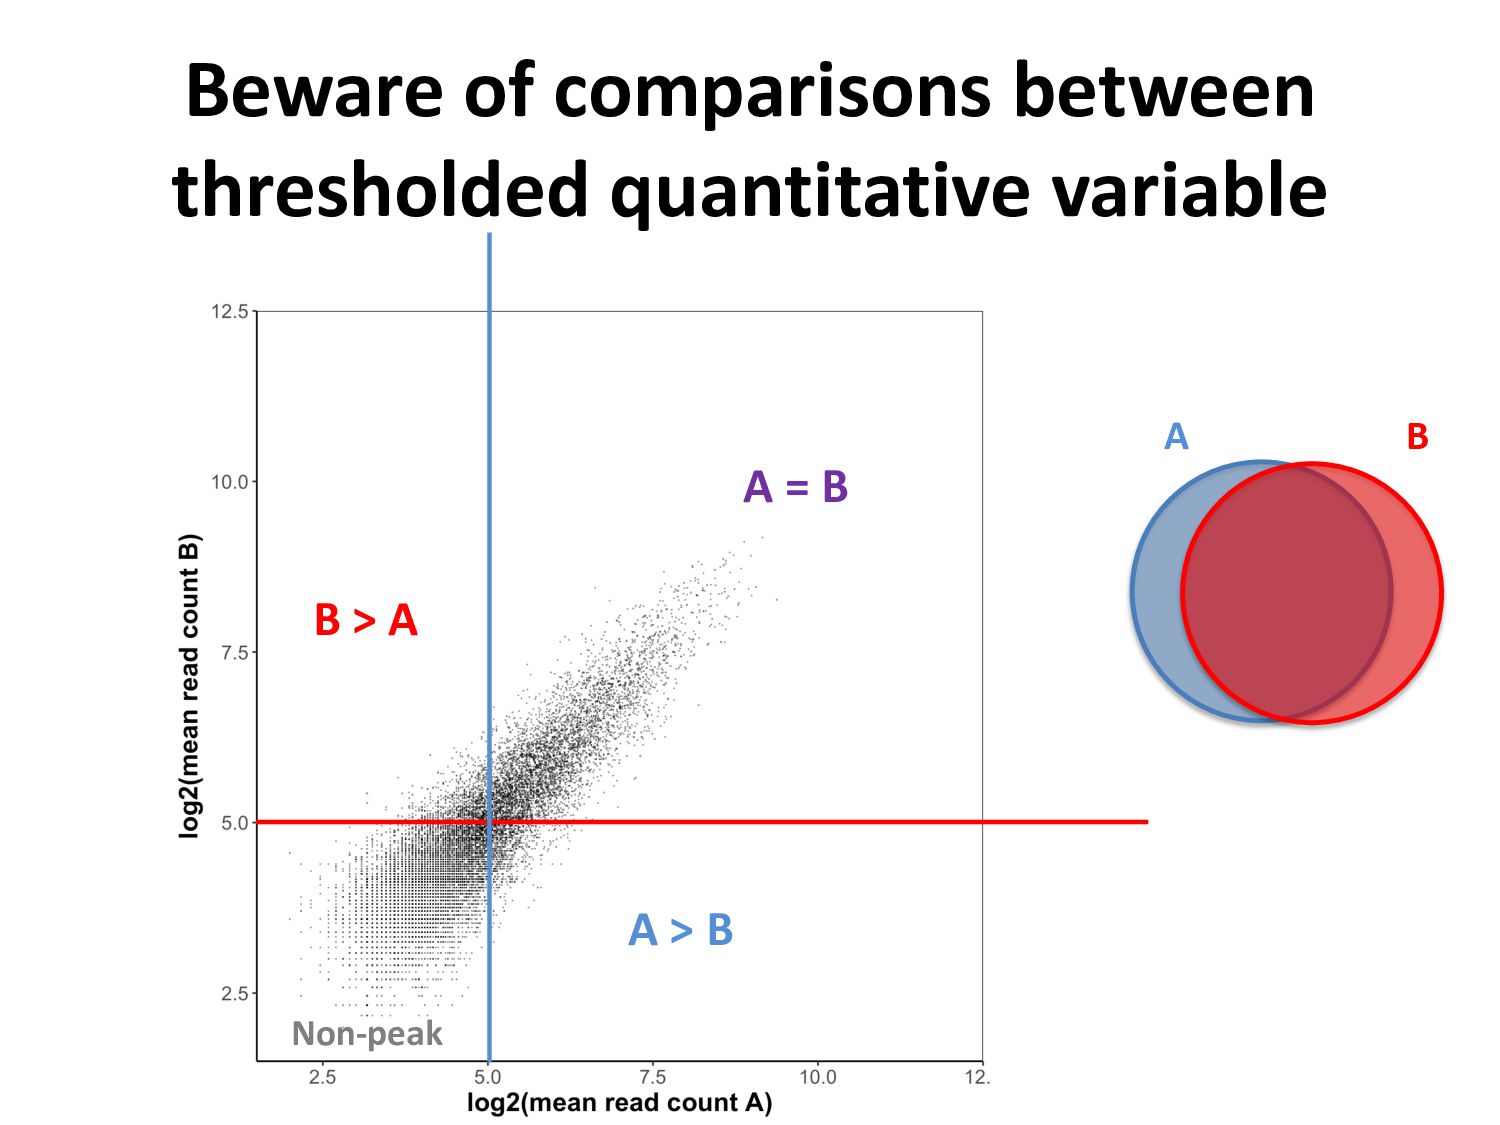
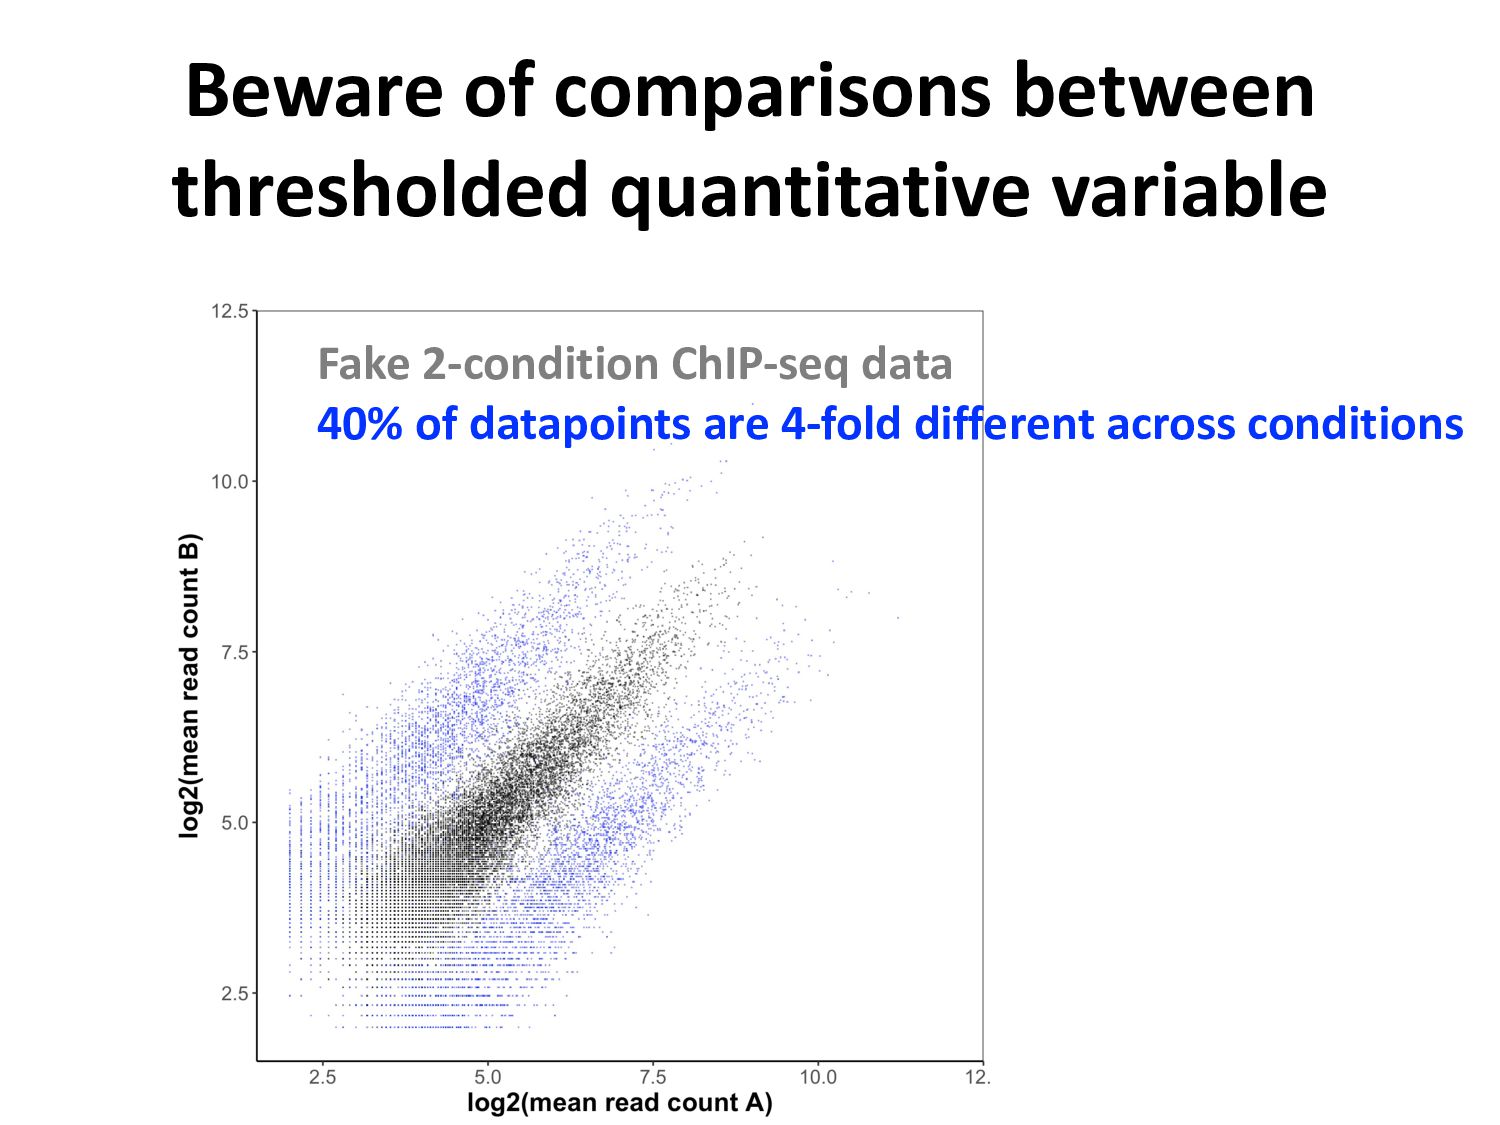
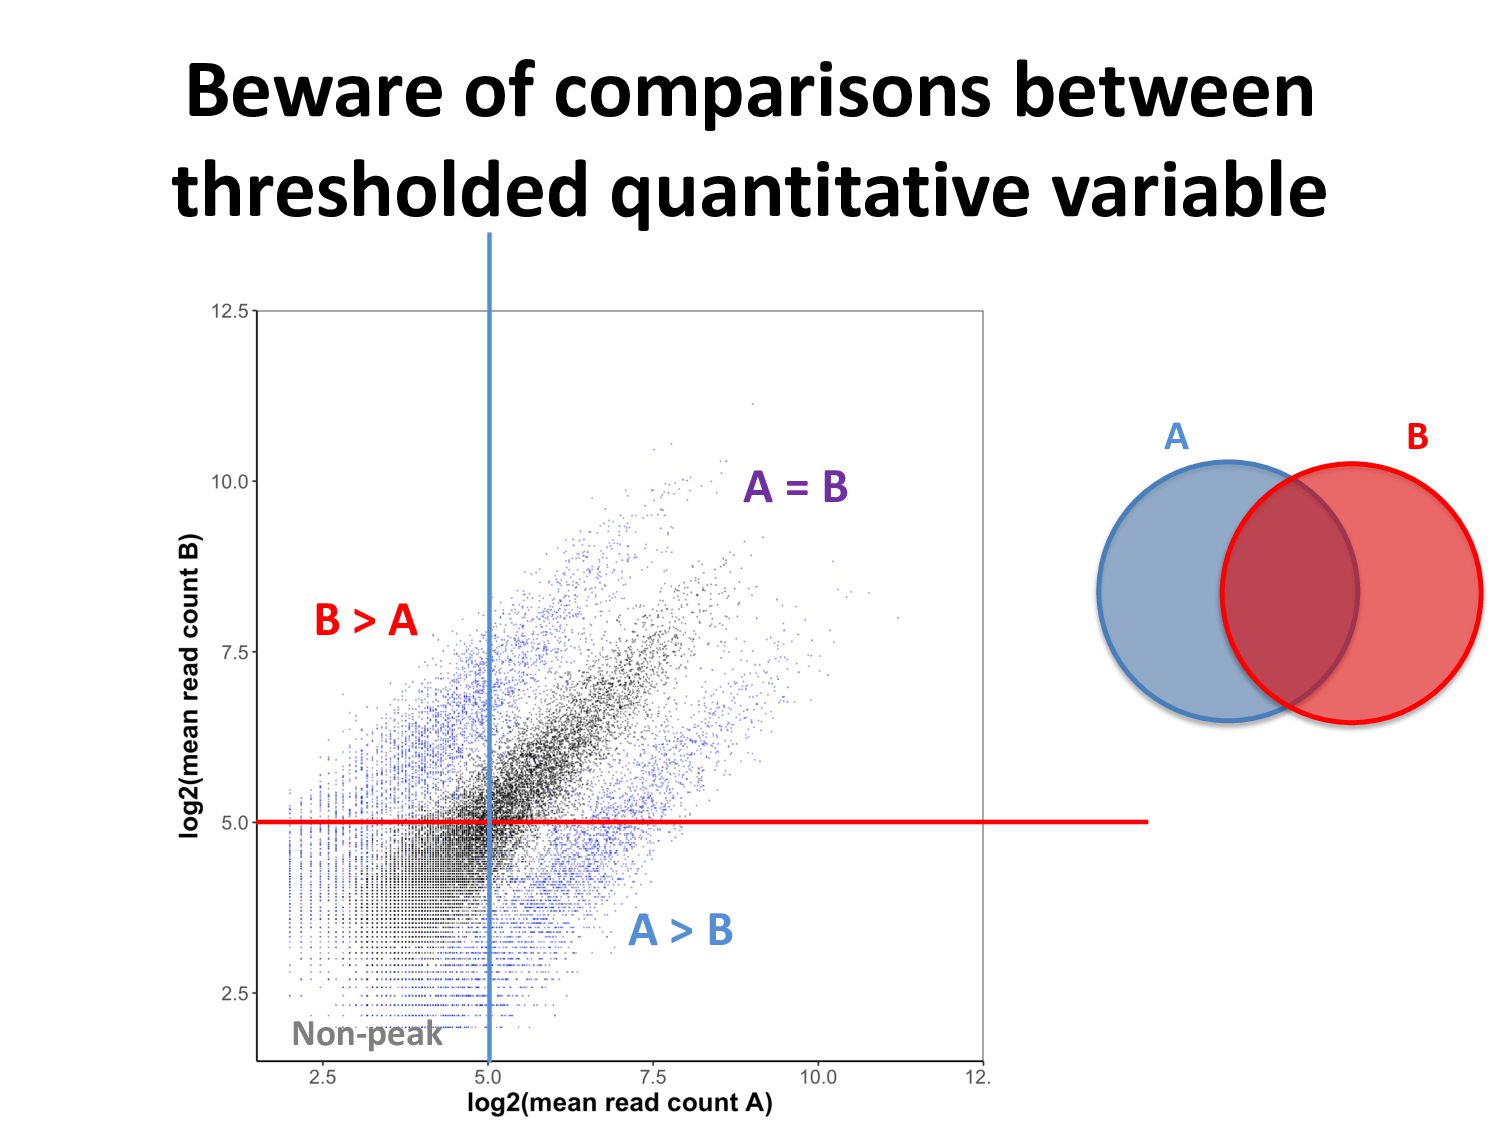
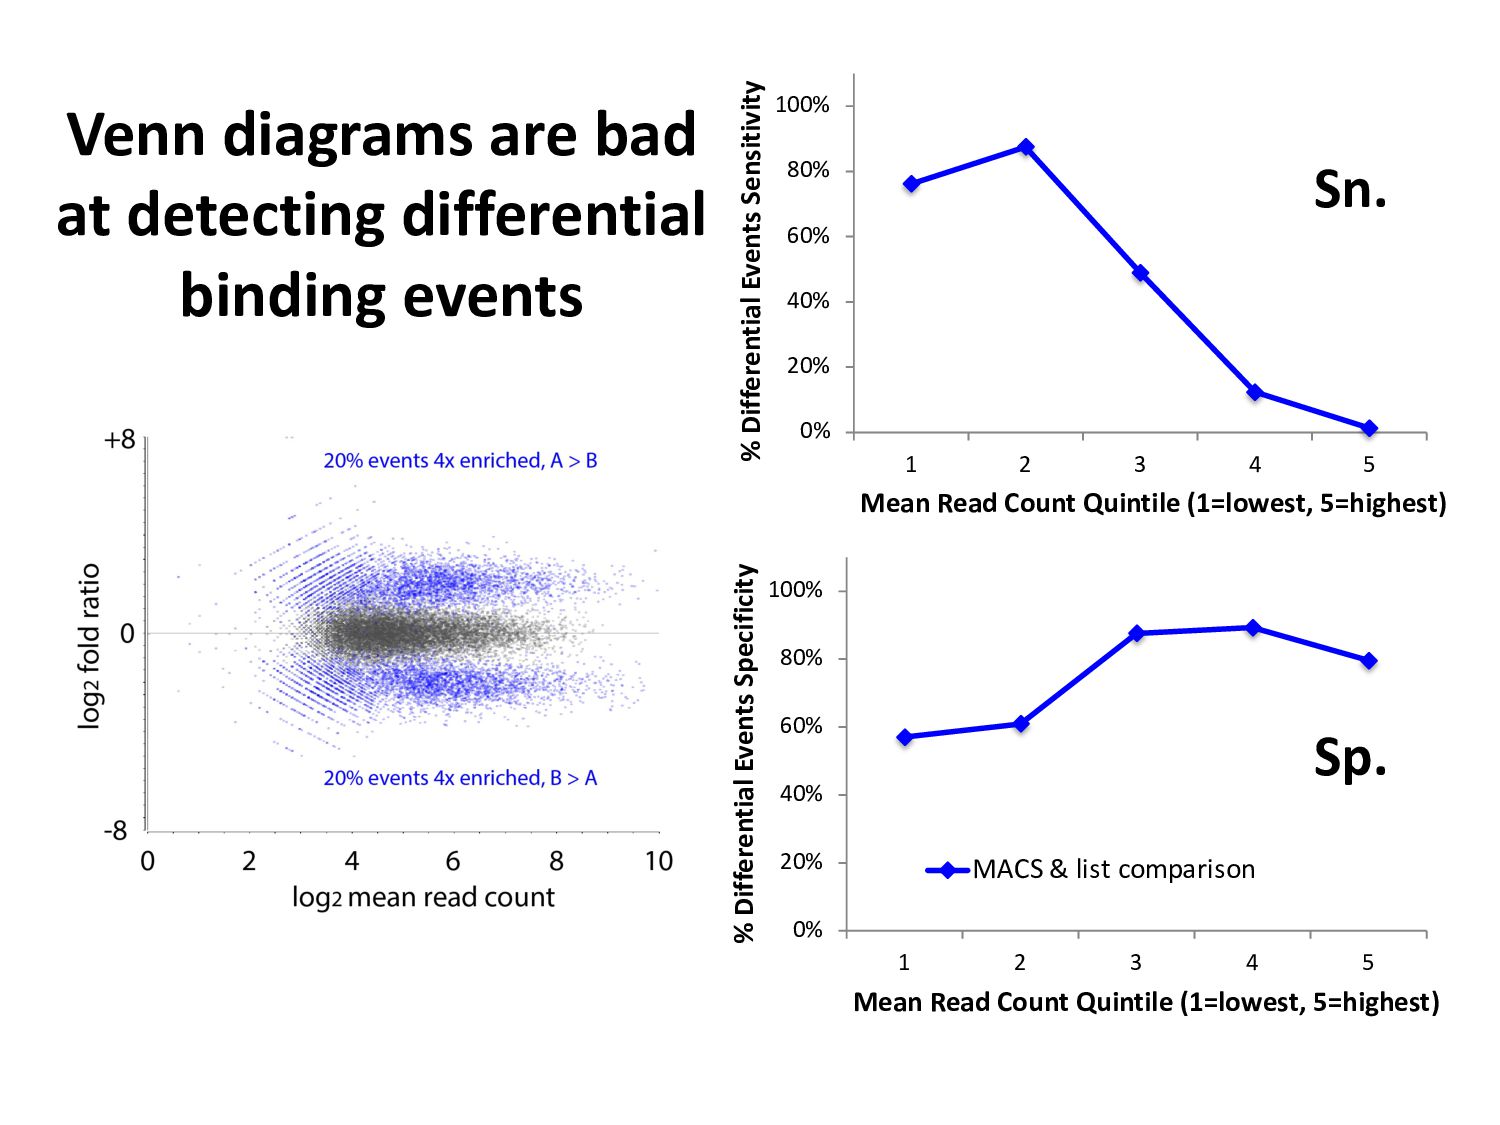
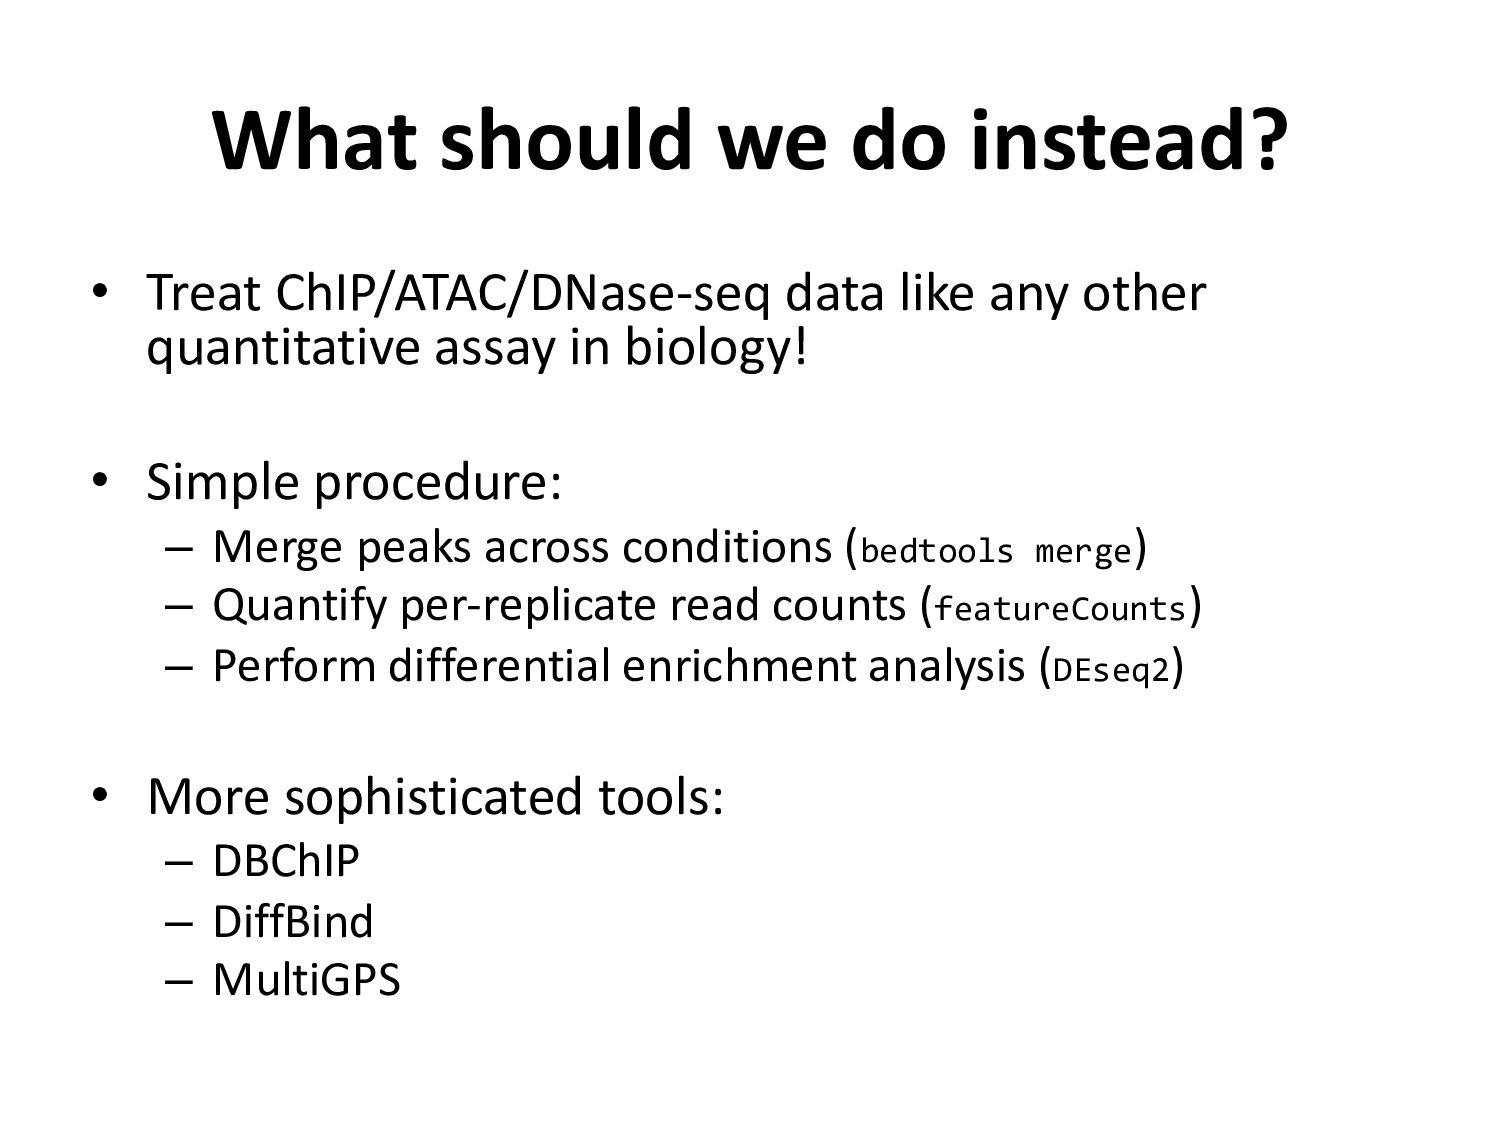
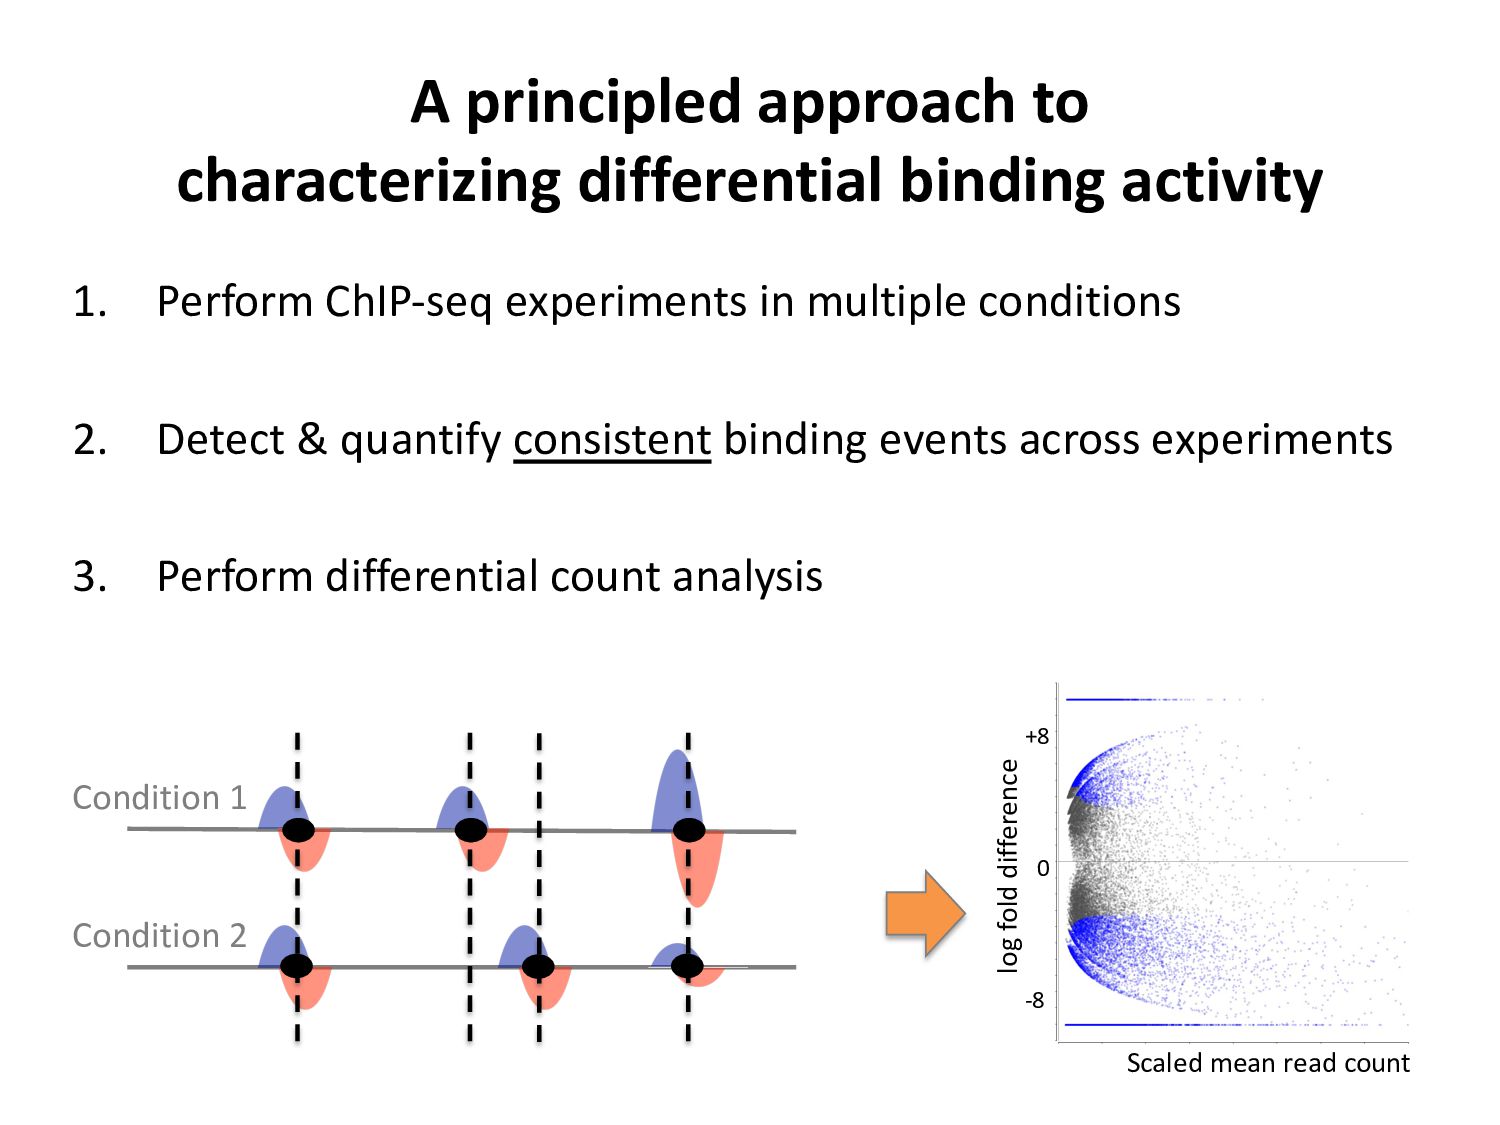
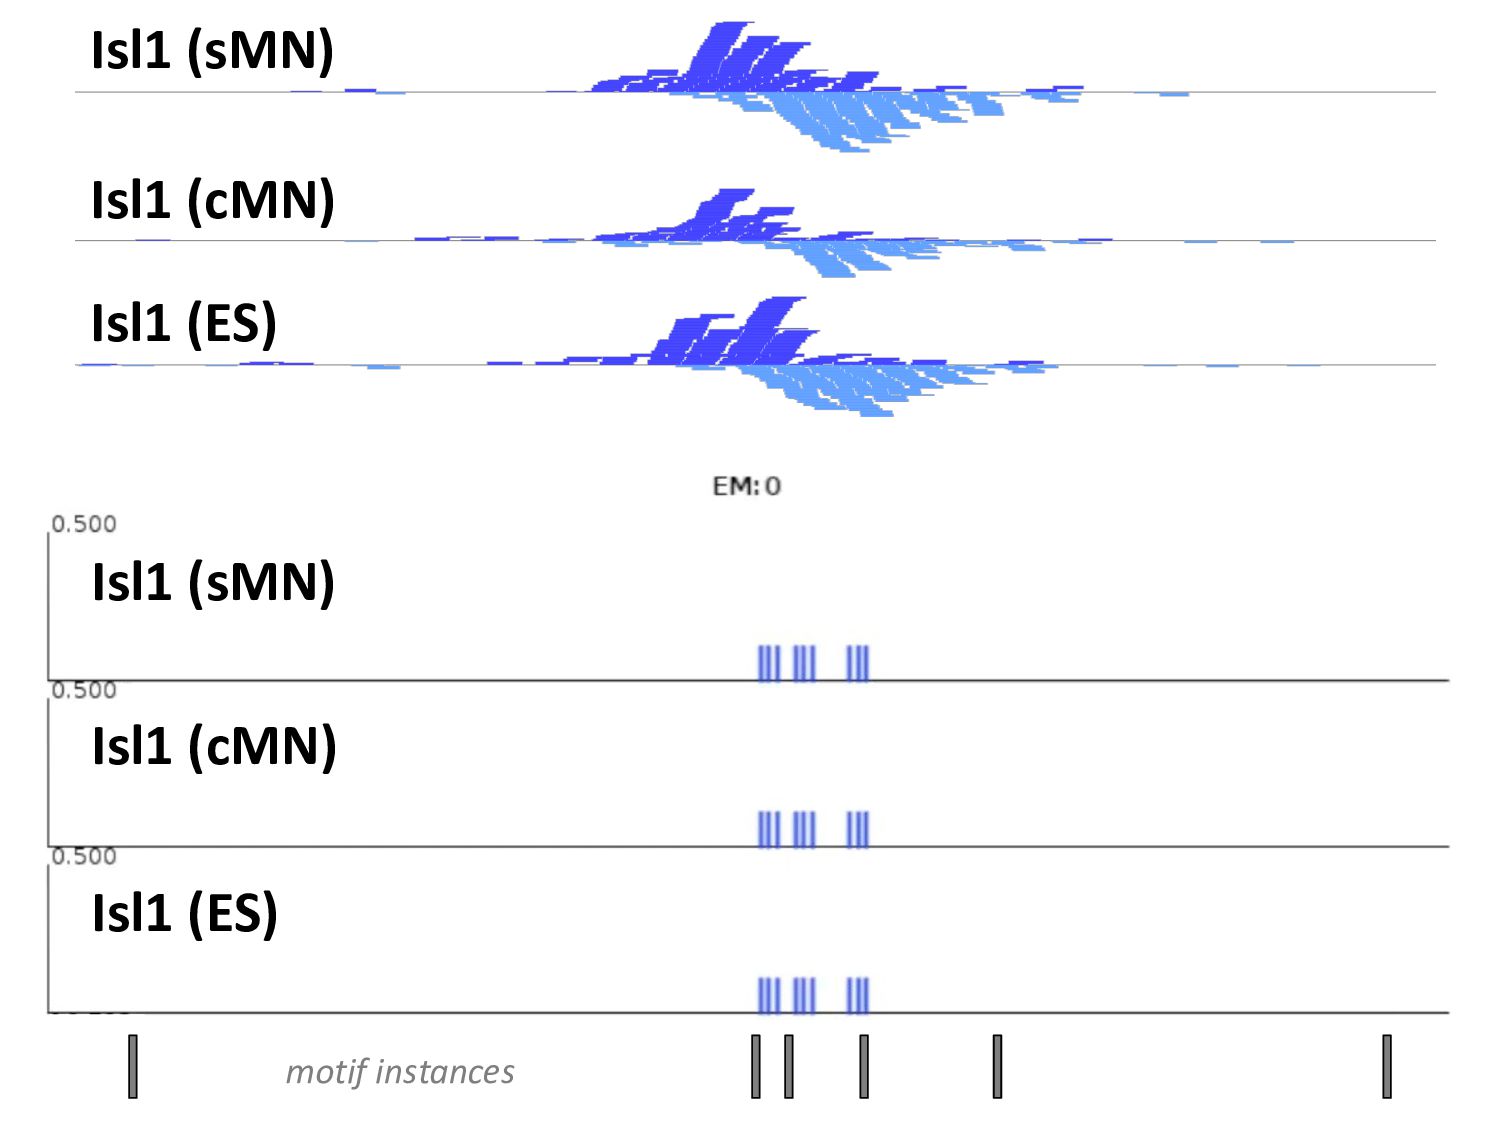
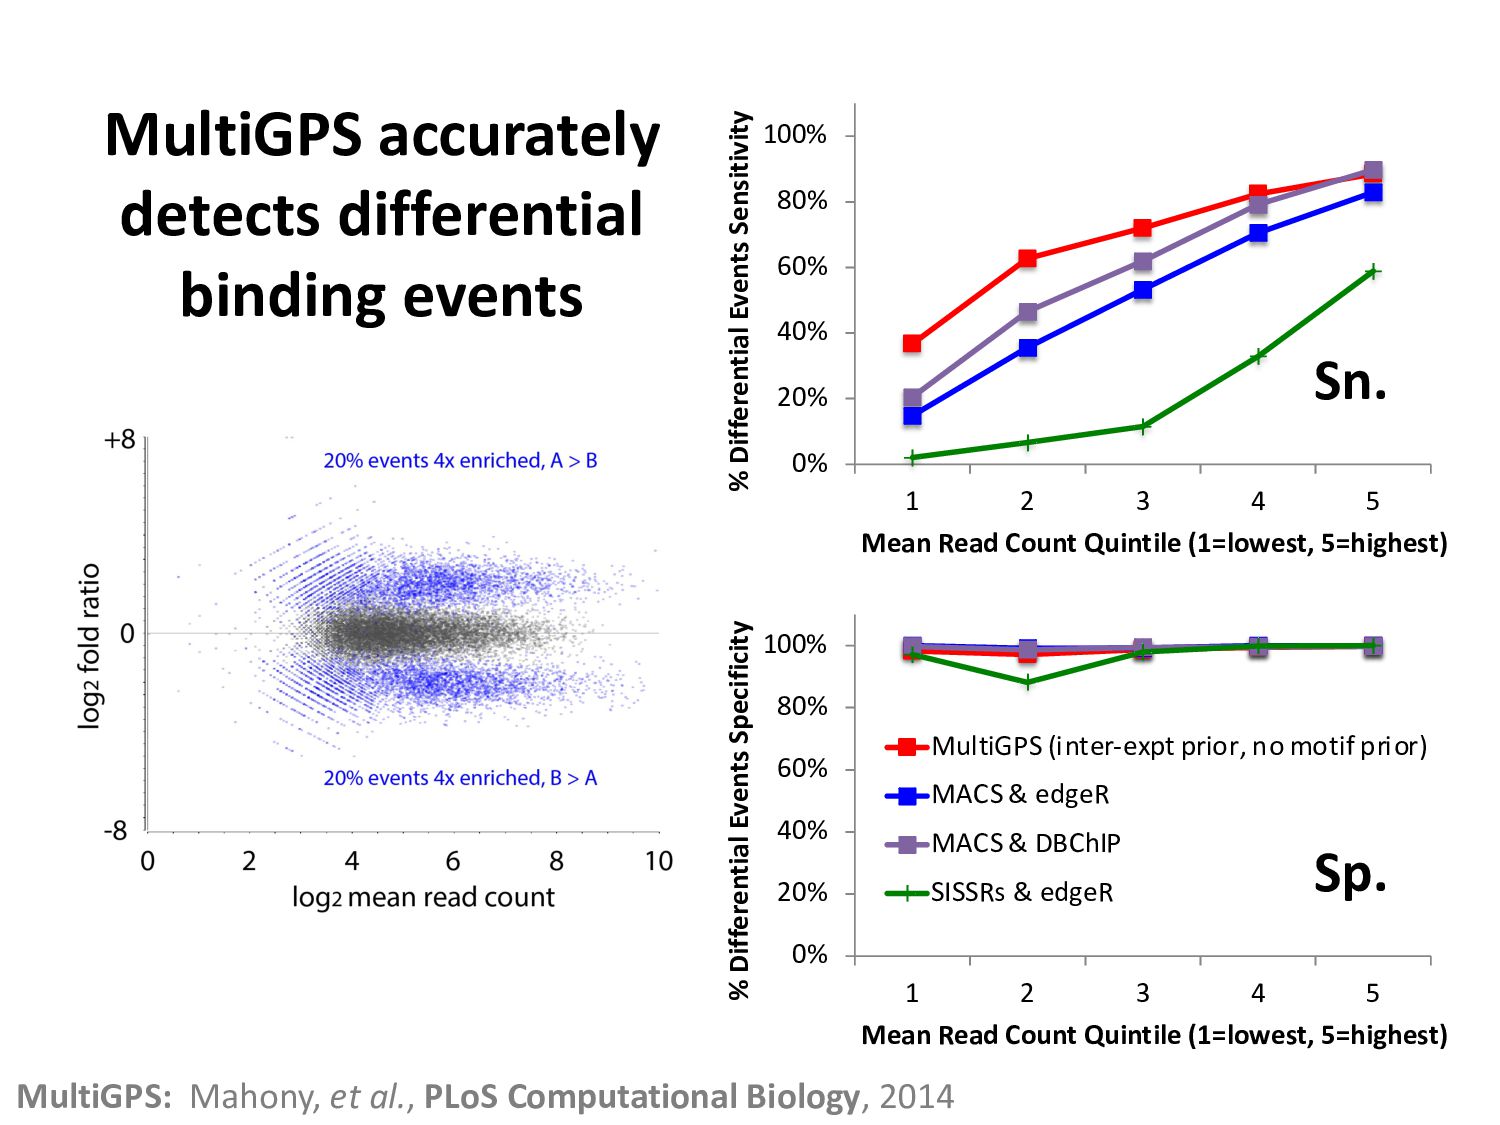
    ChIP-seq peaks, or – Histone modification domains – ATAC-seq domains, or… etc. in different cell types / conditions. • Statistical significance ≠ biological significance. • How do we find loci with differential signals?
  5. Detecting differential binding: Can’t we just use a Venn diagram?

    Peaks called in condition A Peaks called in condition B Peaks in condition A that are within 200bp of peaks in condition B
  6. Beware of comparisons between thresholded quantitative variable Fake 2-condition ChIP-seq

    data 40% of datapoints are 4-fold different across conditions
  7. 0% 20% 40% 60% 80% 100% 1 2 3 4

    5 % Differential Events Sensitivity Mean Read Count Quintile (1=lowest, 5=highest) Venn diagrams are bad at detecting differential binding events Sn. Sp. 0% 20% 40% 60% 80% 100% 1 2 3 4 5 % Differential Events Specificity Mean Read Count Quintile (1=lowest, 5=highest) MACS & list comparison
  8. What should we do instead? • Treat ChIP/ATAC/DNase-seq data like

    any other quantitative assay in biology! • Simple procedure: – Merge peaks across conditions (bedtools merge) – Quantify per-replicate read counts (featureCounts) – Perform differential enrichment analysis (DEseq2) • More sophisticated tools: – DBChIP – DiffBind – MultiGPS
  9. A principled approach to characterizing differential binding activity 1. Perform

    ChIP-seq experiments in multiple conditions 2. Detect & quantify consistent binding events across experiments 3. Perform differential count analysis Condition 1 Condition 2 +8 0 -8 Scaled mean read count log fold difference
  10. MultiGPS aligns binding events across experiments ChrnX cluster ~30Kbp Plotted

    window = 1,650bp Isl1 (spinal motor neurons) Isl1 (cranial motor neurons) Isl1 (ES cells)
  11. MultiGPS accurately detects differential binding events 0% 20% 40% 60%

    80% 100% 1 2 3 4 5 % Differential Events Specificity Mean Read Count Quintile (1=lowest, 5=highest) MultiGPS (inter-expt prior, no motif prior) MACS & edgeR MACS & DBChIP SISSRs & edgeR 0% 20% 40% 60% 80% 100% 1 2 3 4 5 % Differential Events Sensitivity Mean Read Count Quintile (1=lowest, 5=highest) Sn. Sp. MultiGPS: Mahony, et al., PLoS Computational Biology, 2014
  12. What if the concentration of signal changes globally? • Example

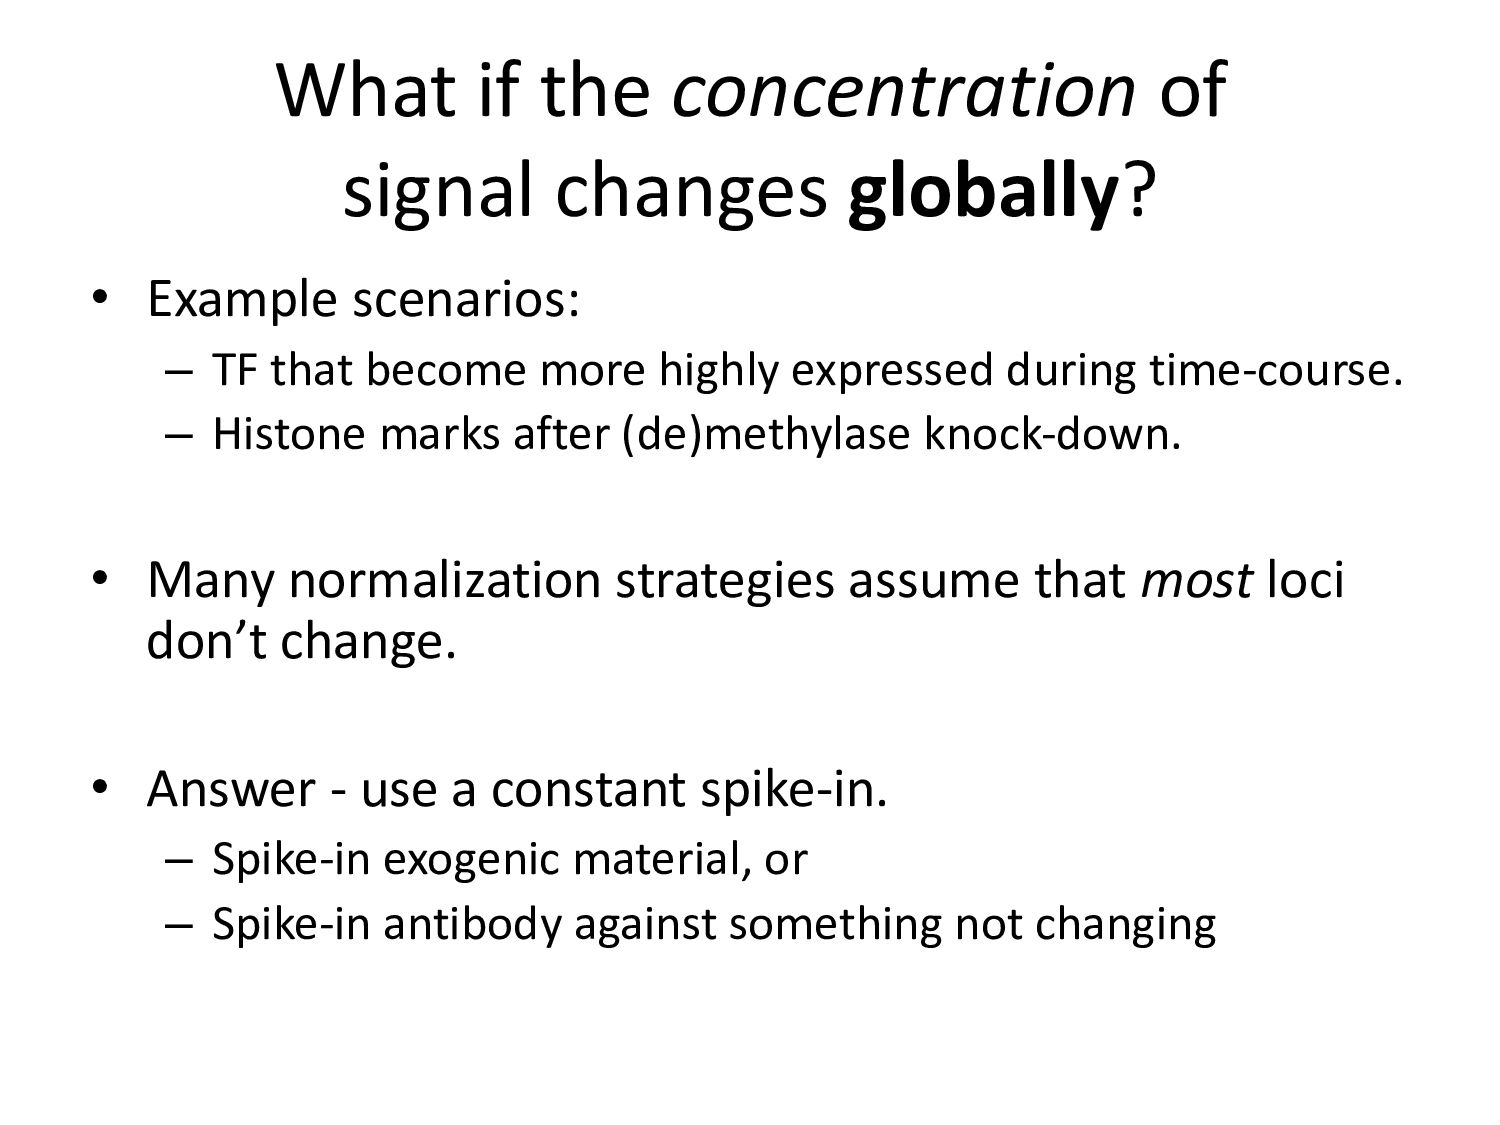
    scenarios: – TF that become more highly expressed during time-course. – Histone marks after (de)methylase knock-down. • Many normalization strategies assume that most loci don’t change. • Answer - use a constant spike-in. – Spike-in exogenic material, or – Spike-in antibody against something not changing
  13. DIRECT TF BEFORE AFTER TAATTA TAATTA INDIRECT TF BEFORE AFTER

    CAGCTG CAGCTG XYZ XYZ vs. How do transcription factors recognize their binding sites in a given cell type?
  14. 3’ 3’ exonuclease crosslink Exo denatured protein 3’ 3’ Exo

    Exo Exo Exo ChIP-exo captures protein-DNA crosslinking points CTCF ChIP-exo CTCF ChIP-seq
  15. Motifs Reb1 (yeast) CTCF (human) p53 (human) -200 +200 -200

    +200 Different protein-DNA binding events have different ChIP-exo patterns
  16. Direct binding Indirect (tethered) binding A B DNA A Crosslinking

    Crosslinking patterns may distinguish direct and indirect protein-DNA interactions
  17. TF B ChIP-exo A B TF A ChIP-exo DNA A

    Crosslinking Direct binding Indirect (tethered) binding Crosslinking patterns may distinguish direct and indirect protein-DNA interactions
  18. A B TF A ChIP-exo DNA A TF B ChIP-exo

    Crosslinking Direct binding Indirect (tethered) binding Crosslinking patterns may distinguish direct and indirect protein-DNA interactions
  19. Identify subtypes by clustering • Motifs • ChIP-exo tag distributions

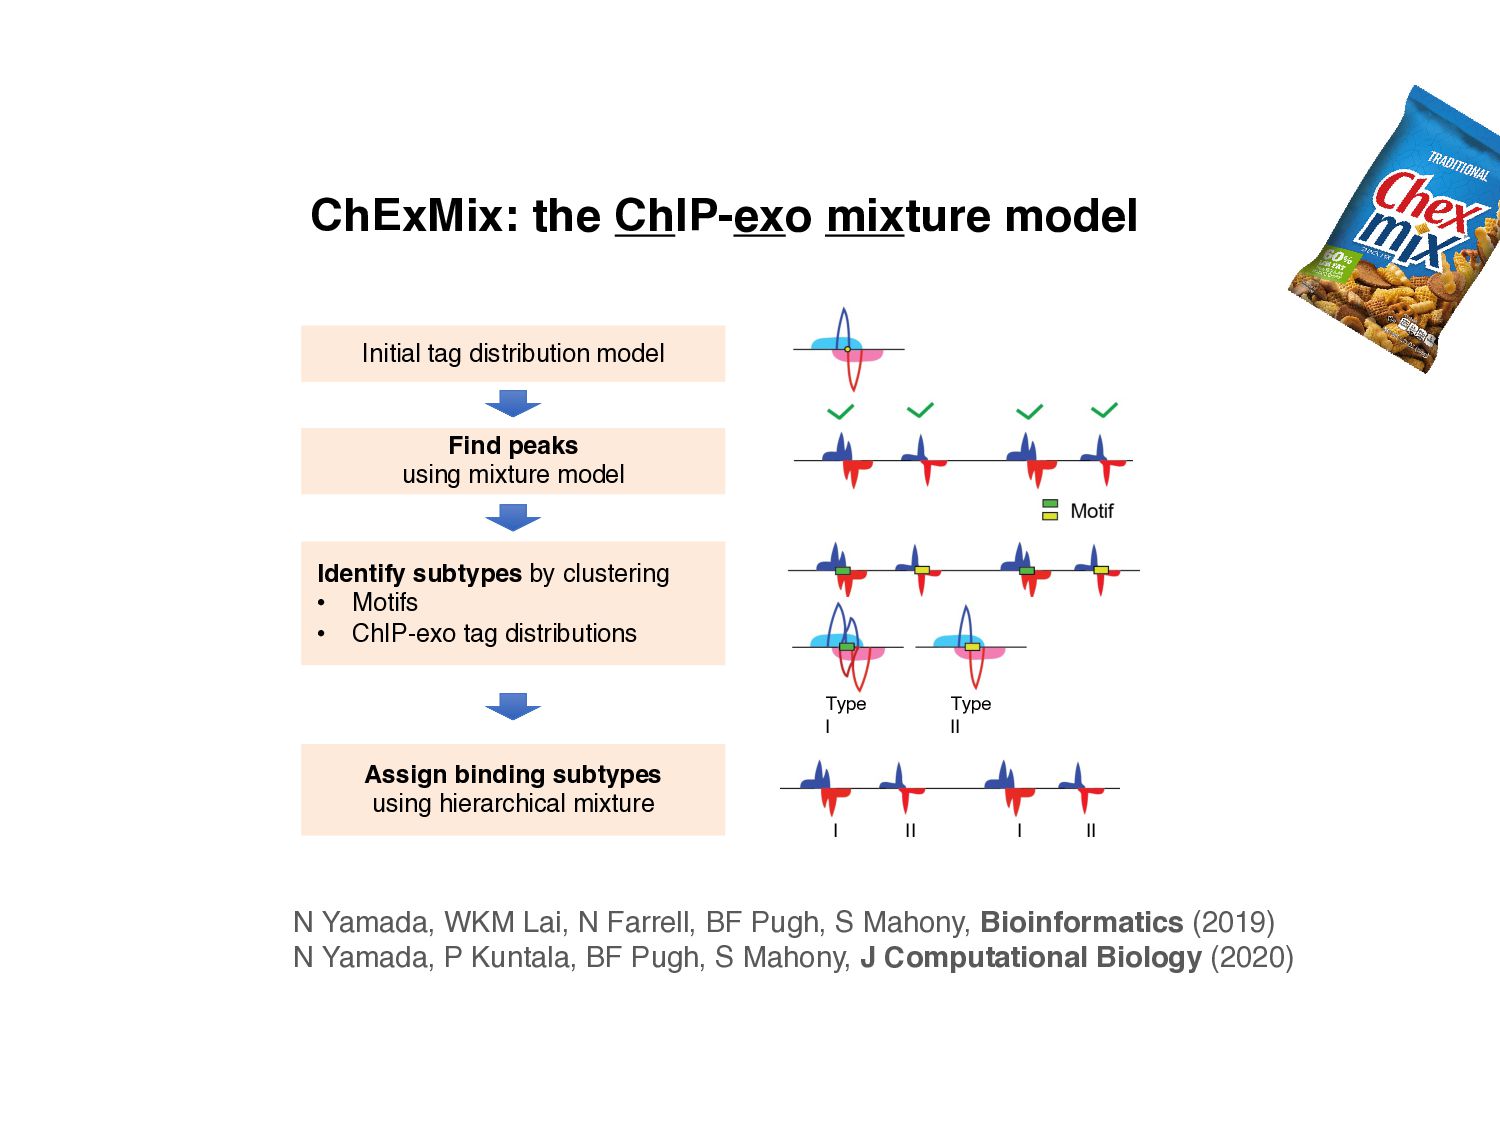
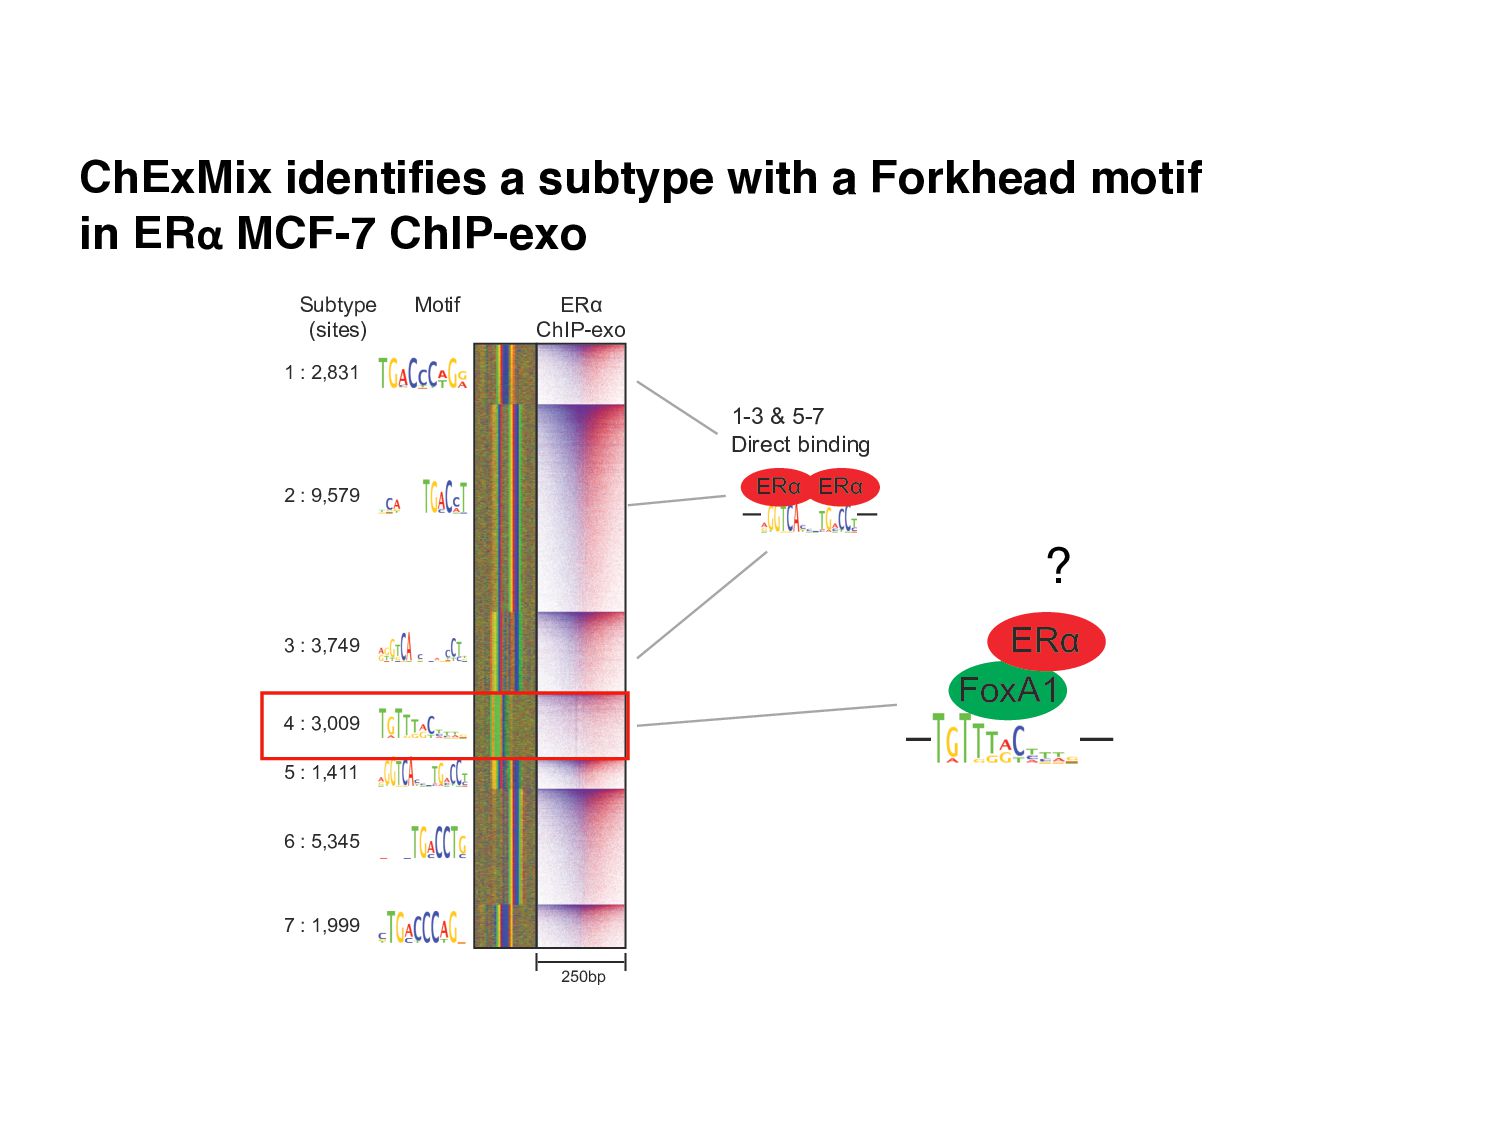
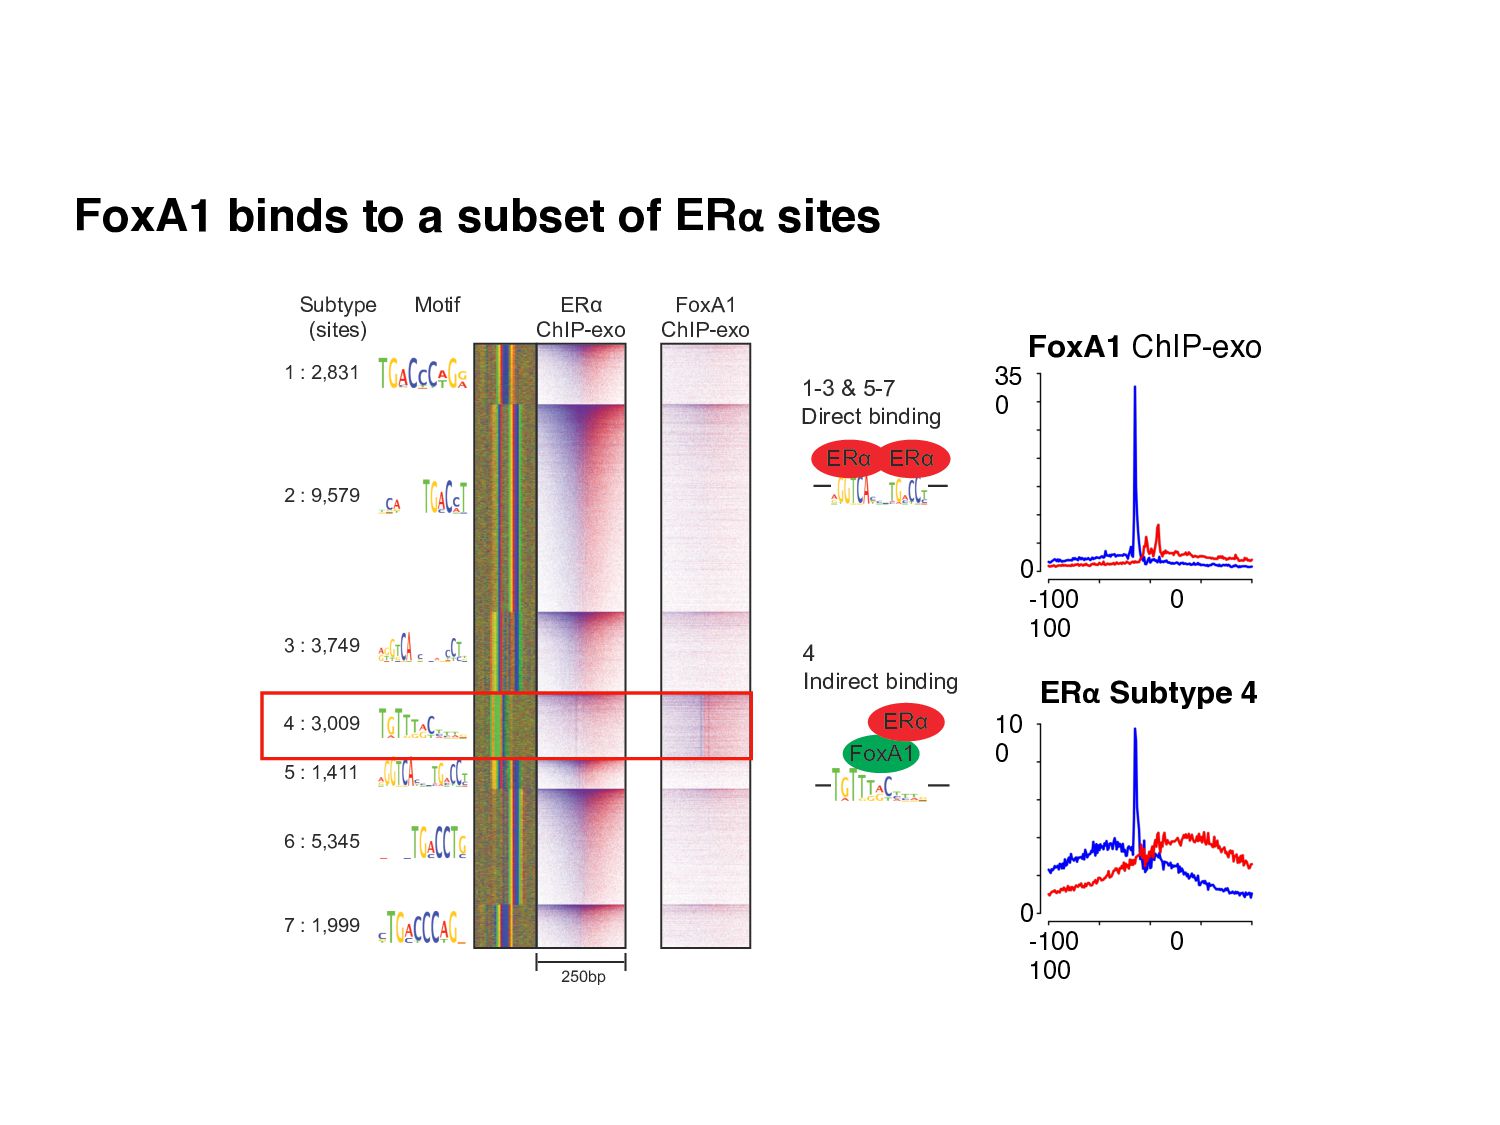
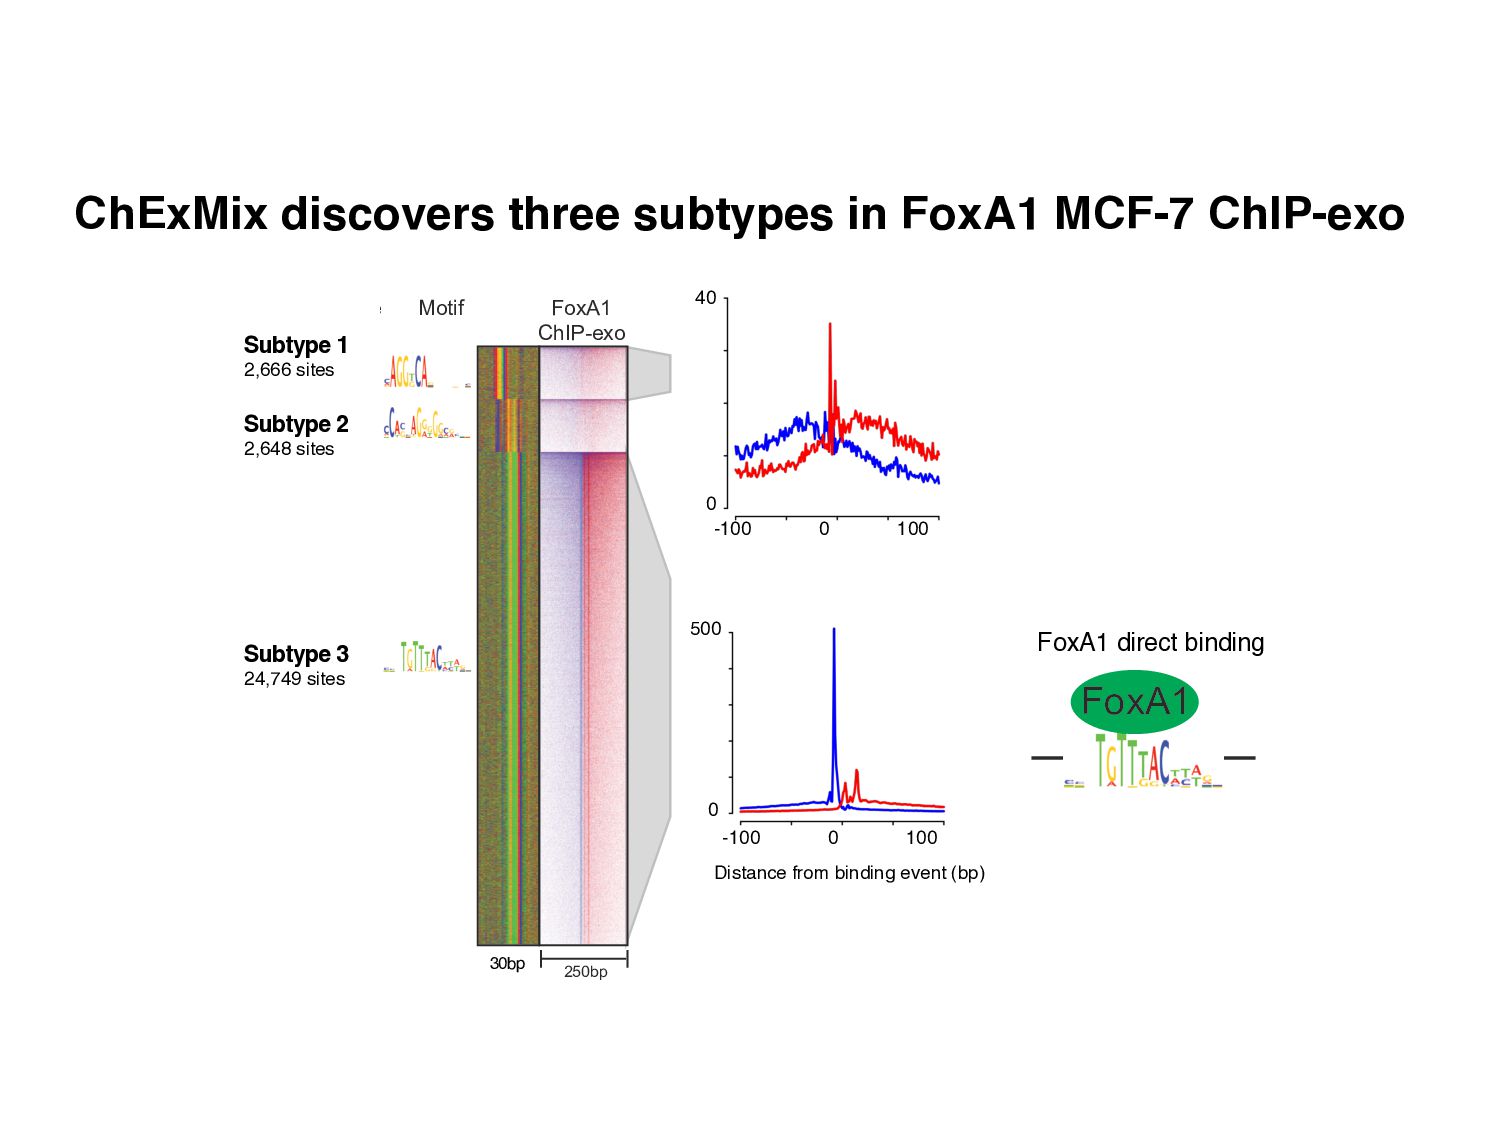
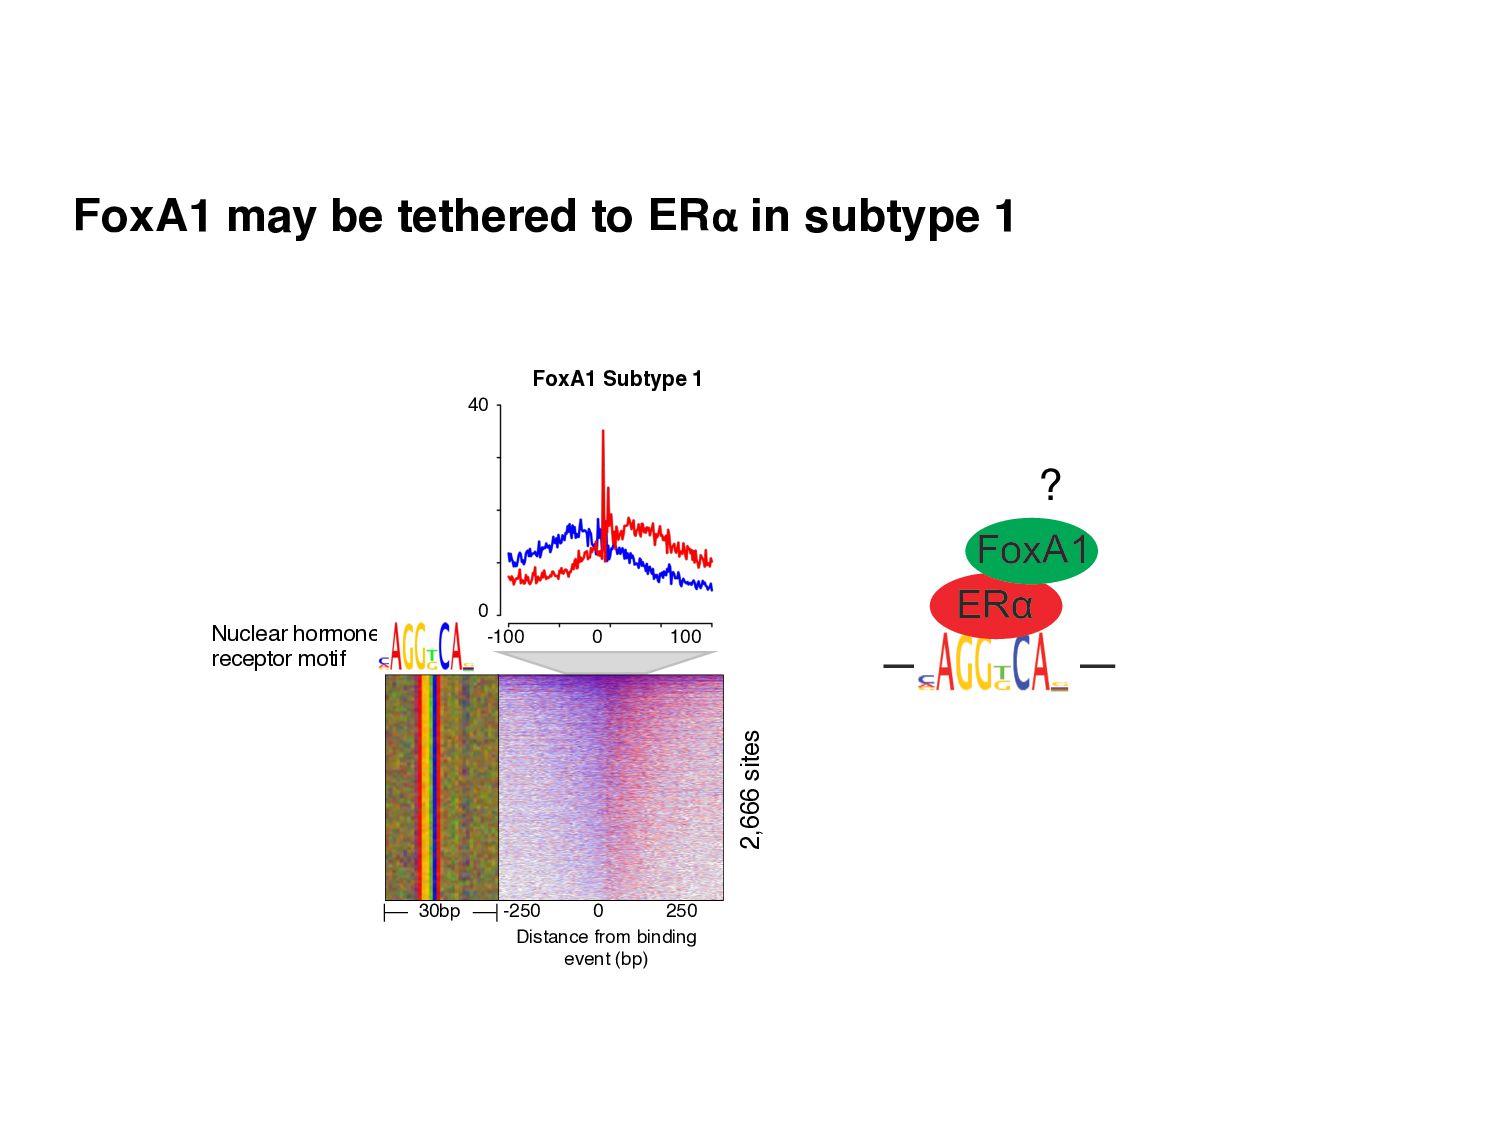
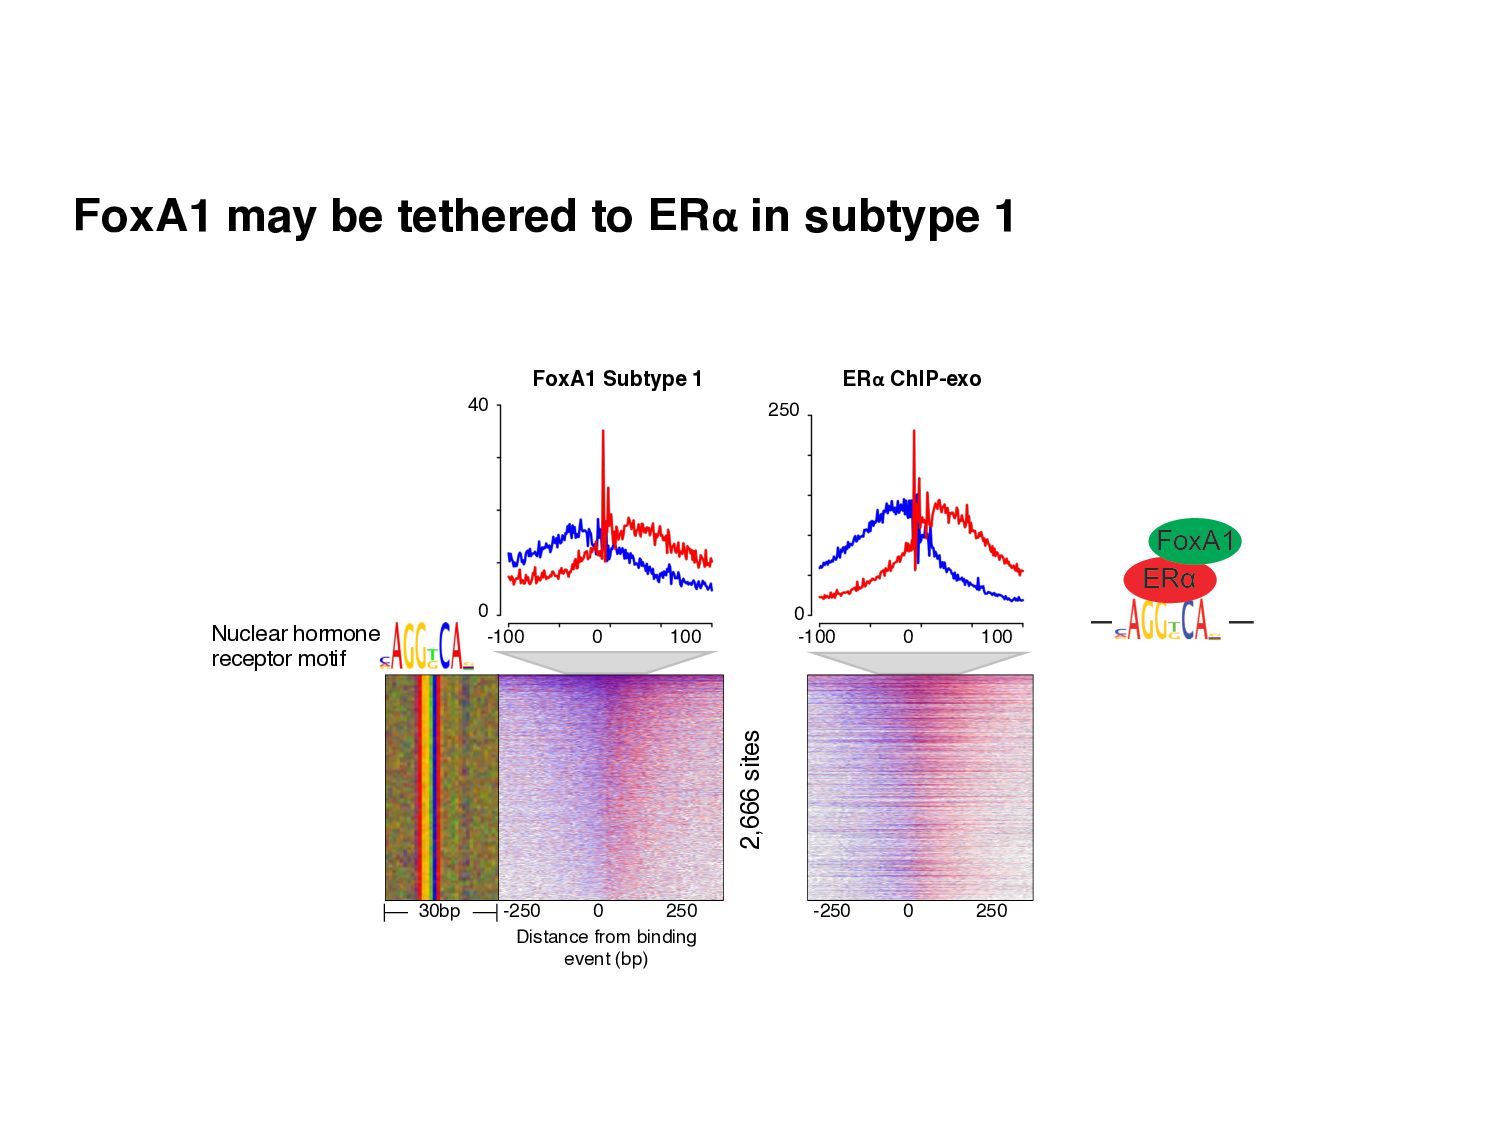
    Initial tag distribution model Find peaks using mixture model Type II Type I Assign binding subtypes using hierarchical mixture II I II I ChExMix: the ChIP-exo mixture model N Yamada, WKM Lai, N Farrell, BF Pugh, S Mahony, Bioinformatics (2019) N Yamada, P Kuntala, BF Pugh, S Mahony, J Computational Biology (2020)
  20. 1 : 2,831 A 2 : 9,579 3 : 3,749

    1 2 C 4 : 3,009 5 : 1,411 6 : 5,345 7 : 1,999 3 4 5 6 7 Motif ERĮ ChIP-exo Subtype (sites) ERĮ tag distribution 100 0 -100 0 100 150 -100 0 100 -100 0 100 -100 0 100 10 100 0 0 0 150 200 -100 0 100 -100 0 100 0 0 0 -100 0 100 Distance from binding event (bp) 120 350 4 FoxA1 ChIP-exo FoxA1 tag distribution -100 0 100 Distance from binding event (bp) 250bp B D E Proposed model 4 Indirect binding 1-3 & 5-7 Direct binding FoxA1 ERĮ ERĮ ERĮ Fig 5 ChExMix identifies a subtype with a Forkhead motif in ERα MCF-7 ChIP-exo 3 4 5 6 7 0 -100 0 100 -100 0 100 -100 0 100 -100 0 100 10 100 0 0 0 150 200 -100 0 100 -100 0 100 0 0 0 -100 0 100 Distance from binding event (bp) 120 -100 0 100 Distance from binding event (bp) 250bp E Proposed model 4 Indirect binding 1-3 & 5-7 Direct binding FoxA1 ERĮ ERĮ ERĮ 1 2 3 4 5 6 7 100 0 -100 0 100 150 -100 0 100 -100 0 100 -100 0 100 10 100 0 0 0 150 200 -100 0 100 -100 0 100 0 0 0 -100 0 100 Distance from binding event (bp) 120 350 4 tag distribution -100 0 100 Distance from binding event (bp) E Proposed model 4 Indirect binding 1-3 & 5-7 Direct binding FoxA1 ERĮ ERĮ ERĮ ?
  21. 1 : 2,831 A 2 : 9,579 3 : 3,749

    1 2 C 4 : 3,009 5 : 1,411 6 : 5,345 7 : 1,999 3 4 5 6 7 Motif ERĮ ChIP-exo Subtype (sites) ERĮ tag distribution 100 0 -100 0 100 150 -100 0 100 -100 0 100 -100 0 100 10 100 0 0 0 150 200 -100 0 100 -100 0 100 0 0 0 -100 0 100 Distance from binding event (bp) 120 350 4 FoxA1 ChIP-exo FoxA1 tag distribution -100 0 100 Distance from binding event (bp) 250bp B D E Proposed model 4 Indirect binding 1-3 & 5-7 Direct binding FoxA1 ERĮ ERĮ ERĮ Fig 5 1 2 C 3 4 5 6 7 Motif ERĮ ChIP-exo e ERĮ tag distribution 100 0 -100 0 100 150 -100 0 100 -100 0 100 -100 0 100 10 100 0 0 0 150 200 -100 0 100 -100 0 100 0 0 0 -100 0 100 Distance from binding event (bp) 120 350 4 FoxA1 ChIP-exo FoxA1 tag distribution -100 0 100 Distance from binding event (bp) 250bp B D E Proposed model 4 Indirect binding 1-3 & 5-7 Direct binding FoxA1 ERĮ ERĮ ERĮ Fig 5 1 2 C 3 4 5 6 7 Motif ERĮ ChIP-exo ERĮ tag distribution 100 0 -100 0 100 150 -100 0 100 -100 0 100 -100 0 100 10 100 0 0 0 150 200 -100 0 100 -100 0 100 0 0 0 -100 0 100 Distance from binding event (bp) 120 350 4 FoxA1 ChIP-exo FoxA1 tag distribution -100 0 100 Distance from binding event (bp) 250bp B D E Proposed model 4 Indirect binding 1-3 & 5-7 Direct binding FoxA1 ERĮ ERĮ ERĮ Fig 5 3 4 5 6 7 -100 0 100 -100 0 100 10 100 0 0 150 200 -100 0 100 -100 0 100 0 0 0 -100 0 100 Distance from binding event (bp) 120 -100 0 100 Distance from binding event (bp) 250bp E Proposed model 4 Indirect binding 1-3 & 5-7 Direct binding FoxA1 ERĮ ERĮ ERĮ FoxA1 ChIP-exo ERα Subtype 4 -100 0 100 -100 0 100 0 0 35 0 10 0 FoxA1 binds to a subset of ERα sites
  22. Motif 1 : 2,666 A FoxA1 ChIP-exo 2 : 2,648

    3 : 24,749 1 2 3 FoxA1 tag distribution C 40 -100 0 100 25 0 0 0 500 Subtype (sites) ERĮ ChIP-exo CTCF ChIP-exo 250bp 250 -100 0 100 -100 0 100 E ERĮ tag distribution -100 0 100 1 0 CTCF tag distribution -100 0 100 40 Distance from binding event (bp) 2 Distance from binding event (bp) Proposed model ERĮ FoxA1 1 Indirect binding CTCF FoxA1 2 Indirect binding 3 Direct binding FoxA1 B D Fig 4 500 0 Distance from binding event (bp) -100 0 100 Subtype 1 2,666 sites Subtype 2 2,648 sites Subtype 3 24,749 sites FoxA1 direct binding 30bp 2 3 00 0 100 00 0 100 00 0 100 -100 0 100 0 CTCF tag distribution -100 0 100 40 Distance from binding event (bp) 2 Distance from binding event (bp) CTCF FoxA1 2 Indirect binding 3 Direct binding FoxA1 ChExMix discovers three subtypes in FoxA1 MCF-7 ChIP-exo 40 -100 0 100 0
  23. 40 -250 0 250 Distance from binding event (bp) Nuclear

    hormone receptor motif -100 0 100 30bp 2,666 sites ERĮ FoxA1 ? FoxA1 Subtype 1 0 FoxA1 may be tethered to ERα in subtype 1
  24. 40 0 -250 0 250 Distance from binding event (bp)

    -100 0 100 30bp -100 0 100 250 ERα ChIP-exo 2,666 sites -250 0 250 ERĮ FoxA1 0 Nuclear hormone receptor motif FoxA1 Subtype 1 FoxA1 may be tethered to ERα in subtype 1
  25. The genome is topologically organized in 3-dimensional space • 3-D

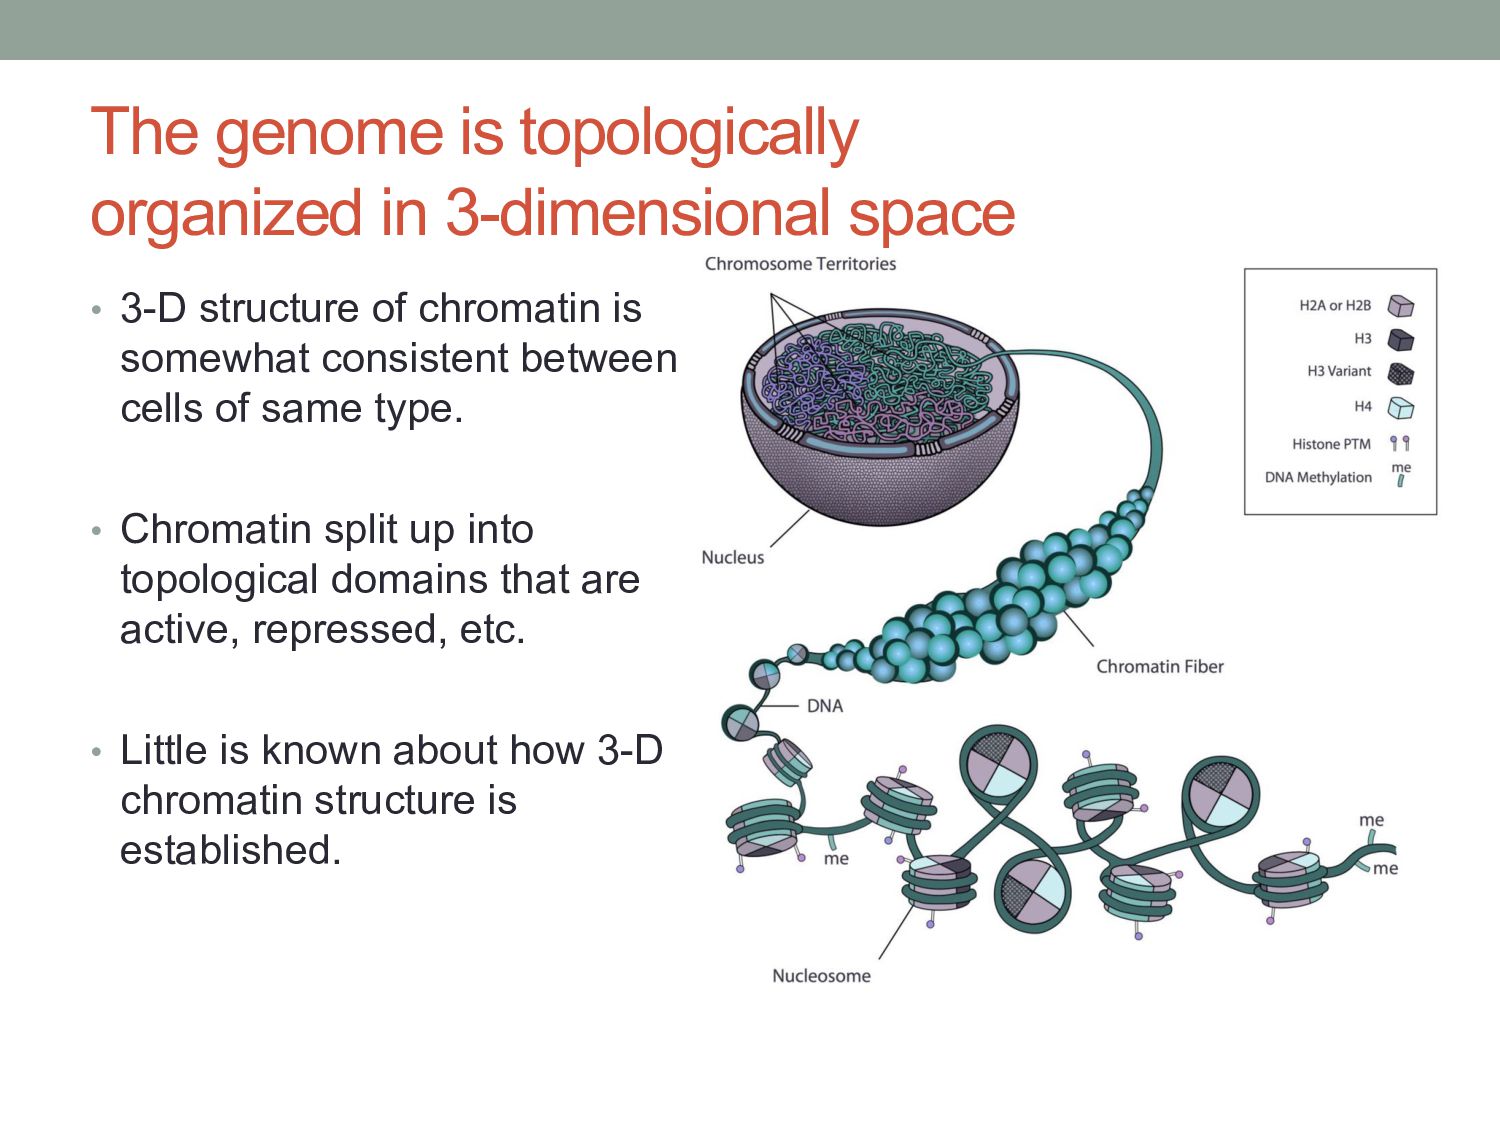
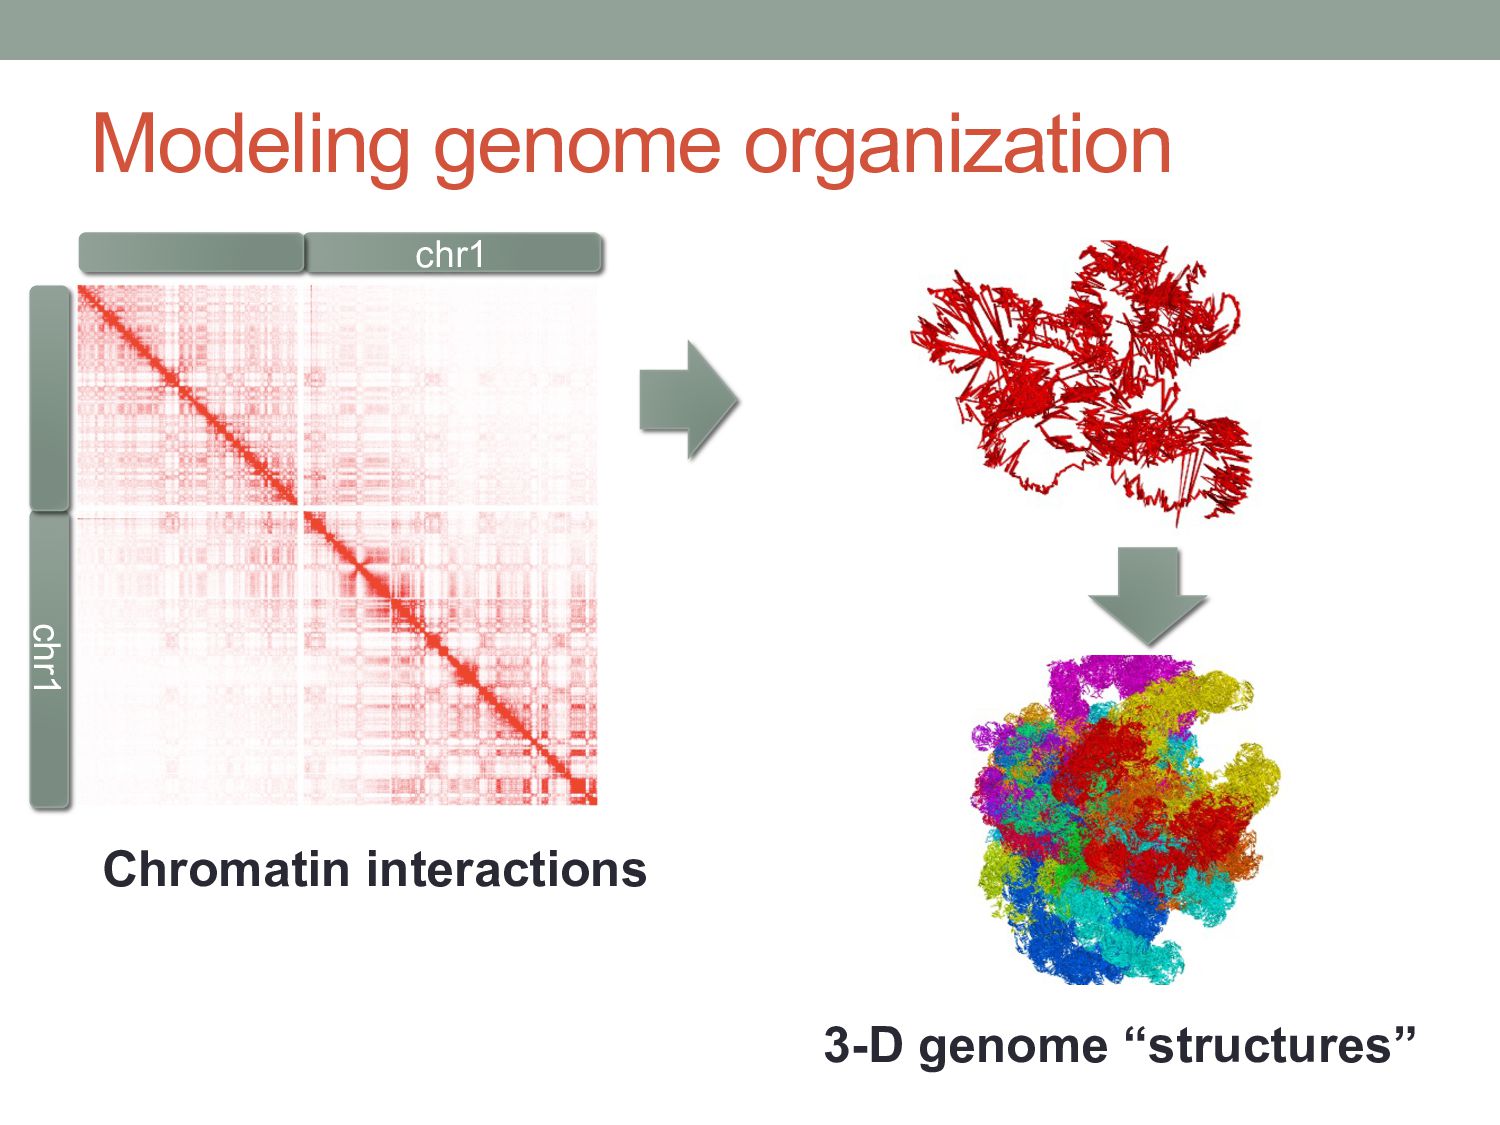
    structure of chromatin is somewhat consistent between cells of same type. • Chromatin split up into topological domains that are active, repressed, etc. • Little is known about how 3-D chromatin structure is established.
  26. 3-D genome structure corresponds to regulatory activity levels Active Inactive

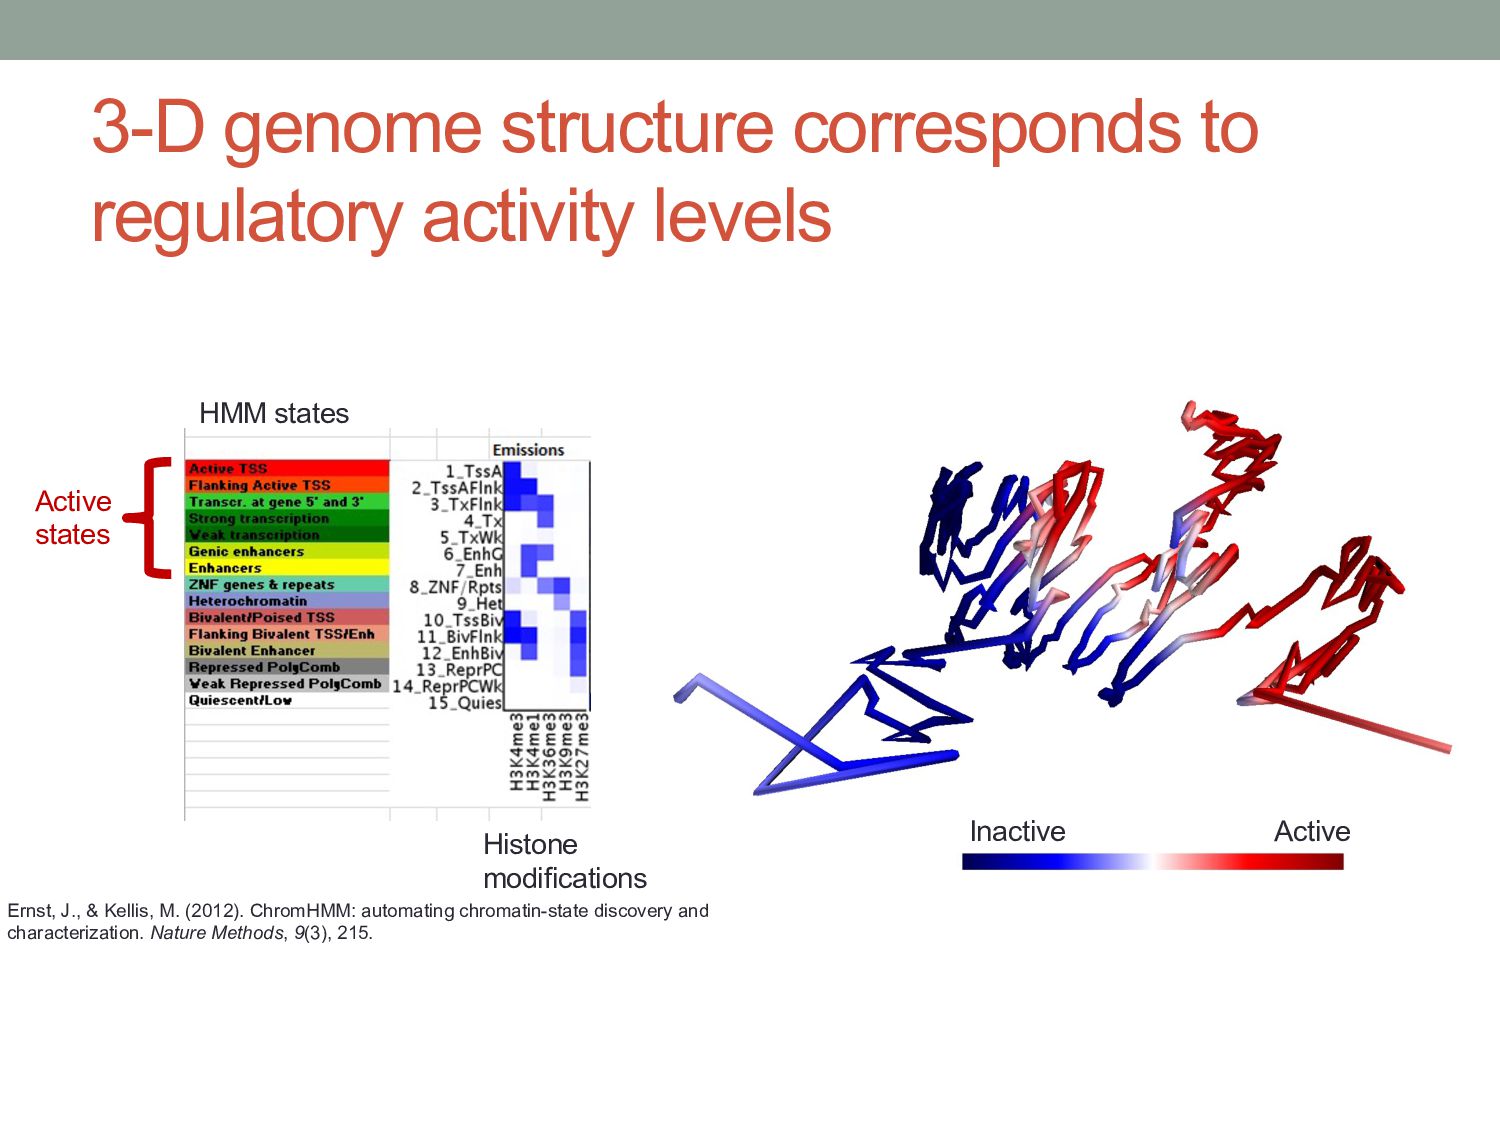
    Active states HMM states Histone modifications Ernst, J., & Kellis, M. (2012). ChromHMM: automating chromatin-state discovery and characterization. Nature Methods, 9(3), 215.
  27. Further reading • Park PJ “ChIP-seq: advantages and disadvantages of

    a maturing technology”, Nature Reviews Genetics (2009) 10(10):669-680 • Mahony S & Pugh BF “Protein-DNA binding in high resolution”, Critical Reviews in Biochemistry and Molecular Biology (2015) 4:269-283 • Dekker, et al., “Exploring the three-dimensional organization of genomes: interpreting chromatin interaction data”, Nature Reviews Genetics (2013)