Upgrade to Pro — share decks privately, control downloads, hide ads and more …

Mosquito Control Through Watershed Analysis

Mosquito Control Through Watershed Analysis

Presented by:
Jeremiah Johnson - Surveying And Mapping, LLC

More Decks by Texas Natural Resources Information System

Other Decks in Technology

Transcript

  1. The problem October 30, 2014 2 •  New upper-class neighborhood

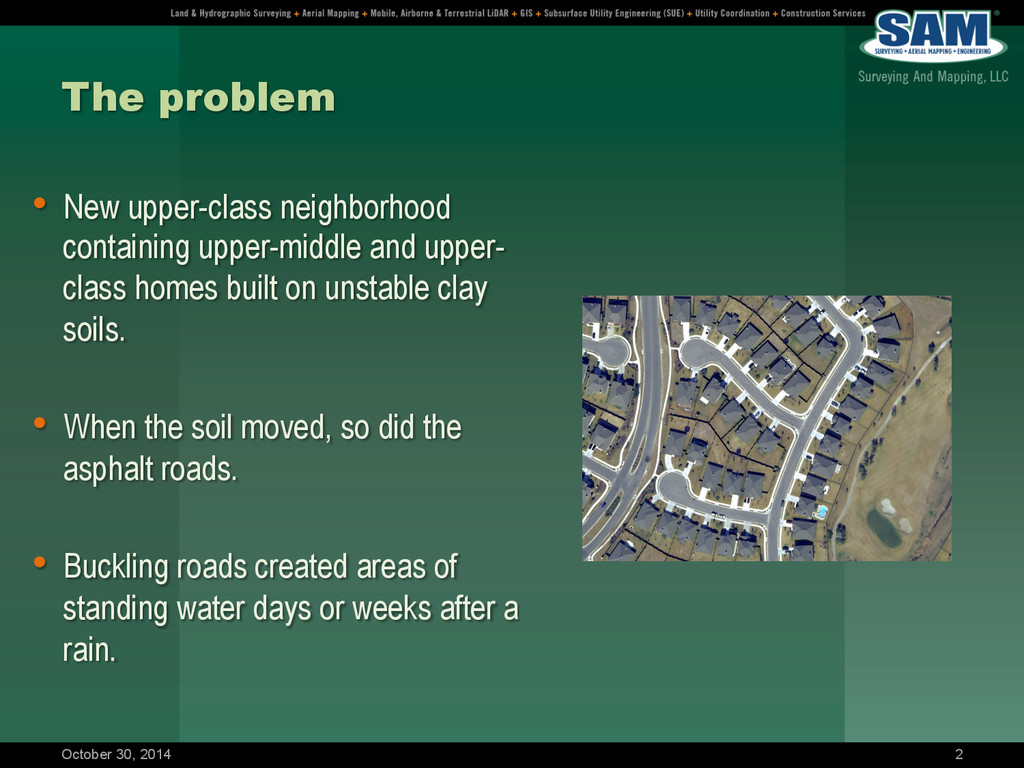
    containing upper-middle and upper- class homes built on unstable clay soils. •  When the soil moved, so did the asphalt roads. •  Buckling roads created areas of standing water days or weeks after a rain.
  2. The problem October 30, 2014 3 •  Mosquitos lay eggs

    in stagnant water. •  Female mosquitos prefer to lay their eggs in rain water.
  3. The proposed solution •  Utilize mobile LiDAR to generate an

    engineering-grade point cloud of the road surface. •  Use ArcGIS Spatial Analyst tools to find road imperfections. October 30, 2014 4
  4. Why LiDAR? •  While one can always drive around taking

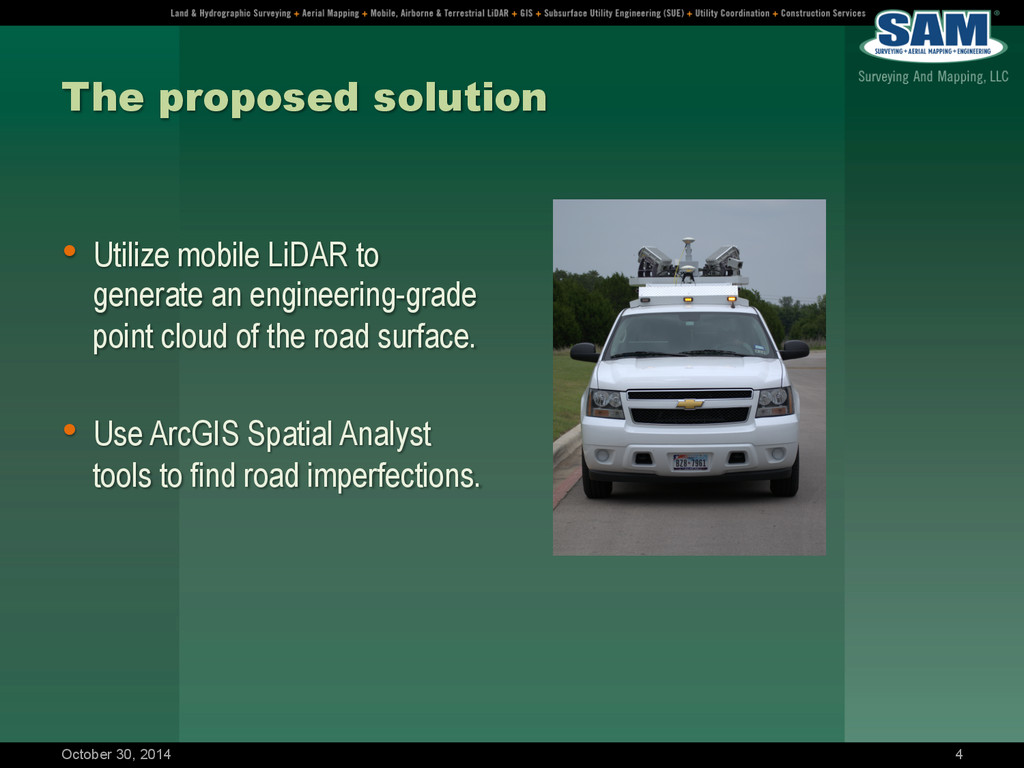
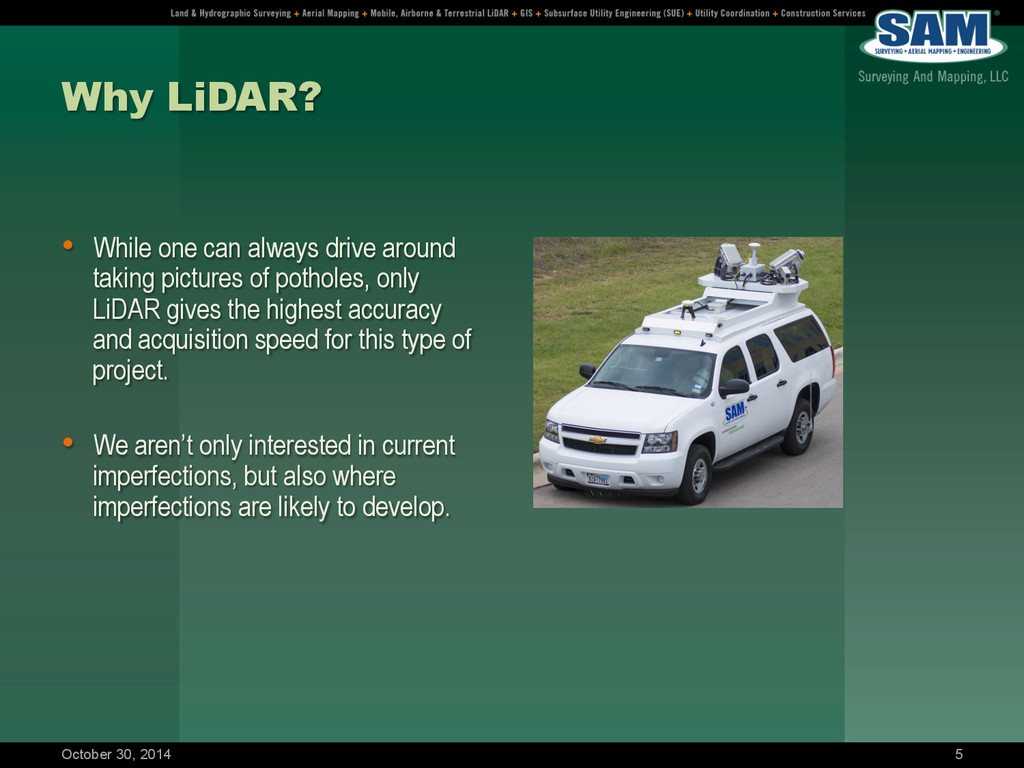
    pictures of potholes, only LiDAR gives the highest accuracy and acquisition speed for this type of project. •  We aren’t only interested in current imperfections, but also where imperfections are likely to develop. October 30, 2014 5
  5. The system •  Optech Lynx M1 •  Engineering-grade LiDAR with

    a rate of one million points per second October 30, 2014 6
  6. Intro to watersheds •  “An area or ridge of land

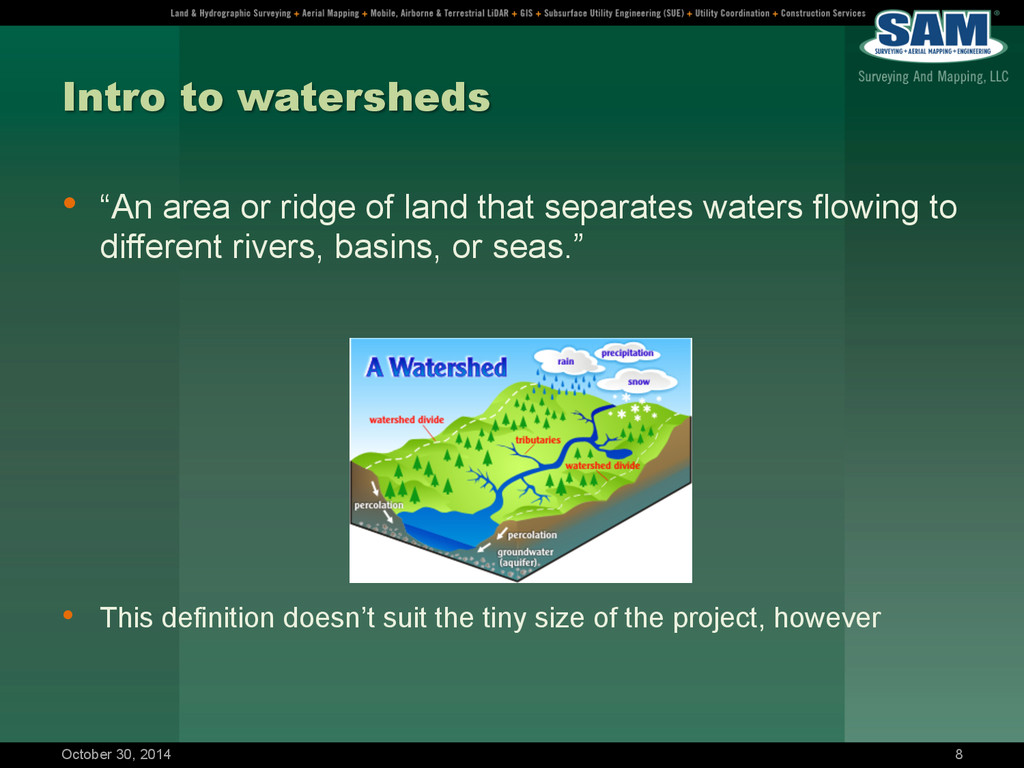
    that separates waters flowing to different rivers, basins, or seas.” October 30, 2014 8 •  This definition doesn’t suit the tiny size of the project, however
  7. Intro to micro-watersheds •  “The smallest hydrologic unit in the

    hierarchal system is termed as micro-watershed having size of 500-1000 ha.” October 30, 2014 9 •  This definition STILL doesn’t suit the tiny size of the project. Our watersheds will be an estimated 2-10 ft2 •  Perhaps we need to rename the presentation…
  8. Texas Firm Registration No. 10064300 EXPERIMENT: CAN ARCGIS HYDROLOGY TOOLS

    ANALYZE DATA IN A VERY SMALL AREA? October 30, 2014 11
  9. LAS Dataset to Contours •  Very useful for human interpretation

    as well as quick to draw and create, but it is essentially decimating the data and we might lose some smaller imperfections. October 30, 2014 12
  10. LAS Dataset to TIN •  High resolution TIN created from

    the processed point cloud. October 30, 2014 13
  11. LAS Dataset to TIN •  More useful for human interpretation,

    very dense and detailed, but time consuming and difficult to automate analysis. October 30, 2014 14
  12. LAS Dataset to Raster •  0.06 foot resolution 3D raster

    results in a dataset that’s dense, quick to load, and best of all, easy for the computer to analyze. October 30, 2014 15
  13. LAS Dataset to Raster •  Different types of road surfaces

    (concrete and asphalt) are still visible October 30, 2014 16
  14. Final hydrology analysis workflow •  After creating the elevation raster,

    create a flow direction raster. October 30, 2014 18
  15. Hydrology analysis workflow •  Using the flow direction raster, create

    a flow accumulation raster. This raster shows where water will accumulate when it rains. Bingo! October 30, 2014 19
  16. Hydrology analysis workflow •  The flow accumulation algorithm is so

    good, it shows areas that weren’t immediately obvious in the dense TIN. October 30, 2014 20
  17. Final deliverable •  Using a custom raster to polygon tool

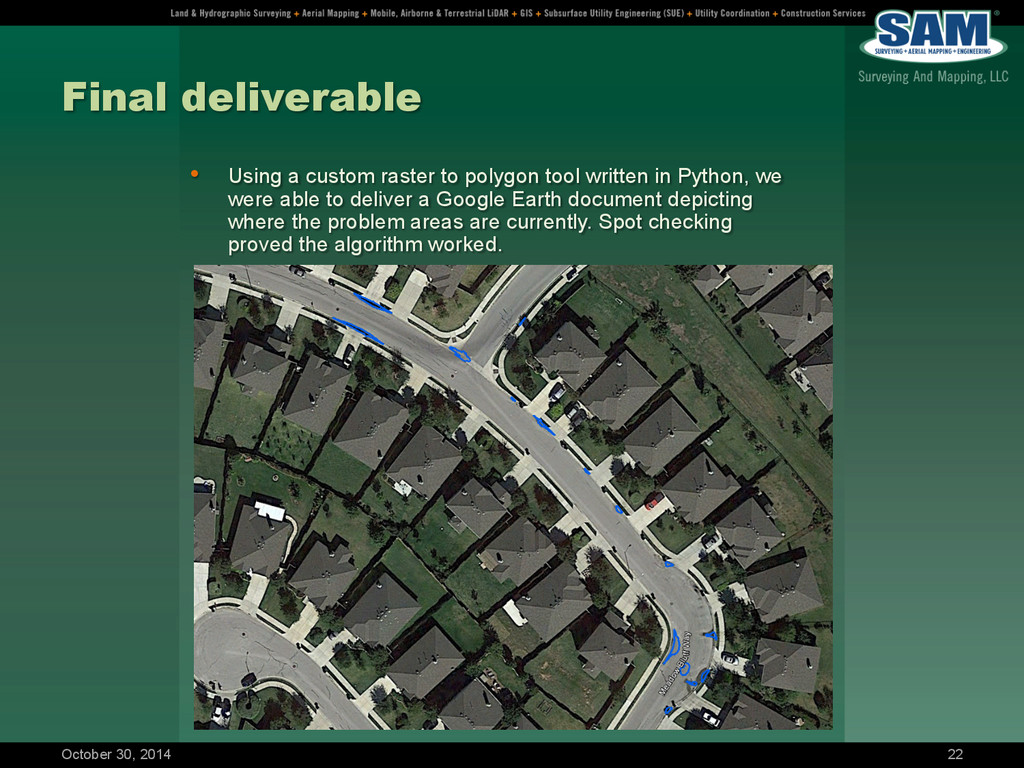
    written in Python, we were able to deliver a Google Earth document depicting where the problem areas are currently. Spot checking proved the algorithm worked. October 30, 2014 22
  18. Final deliverable •  We were also able to rate the

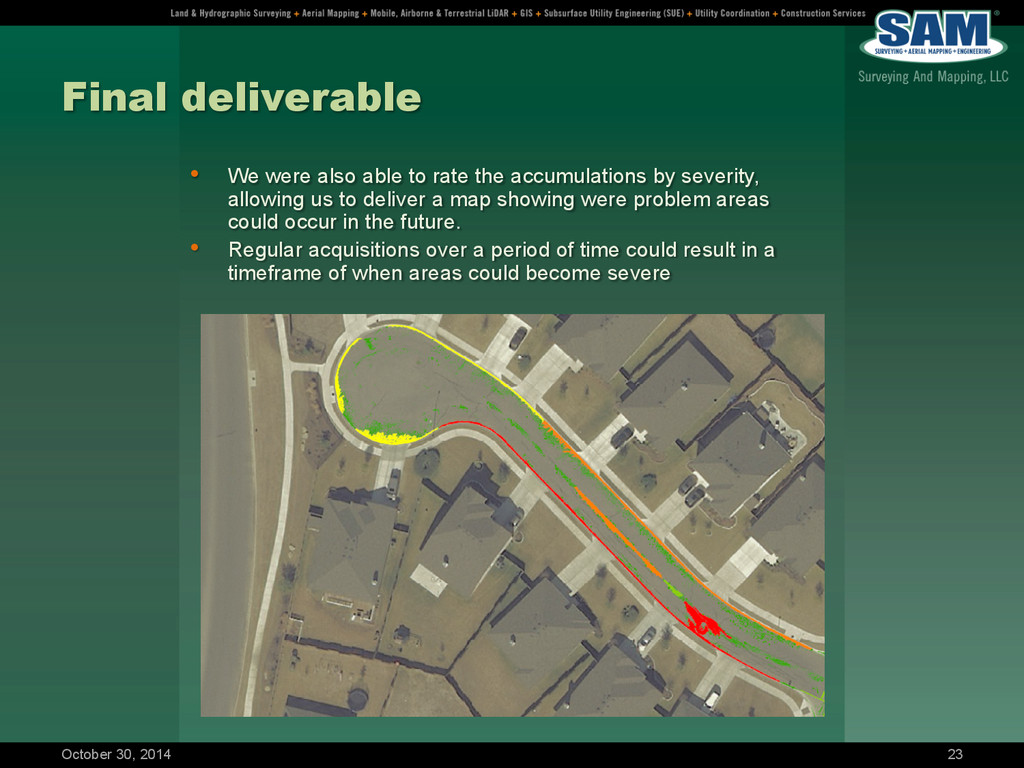
    accumulations by severity, allowing us to deliver a map showing were problem areas could occur in the future. •  Regular acquisitions over a period of time could result in a timeframe of when areas could become severe October 30, 2014 23