Upgrade to Pro — share decks privately, control downloads, hide ads and more …

The Community College Student

The Community College Student

Delivered to ALOP 282 Seminar at Drake University on March 6, 2010.

Tom Schenk Jr

June 01, 2012
Tweet

More Decks by Tom Schenk Jr

Other Decks in Education

Transcript

  1. Enrollment increased to a new record high of 133,387, an

    increase of 4.1 percent over last year. The increase was the highest since 2004 and coincided with the 2007-2008 recession. Fiscal Year Enrollment 2
  2. Enrollment exploded to a record high of 100,736 students, an

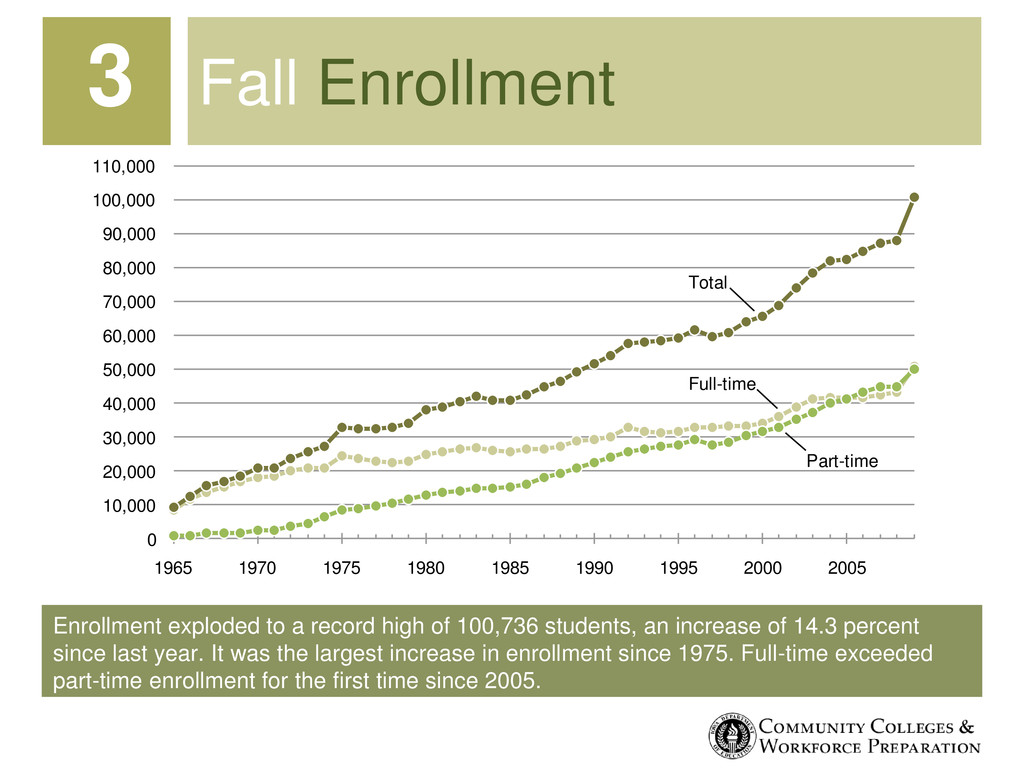
    increase of 14.3 percent since last year. It was the largest increase in enrollment since 1975. Full-time exceeded part-time enrollment for the first time since 2005. Fall Enrollment 3 0 10,000 20,000 30,000 40,000 50,000 60,000 70,000 80,000 90,000 100,000 110,000 1965 1970 1975 1980 1985 1990 1995 2000 2005 Total Full-time Part-time
  3. The average student age was 24 years-old and the median

    was 20 years-old. The dark shaded region shows the Millennial’s are the predominate population, followed by generation X (tan) and baby boomers (olive). Age Distribution 4 0% 2% 4% 6% 8% 10% 12% 14% 16% 14 16 18 20 22 24 26 28 30 32 34 36 38 40 42 44 46 48 50 52 54 56 58 60 62 64 66 68 70 72 74 76 78 80
  4. College parallel, as in previous years, is the largest program

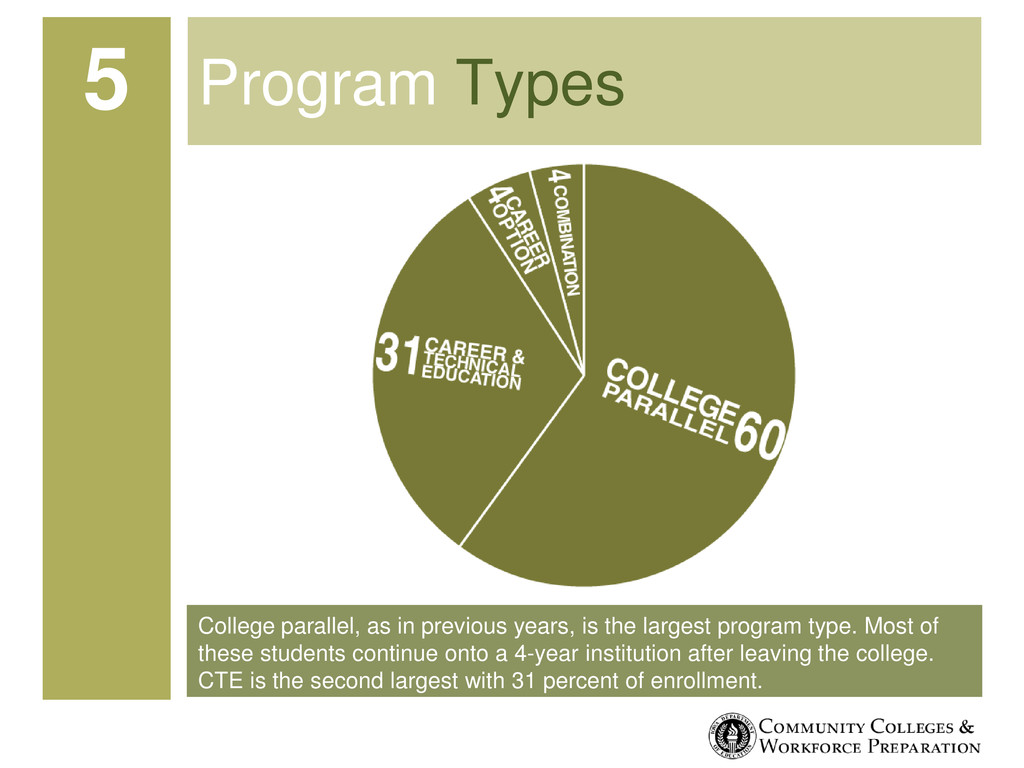
    type. Most of these students continue onto a 4-year institution after leaving the college. CTE is the second largest with 31 percent of enrollment. Program Types 5
  5. Enrollment Demographics 6 55% 71% 88% 97% of students are

    FEMALE of students are RESIDENTS of students are WHITE of students are UNDER 25
  6. Enrollment grew 16.1 percent to 42,694 students. Thirty-two percent of

    students enroll in one or more online course in 2009 compared to 29 percent in 2008. Online Enrollment 7 26.0% 74.0% 29.0% 71.0% 32% 68%
  7. The average age for students who enroll online is 25.5

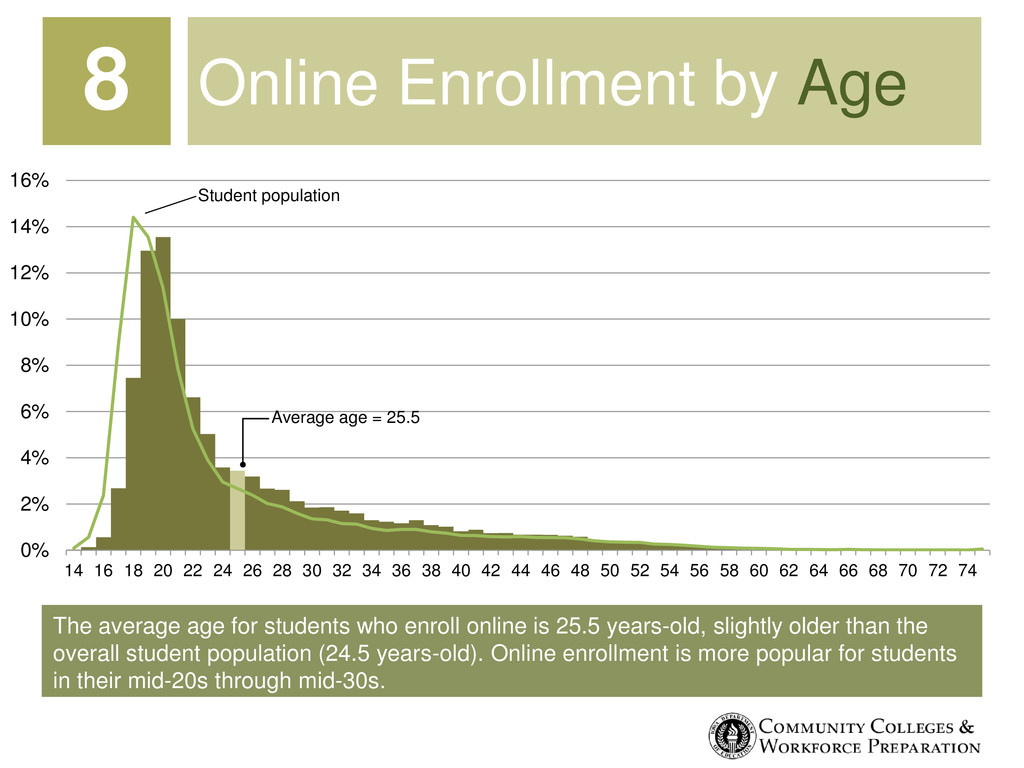
    years-old, slightly older than the overall student population (24.5 years-old). Online enrollment is more popular for students in their mid-20s through mid-30s. Online Enrollment by Age 8 0% 2% 4% 6% 8% 10% 12% 14% 16% 14 16 18 20 22 24 26 28 30 32 34 36 38 40 42 44 46 48 50 52 54 56 58 60 62 64 66 68 70 72 74 Average age = 25.5 Student population
  8. Joint enrollment grew 4.5 in 2008 to 31,450 students. Although

    enrollment grew, it grew at a slower rate than prior years. Joint Enrollment 9 0 5,000 10,000 15,000 20,000 25,000 30,000 35,000 40,000 2004 2005 2006 2007 2008 2009
  9. Most joint enrollees are enrolled through contractual agreements (e.g., 28E’s),

    followed by Postsecondary Enrollment Option (PSEO), and tuition payment. Arrangement Type 10
  10. Most joint enrollees, 58 percent, were high school seniors while

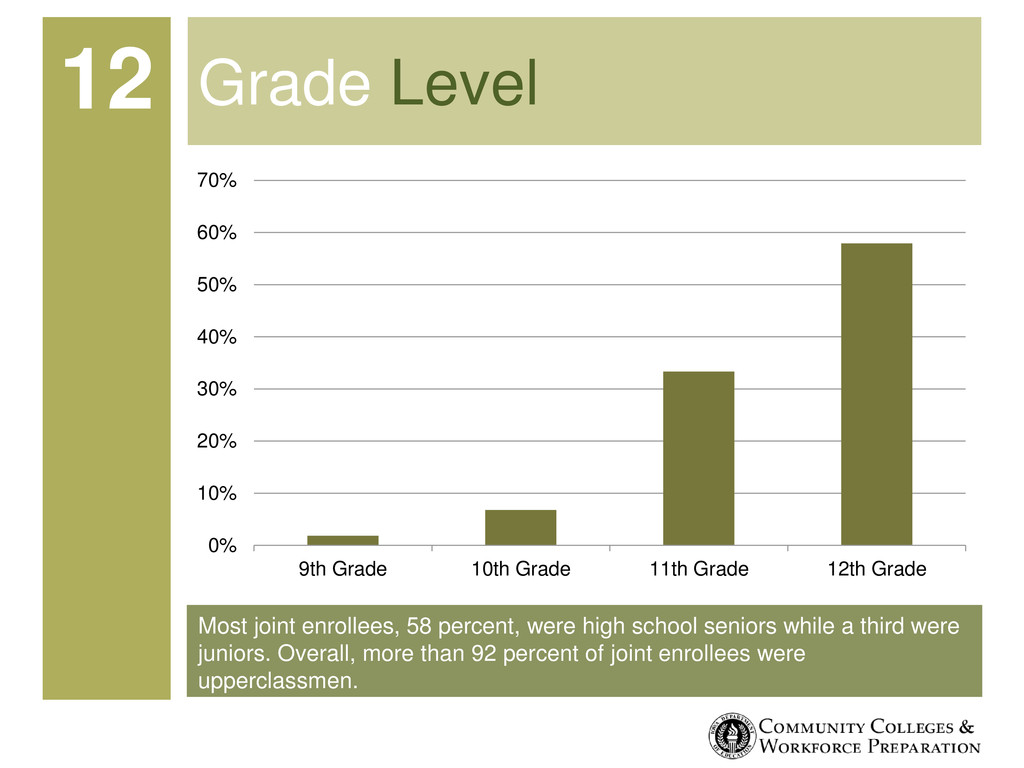
    a third were juniors. Overall, more than 92 percent of joint enrollees were upperclassmen. Grade Level 12 0% 10% 20% 30% 40% 50% 60% 70% 9th Grade 10th Grade 11th Grade 12th Grade
  11. Joint enrollees had a higher average ACT composite score than

    Iowa’s seniors. Joint enrollees scored 22.8 on the ACT, which was higher than Iowa’s seniors at a statistically significant level. ACT Scores 13 0% 1% 2% 3% 4% 5% 6% 7% 8% 9% 10% 1 2 3 4 5 6 7 8 9 101112131415161718192021222324252627282930313233343536 Joint enrollees= 22.8 Iowa seniors= 21.9
  12. Community colleges granted 14,336 awards last year, a 0.3 percent

    decrease. Associate’s degrees were the largest category of awards. Student Awards 0 2,000 4,000 6,000 8,000 10,000 12,000 14,000 16,000 2000 2001 2002 2003 2004 2005 2006 2007 2008 2009 14 Associate’s Diploma Certificate Other
  13. The three year graduation rate for first-time, full-time students rose

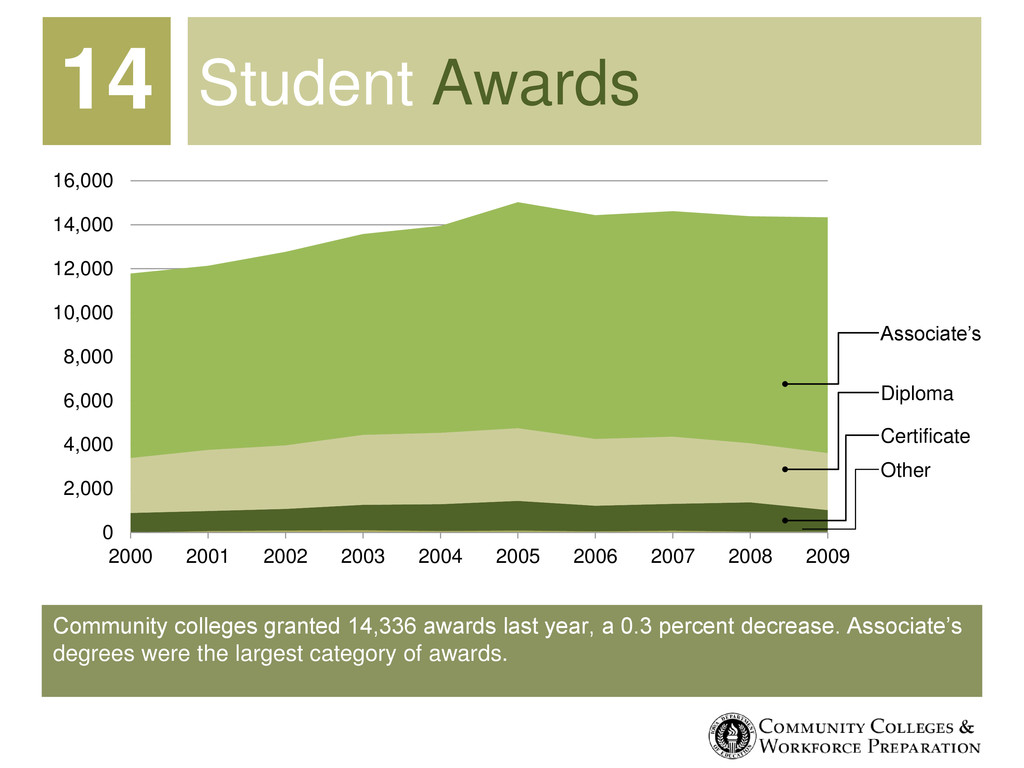
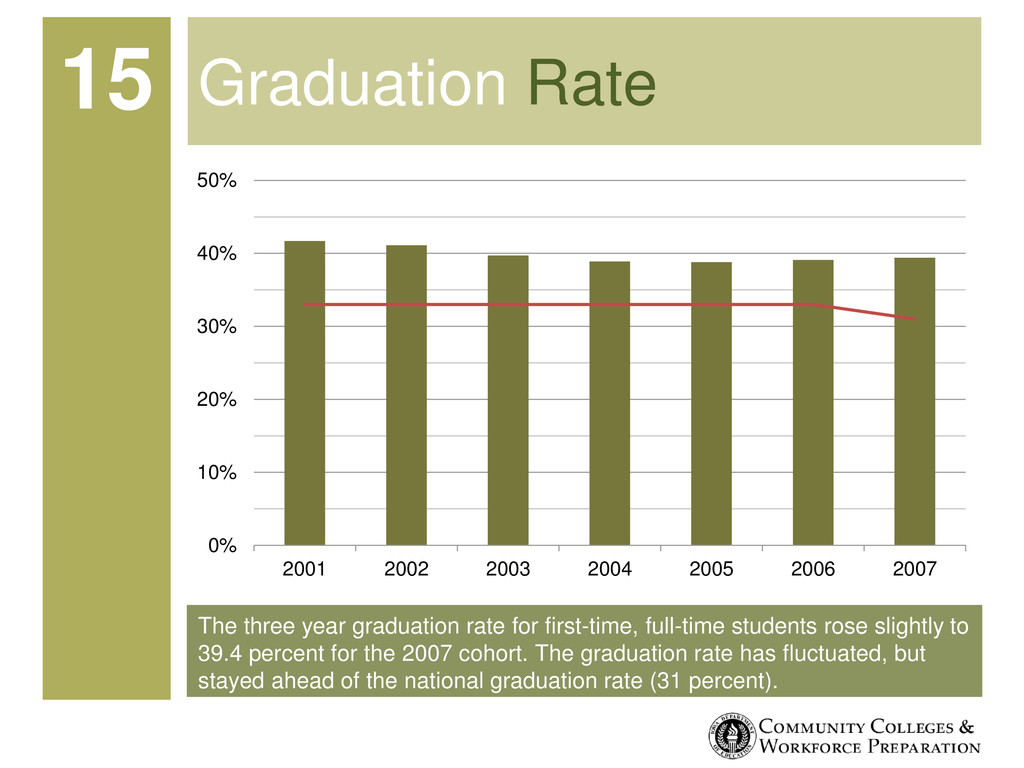
    slightly to 39.4 percent for the 2007 cohort. The graduation rate has fluctuated, but stayed ahead of the national graduation rate (31 percent). Graduation Rate 15 0% 10% 20% 30% 40% 50% 2001 2002 2003 2004 2005 2006 2007
  14. Thirty-nine percent of first-time, full-time students graduate within three years.

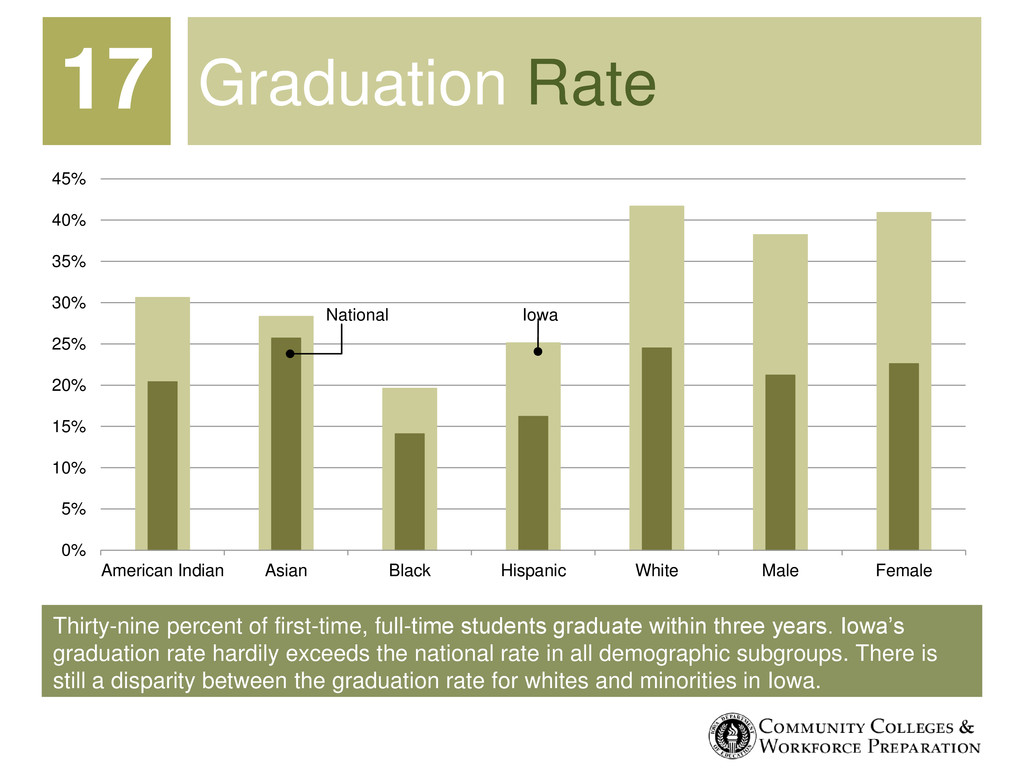
    Iowa’s graduation rate hardily exceeds the national rate in all demographic subgroups. There is still a disparity between the graduation rate for whites and minorities in Iowa. Graduation Rate 17 0% 5% 10% 15% 20% 25% 30% 35% 40% 45% American Indian Asian Black Hispanic White Male Female Iowa National
  15. The rate of return for all completers was 6 percent.

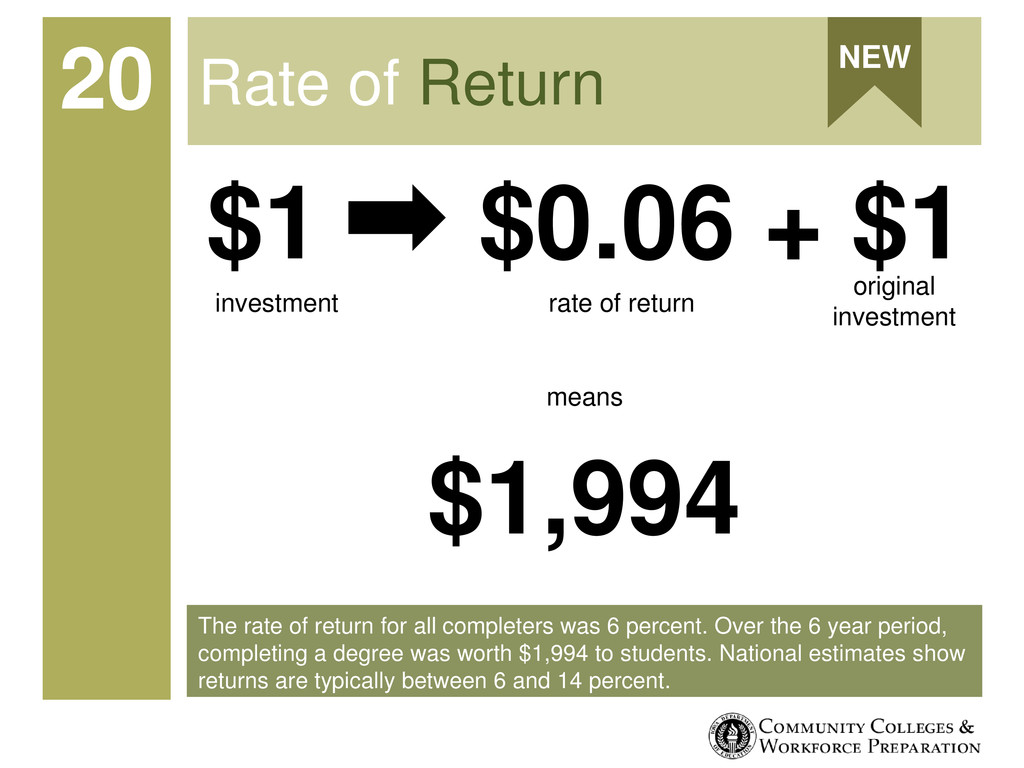
    Over the 6 year period, completing a degree was worth $1,994 to students. National estimates show returns are typically between 6 and 14 percent. Rate of Return 20 NEW $1 $0.06 + $1 investment rate of return original investment $1,994 means
  16. The average time to degree for all students is 2.4

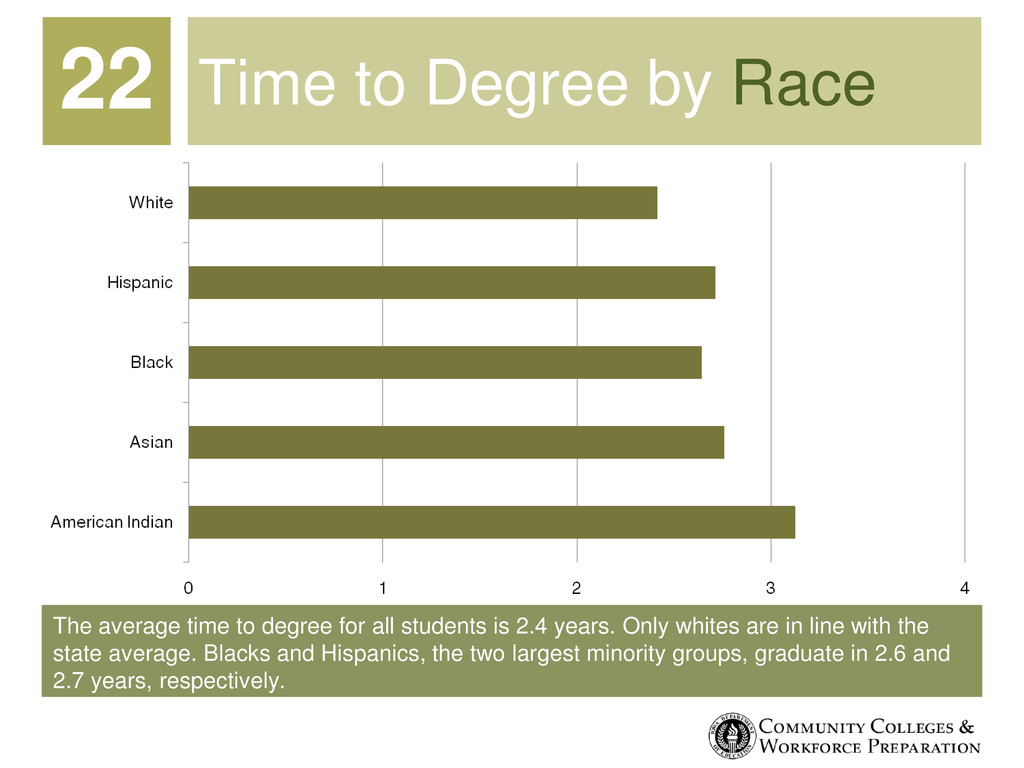
    years. Only whites are in line with the state average. Blacks and Hispanics, the two largest minority groups, graduate in 2.6 and 2.7 years, respectively. Time to Degree by Race 22
  17. Slightly over 53 percent of first-time, full-time students entering in

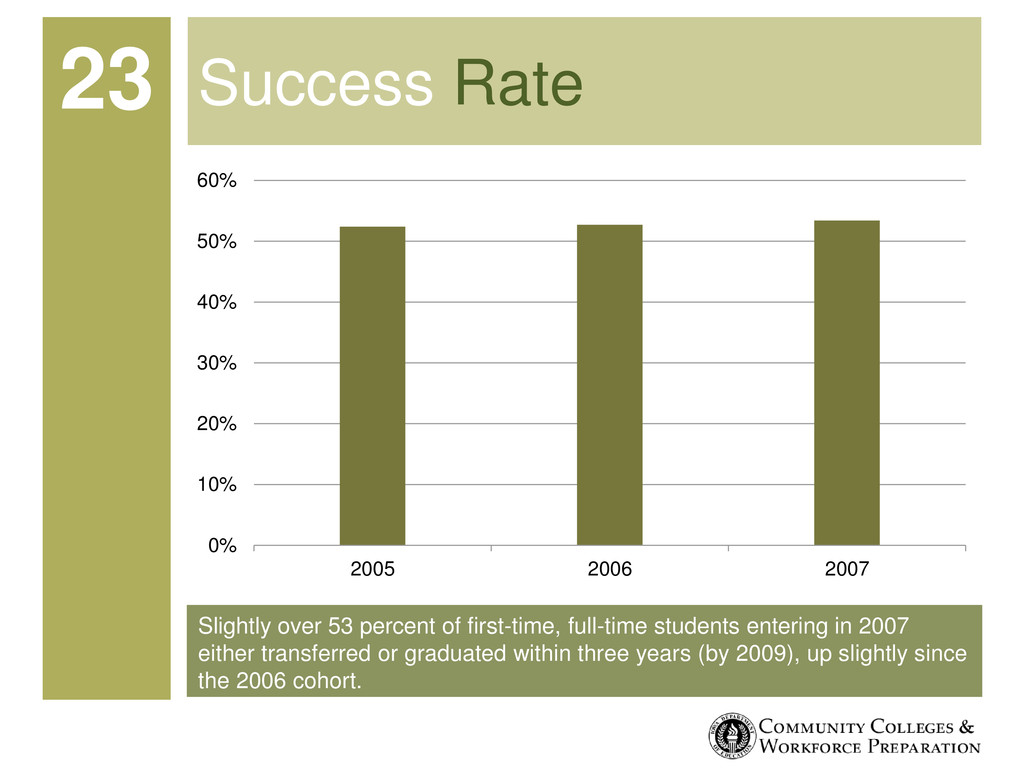
    2007 either transferred or graduated within three years (by 2009), up slightly since the 2006 cohort. Success Rate 23 0% 10% 20% 30% 40% 50% 60% 2005 2006 2007
  18. Fifty-three percent of all community college students graduate or transfer

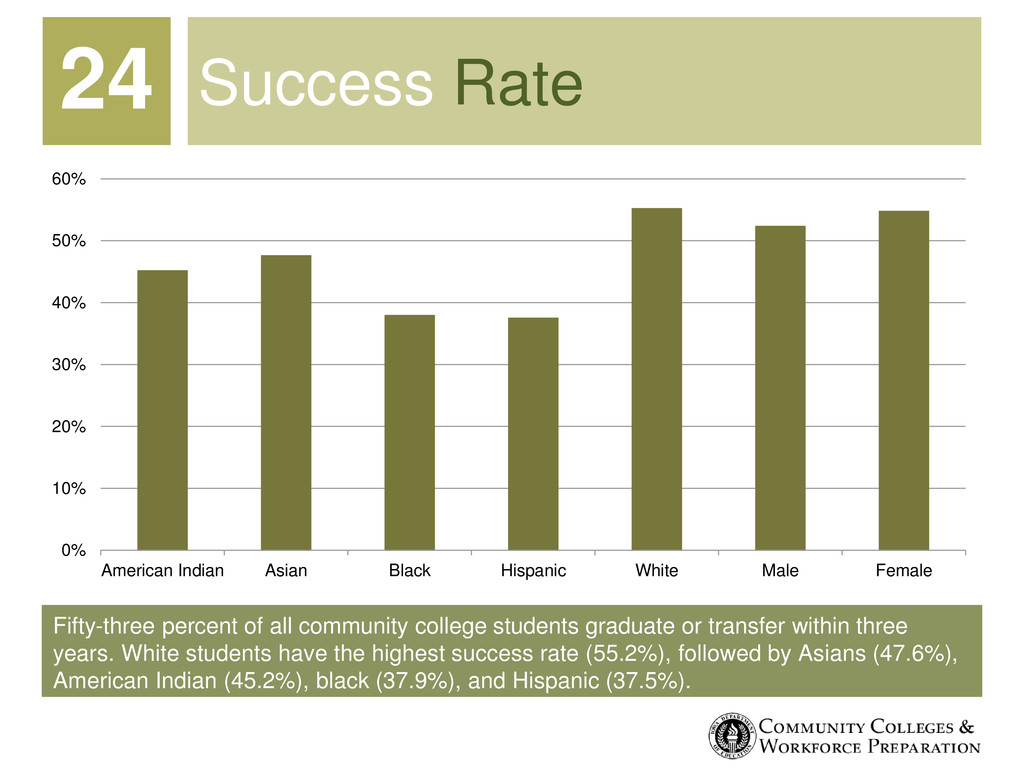
    within three years. White students have the highest success rate (55.2%), followed by Asians (47.6%), American Indian (45.2%), black (37.9%), and Hispanic (37.5%). Success Rate 24 0% 10% 20% 30% 40% 50% 60% American Indian Asian Black Hispanic White Male Female
  19. Enrollment in adult literacy declined 3.4 percent to 28,014 students.

    Adult Literacy Enrollment 26 0 5,000 10,000 15,000 20,000 25,000 30,000 35,000 2005 2006 2007 2008 2009
  20. In 2008, 361 students indicated they wished to enter employment

    after completing an adult literacy program. Eighty-two percent of those students successfully entered employment upon completion. Enter Employment 27
  21. In 2008, 411 adult literacy students indicated intent to transition

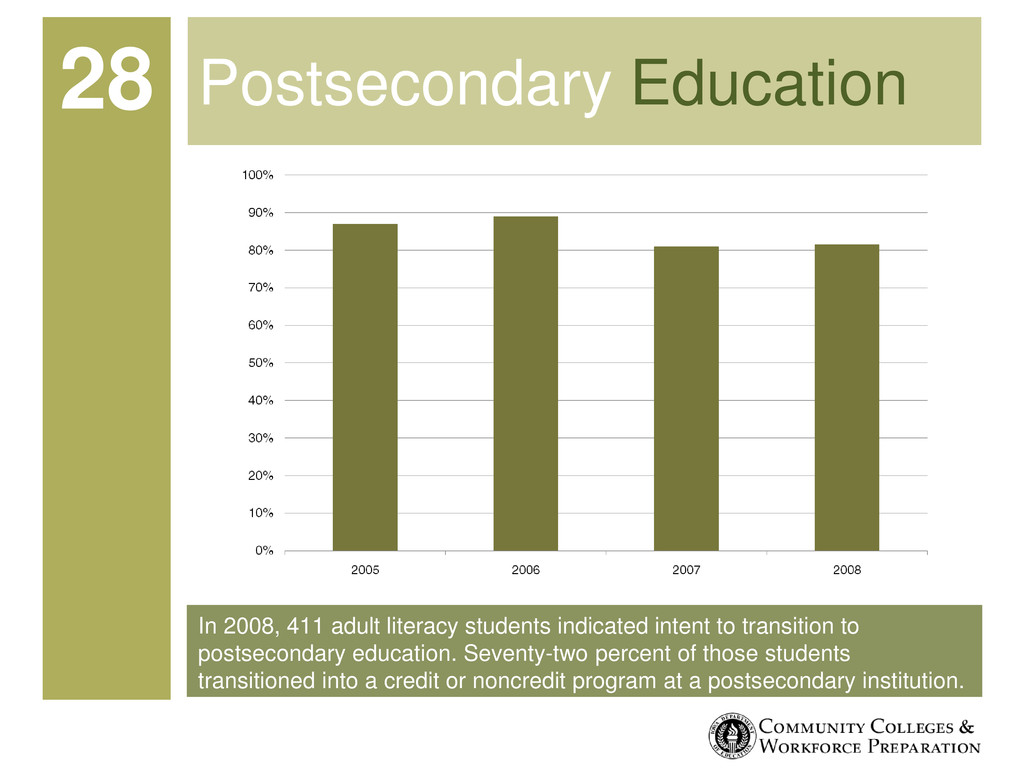
    to postsecondary education. Seventy-two percent of those students transitioned into a credit or noncredit program at a postsecondary institution. Postsecondary Education 28