Upgrade to Pro — share decks privately, control downloads, hide ads and more …

18-01-26 M4 No9

18-01-26 M4 No9

Though no bull market ever ended purely because of stretched valuations, the more abnormal these become, the more we can be sure we are simply trading the market not investing in the businesses involved. What does the interplay of stocks, bonds, forex & commodities have to tell us about our current prospects?

Cantillon Consulting

January 26, 2018
Tweet

More Decks by Cantillon Consulting

Other Decks in Business

Transcript

  1. ©2018 Cantillon Consulting January 2018 Please see the disclaimer at

    the end of this document PAGE 1 January 2018 www.cantillon-consulting.ch Insight & Support for the Managers of Wealth Money, Macro & Markets Monitor Money makes the World go round, makes the Money go round, makes the World go round... IN THIS ISSUE:- Volume II, Issue I US Equities: Do earnings justify the price? CAPE: New, improved recipe. CPI: The chart break-out we ALL should watch Bonds: Man On Wire Forex: The end of the Greenback Boogie? Commodities: The Naughtie Nineties rewind
  2. January 2018 ©2018 Cantillon Consulting January 2018 Please see the

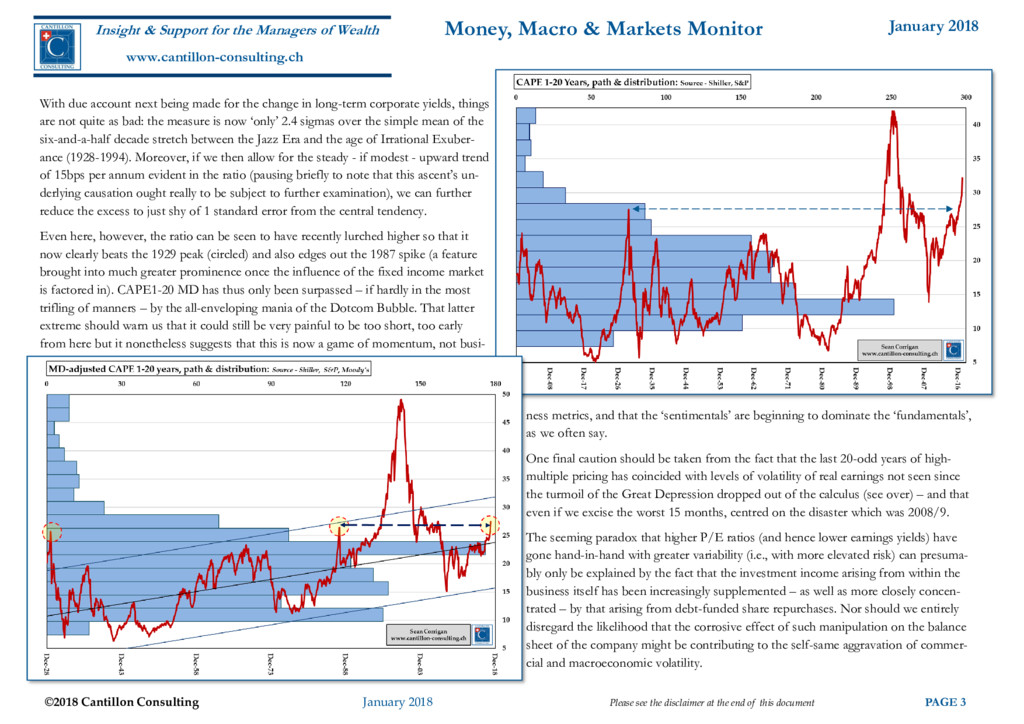
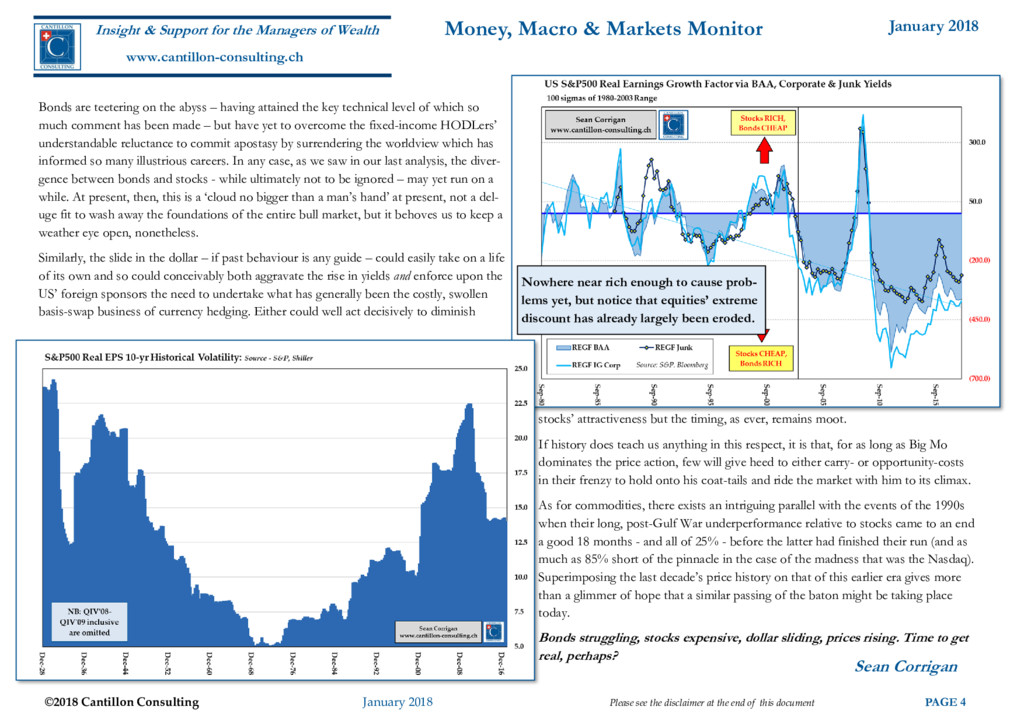
    disclaimer at the end of this document PAGE 2 Insight & Support for the Managers of Wealth www.cantillon-consulting.ch Money, Macro & Markets Monitor As the latest reporting season unfolds amid a further burst of rapid share-price apprecia- tion, the Blue Skies Brigade has not been shy in linking the former to the latter, pointing out gleefully that the current blend of estimates and actual reporting for QIV shows earn- ings per share growth of around 12% for the S&P500, together with expected revenue growth of approaching 7% YOY. Creditable enough you might say and – indeed – an unmistakable sign of further progress out of the slough of the shale oil-induced ‘Hidden Recession’ of 2014/16. There is, however, a dirty little secret within this ostensibly good performance – viz., that, despite the recent improvement, aggregate earnings (i.e., the actual dollars and cents ac- cruing to company coffers once we allow for buyback-depleted share counts) are still no greater than they were four years ago. Having dipped in the middle, it is, of course, an arithmetical inevitability that, if we are ever to move to new highs after a slump, there must be a point where we have only suc- ceeded in scrambling far enough out of the valley to match the altitude of the previous peak. For example, such was the case in the aftermath of the two previous declines: ag- gregate earnings were no greater in QI’2011 than they had been in QII’2007 and ditto for QIV’03 and QIII’00. Where the crucial difference lies is that, as that new highwater mark was reached after the Tech Bust, the S&P still stood almost a quarter below its previous peak; while the recovery from the Lehman-GFC seizure had them yet an eighth lower. Contrast the situation then with that of today - when we find that the index is now 50% ahead of 2013’s closing score - and we can see that those who argue that the market is beginning to run on little more than fumes might just have a point in their favour. In essence, what the past four years have seen is a one-third inflation of the outlay people are willing to make for each dollar of current earnings, the P/E ratio having expanded from 18.4 to 24.3 in the interim. Now it is true that we ourselves have argued that some of the secular expansion of multiples seen over the past 35 years can be justifiably attributed to falling bond yields (and hence to the greater NPV one might reasonably attach in one’s estimations to the more deferred constituents of the firm’s stream of earnings). But that can hardly be used as an excuse in this case, given that long-dated Treasuries, junk, and investment-grade yields are all broadly comparable at either end of our present horizon, while shorter yields are, of course, much higher now than they were before the Fed em- barked upon its baby-step tightening programme. Furthermore, if we do employ the NPV argument, we could also contend that whereas the past use of an outwardly identical discount factor might have been shaded to the side of optimism by the conditioning afforded by three, long decades of declining yields, the con- temporary fear is that this benign trend is now, alas, behind us. Conversely, it would therefore be sensible to argue that a greater margin of safety needs to be incorporated into one’s arithmetic henceforward in order to compensate for the prospect that interest rates indeed continue to increase, not dwindle further. Rounding the Cape Though we have come to look a little askance at the seemingly ubiquitous CAPE measure – not least because of its gratingly unnuanced adoption by the Permabears – we can still utilise it to derive some broad sense of the market’s status once we attempt to adjust it for what we see as two of its bigger flaws: the seemingly arbitrary nature of the 10-year calcu- lation period and its lack of regard for the effect of those wider asset valuations being expressed in the bond market that we have just touched on above. The first we accomplish by calculating the CAPE for all intervals from one to twenty years and then averaging them. The second via the shortcut of scaling the index earnings with respect to the contemporary duration of corporate bond yields (since higher dura- tions mean successively deferred cashflows contribute more to today’s valuations and vice versa). Though we had hoped this would temper some of the wilder expositions of alarm to which the traditional measure has lately given rise, the first step still leaves what we might call CAPE1-20 pushing into what is historically very elevated territory - at more than dou- ble (circa 4 sigmas over) the 1900-1990 Average of 14.1, a mark where it was only ever exceeded during the height of the first great Tech Bubble. The CAPE of Good Hope
  3. January 2018 ©2018 Cantillon Consulting January 2018 Please see the

    disclaimer at the end of this document PAGE 3 Insight & Support for the Managers of Wealth www.cantillon-consulting.ch Money, Macro & Markets Monitor With due account next being made for the change in long-term corporate yields, things are not quite as bad: the measure is now ‘only’ 2.4 sigmas over the simple mean of the six-and-a-half decade stretch between the Jazz Era and the age of Irrational Exuber- ance (1928-1994). Moreover, if we then allow for the steady - if modest - upward trend of 15bps per annum evident in the ratio (pausing briefly to note that this ascent’s un- derlying causation ought really to be subject to further examination), we can further reduce the excess to just shy of 1 standard error from the central tendency. Even here, however, the ratio can be seen to have recently lurched higher so that it now clearly beats the 1929 peak (circled) and also edges out the 1987 spike (a feature brought into much greater prominence once the influence of the fixed income market is factored in). CAPE1-20 MD has thus only been surpassed – if hardly in the most trifling of manners – by the all-enveloping mania of the Dotcom Bubble. That latter extreme should warn us that it could still be very painful to be too short, too early from here but it nonetheless suggests that this is now a game of momentum, not busi- ness metrics, and that the ‘sentimentals’ are beginning to dominate the ‘fundamentals’, as we often say. One final caution should be taken from the fact that the last 20-odd years of high- multiple pricing has coincided with levels of volatility of real earnings not seen since the turmoil of the Great Depression dropped out of the calculus (see over) – and that even if we excise the worst 15 months, centred on the disaster which was 2008/9. The seeming paradox that higher P/E ratios (and hence lower earnings yields) have gone hand-in-hand with greater variability (i.e., with more elevated risk) can presuma- bly only be explained by the fact that the investment income arising from within the business itself has been increasingly supplemented – as well as more closely concen- trated – by that arising from debt-funded share repurchases. Nor should we entirely disregard the likelihood that the corrosive effect of such manipulation on the balance sheet of the company might be contributing to the self-same aggravation of commer- cial and macroeconomic volatility.
  4. January 2018 ©2018 Cantillon Consulting January 2018 Please see the

    disclaimer at the end of this document PAGE 4 Insight & Support for the Managers of Wealth www.cantillon-consulting.ch Money, Macro & Markets Monitor Bonds are teetering on the abyss – having attained the key technical level of which so much comment has been made – but have yet to overcome the fixed-income HODLers’ understandable reluctance to commit apostasy by surrendering the worldview which has informed so many illustrious careers. In any case, as we saw in our last analysis, the diver- gence between bonds and stocks - while ultimately not to be ignored – may yet run on a while. At present, then, this is a ‘cloud no bigger than a man’s hand’ at present, not a del- uge fit to wash away the foundations of the entire bull market, but it behoves us to keep a weather eye open, nonetheless. Similarly, the slide in the dollar – if past behaviour is any guide – could easily take on a life of its own and so could conceivably both aggravate the rise in yields and enforce upon the US’ foreign sponsors the need to undertake what has generally been the costly, swollen basis-swap business of currency hedging. Either could well act decisively to diminish stocks’ attractiveness but the timing, as ever, remains moot. If history does teach us anything in this respect, it is that, for as long as Big Mo dominates the price action, few will give heed to either carry- or opportunity-costs in their frenzy to hold onto his coat-tails and ride the market with him to its climax. As for commodities, there exists an intriguing parallel with the events of the 1990s when their long, post-Gulf War underperformance relative to stocks came to an end a good 18 months - and all of 25% - before the latter had finished their run (and as much as 85% short of the pinnacle in the case of the madness that was the Nasdaq). Superimposing the last decade’s price history on that of this earlier era gives more than a glimmer of hope that a similar passing of the baton might be taking place today. Bonds struggling, stocks expensive, dollar sliding, prices rising. Time to get real, perhaps? Sean Corrigan Nowhere near rich enough to cause prob- lems yet, but notice that equities’ extreme discount has already largely been eroded.
  5. January 2018 ©2018 Cantillon Consulting January 2018 Please see the

    disclaimer at the end of this document PAGE 5 Insight & Support for the Managers of Wealth www.cantillon-consulting.ch Money, Macro & Markets Monitor WHAT THE FIRM OFFERS The fruits of a lengthy exercise of full intellectual independence, trading in, commenting upon, and analysing markets, placed fully at your disposal to help enhance your investment process. Dedicated personal interaction, as well as written assessments, to enliven the debate and to mitigate risks by broadening the circle of opinion. Detailed macro/market research with the possibility of undertaking special commissions upon re- quest. Ideas and arguments to incorporate into your existing framework of client communication either as ‘white-labelled’ material or, if you wish, to present as the stand-alone opinion of one of your firm’s expert counsellors. Assistance with content for reporting, proposals, marketing, etc. Education and training. Public speaking to entertain and inform you and your invited guests. For more information and to discuss the specifics of what we can offer, please write to info[at]cantillon-consulting.ch
  6. January 2018 ©2018 Cantillon Consulting January 2018 Please see the

    disclaimer at the end of this document PAGE 6 Insight & Support for the Managers of Wealth www.cantillon-consulting.ch Money, Macro & Markets Monitor Recently, some FinTwit querulously remarked: ‘It’s ludicrous to suppose we have base our investment policy on two lines drawn on a yield graph.’ To which we rejoined: ‘It’s even more ludicrous that we have to base our EVERY decision on two lines drawn on a central banker’s CPI graph.’ Easy to see (right) that the Fed has more work to do and hence that bonds will remain pressured. Also evident from the charts below that the impetus from stronger com- modity prices (which a weaker dollar will do little to restrain) is likely to feed through and force its way into the Fed’s consciousness.
  7. January 2018 ©2018 Cantillon Consulting January 2018 Please see the

    disclaimer at the end of this document PAGE 7 Insight & Support for the Managers of Wealth www.cantillon-consulting.ch Money, Macro & Markets Monitor
  8. January 2018 ©2018 Cantillon Consulting January 2018 Please see the

    disclaimer at the end of this document PAGE 8 Insight & Support for the Managers of Wealth www.cantillon-consulting.ch Money, Macro & Markets Monitor
  9. January 2018 ©2018 Cantillon Consulting January 2018 Please see the

    disclaimer at the end of this document PAGE 9 Insight & Support for the Managers of Wealth www.cantillon-consulting.ch Money, Macro & Markets Monitor Note the similarity of the past decade’s rela- tive price performance to that which culmi- nated in the Tech Bubble top. Note also that this relative move then peaked some 18 months and ~25% before the broad equity market itself topped out.
  10. January 2018 ©2018 Cantillon Consulting January 2018 Please see the

    disclaimer at the end of this document PAGE 10 Insight & Support for the Managers of Wealth www.cantillon-consulting.ch Money, Macro & Markets Monitor BUBA A gentle reminder that the looming stock:bond conflict may not be confined to the US alone
  11. January 2018 ©2018 Cantillon Consulting January 2018 Please see the

    disclaimer at the end of this document PAGE 11 Insight & Support for the Managers of Wealth www.cantillon-consulting.ch Money, Macro & Markets Monitor Disclaimer All content is intended to give general advice only. The investments and instruments mentioned therein are not necessarily suitable for every individual and you should use this information in conjunction with other advice and research to determine its suitability for your own circumstances and risk preferences. The value of all securities and investments, as well as the income derived from them, can fall as well as rise. Your investments may be subject to sudden, often substantial, declines in value which may not be recoverable; others may expire worthless after a specified period. You should not buy any of the securities or other investments mentioned with money you cannot afford to lose. In some cases there may be significant charges which may reduce the value of your investment. You run an extra risk of losing money when you buy shares in certain securities where there is a large difference or ‘spread’ between the buying price and the selling price, a circumstance which means that, should you sell them immediately, you may get back much less than you paid for them. In the case of investment trusts and certain other funds, these may use or propose to use the borrowing of money in order to increase the size of their exposures and/or invest in other securities with a similar strategy. As a result, movements in the price of the securities may be more volatile than the movements in the prices of those underlying investments. Some investments may involve a high degree of such borrowing (often referred to as ‘gearing’ or ‘leverage’) This means that a small movement in the price of the underlying asset may have a disproportionately large effect on that of your investment. Accordingly, a relatively small adverse movement in the price of the underlying asset can result in the loss of the entirety of your original investment. Changes in rates of ex- change may have an adverse effect on the value or price of the investment and you should be aware that additional dealing, transaction, and custody charges for certain instruments may result when these are not traded in your home currency. Some investments may not be quoted on a recognised investment exchange and, as a result, you may find them to be ‘illiquid’. You may not easily be able to trade your illiquid investments and, in certain circumstances, it may become difficult, if not impossible to sell the investment in a timely manner and/or at its indic- ative price. Investment in any of the assets mentioned may have tax consequences regarding which you should consult your tax adviser. All reasonable care has been taken to ensure that all statements of fact and opinion contained in the either written or spoken form are fair and accurate in all material respects. All data is from sources considered to be reliable but its accuracy cannot be guaranteed. Investors should seek appropriate professional advice if any points are unclear. Copyright ©2018 Cantillon Consulting Sàrl. Any disclosure, copy, reproduction by any means, distribution, or other action which relies on the contents of such materials, made without the prior written consent of Cantillon Consulting, is strictly prohibited and could lead to legal action.