Upgrade to Pro — share decks privately, control downloads, hide ads and more …

AAGW3 - GEOSHARE

CGIAR-CSI
March 22, 2013

AAGW3 - GEOSHARE

CGIAR-CSI

March 22, 2013
Tweet

More Decks by CGIAR-CSI

Other Decks in Research

Transcript

  1. Trends in rice: Consumption 100 200 300 400 500 600

    700 800 1960 1970 1980 1990 2000 2010 All data derived from FAOSTAT (2012) and standardized to 1961 values = 100 One line is Africa one line is Asia, but which is which?
  2. Trends in rice: Area All data derived from FAOSTAT (2012)

    and standardized to 1961 values = 100 100 200 300 400 1960 1970 1980 1990 2000 2010 One line is Africa one line is Asia, but which is which?
  3. Trends in rice: Production All data derived from FAOSTAT (2012)

    and standardized to 1961 values = 100 100 200 300 400 500 600 1960 1970 1980 1990 2000 2010 One line is Africa one line is Asia, but which is which?
  4. Trends in rice: Yield All data derived from FAOSTAT (2012)

    and standardized to 1961 values = 100 100 150 200 250 300 1960 1970 1980 1990 2000 2010 Understanding how to assess trends in agricultural productivity and poverty in South Asia with spatial data is relevant to Africa. Changes occurring here are occurring faster than in Asia and we need to ensure that we have the partnerships & networks to measure & assess the impact of these changes. One line is Africa one line is Asia, but which is which?
  5. South Asia GEOSHARE node. Build and share the best available

    crop data for 2005 for South Asia District level data – 600+ spatial units Major crops – over 20 crops across India and Bangladesh Area, Production and Yield by season (up to three seasons per year) Area, Production and Yield by water source (where available) 1 Agricultural productivity in 2005
  6. 1 Agricultural productivity in 2005 District level Area/Production/Yield for >20

    crops Rice area Wheat area Maize area Rice yield Wheat yield Maize yield
  7. ? Wet season Dry season Winter season All seasons 1

    Agricultural productivity in 2005 District level Area/Production/Yield by season
  8. How do the regional and global nodes interact? South Asia

    regional node delivers detailed data to HUBZero and the global nodes South Asia regional node validates global products on crop extent and irrigated area using ground truth data, expert knowledge and high resolution data (village and tract level data from census) Global nodes update their products in consecutive rounds based on validation results Regional nodes benefit from improved global products 1 Agricultural productivity in 2005
  9. A Case Study Revitalising cereal cropping systems and enhancing farmers’

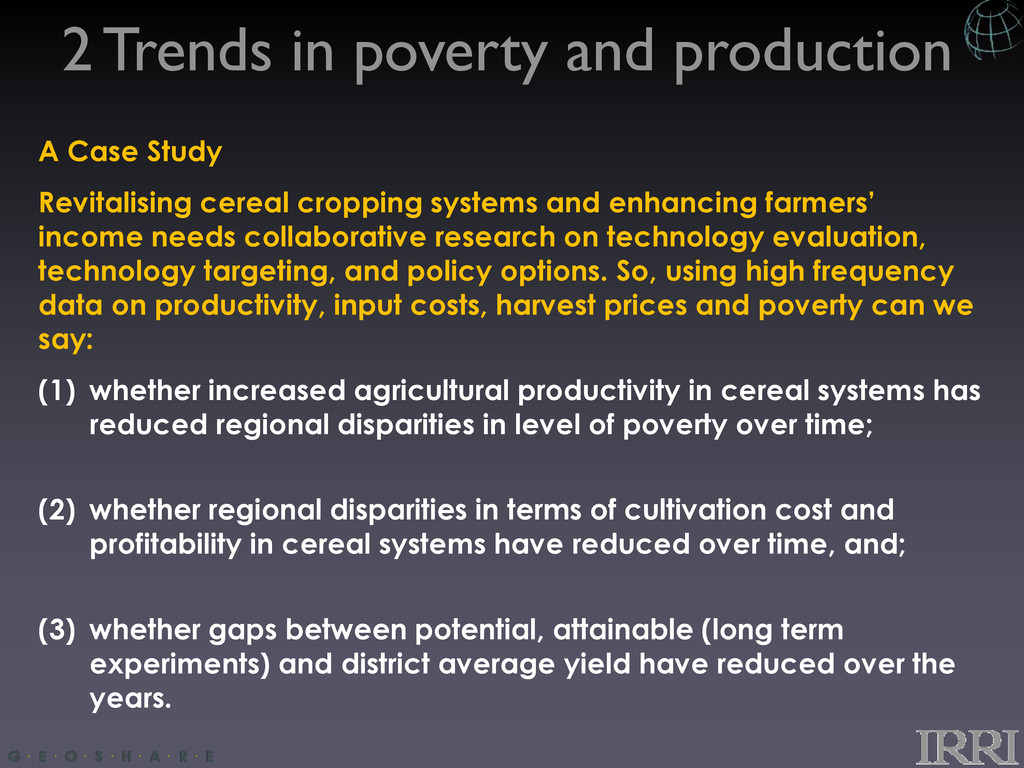
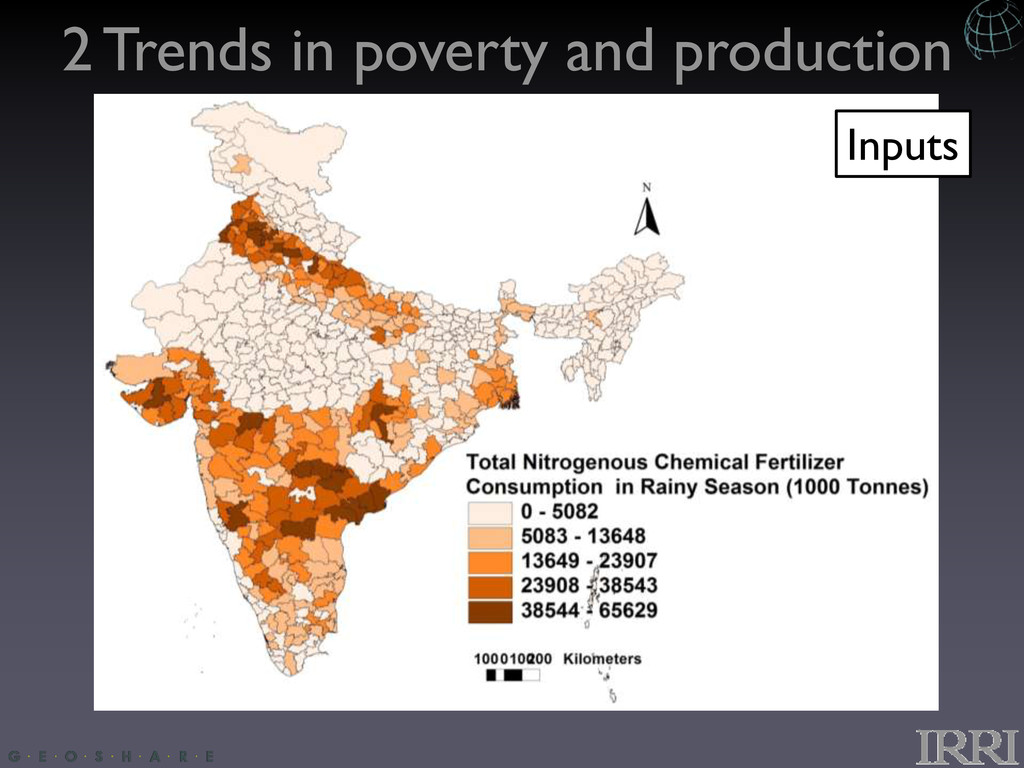
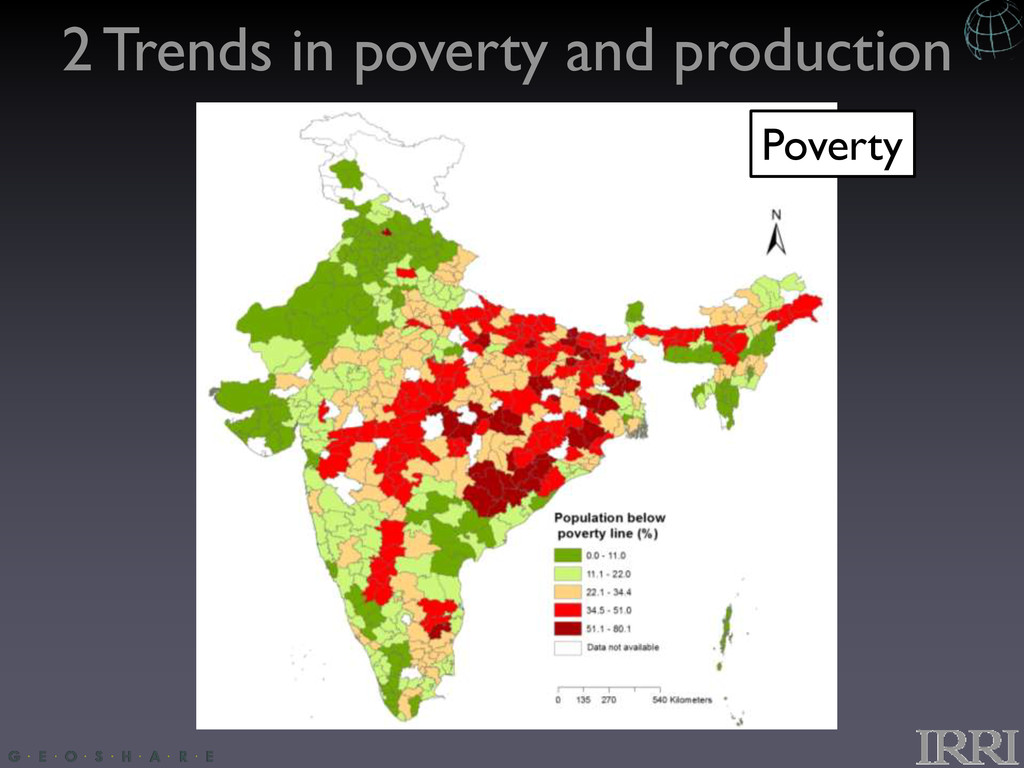
    income needs collaborative research on technology evaluation, technology targeting, and policy options. So, using high frequency data on productivity, input costs, harvest prices and poverty can we say: (1) whether increased agricultural productivity in cereal systems has reduced regional disparities in level of poverty over time; (2) whether regional disparities in terms of cultivation cost and profitability in cereal systems have reduced over time, and; (3) whether gaps between potential, attainable (long term experiments) and district average yield have reduced over the years. 2 Trends in poverty and production
  10. Time series of production related data for approximately 2000-2010 APY

    data for 20 crops Fertilizer consumption (N,P,K) Cost of cultivation of each crop, including: seed, fertilizer, manure, human Labour, animal Labour, machine labour Harvest prices of each crop Poverty data at start and end of timeseries 2 Trends in poverty and production
  11. ? 2 Trends in poverty and production Area Yield Source:

    A Sethi and Parvesh Chandna 2009, Maize Atlas of India Productivity change Compound annual growth rate in area and yield of maize 2004-2008 in Andhra Pradesh.
  12. 3 Spatio-temporal crop mapping Crops do not have well defined

    and regular seasons. Planting and harvesting dates vary from place to place and from year to year. Seasonal statistics may not even make much sense in some places. Can we use remote sensing to tell us something about key crop parameters like planting and harvesting dates? How might we use monthly estimates of Area, Production and Yield?
  13. One season Two seasons Three seasons Changes in crop intensity

    and crop seasonality can be mapped based on a combination of crop knowledge and regular monitoring with remote sensing imagery 3 Spatio-temporal crop mapping