Upgrade to Pro — share decks privately, control downloads, hide ads and more …

AAWG3 - Reinhard Simon - Using statistics & spatial analysis for advancing African agriculture

CGIAR-CSI
March 22, 2013

AAWG3 - Reinhard Simon - Using statistics & spatial analysis for advancing African agriculture

CGIAR-CSI

March 22, 2013
Tweet

More Decks by CGIAR-CSI

Other Decks in Research

Transcript

  1. Presented by: Reinhard Simon Head of Integrated IT and Computational

    Research, International Potato Center (CIP), Lima, Peru On behalf of ILCYM team Using statistics & spatial analysis for advancing African agriculture 12th March, 2013 AAGW ILRI, Addis Abeba
  2. Predicting insect phenology Insects are important threats to crop yield

    and at post-harvest stage. Their life cycle depends largely on temperature.
  3. What is ILCYM? A software package for developing temperature- based

    insect phenology models with applications to regional and global analysis of insect population and mapping. M. Sporleder, P. Carhuapoma, J.C. Gonzales, H. Tonnang, H. Juarez, R. Simon, J. Kroschel
  4. Conceptual Framework EI E.. E1 E0 LI L.. L1 L0

    PI P.. P1 P0 AfI Af.. Af1 Af0 Development to the next stage Mortality Reproduction Temp Dev.rate Temperature Mortality 0 1 normalized age Development Temperature Oviposition normalized age Proportion of progeny Female rate 0.5 Temperature-dependent nonlinear relationships representing insect life cycle processes
  5. Input data collection ♂ ♀ ♂ Constant temperatures  Development

    time  Mortality Longevity Oviposition
  6.  It's based on Java language using Eclipse Rich Client

    Platform, GeoTools and Udig.  GIS functionalities meets operating needs: feature editing, printing, and ability to use standard GIS formats and databases.  It works mainly on Vector data.  Having a GIS desktop system as a base, analytical extensions are easier to built and connect.  Different R packages provides classes and functions to manipulate geographic (spatial) data in ’raster’ format are now embedded in ILCYM.  ILCYM allows to visualize, edit and analyze both Vector and Raster data. Java Image I/O Java 1.5 Java Topology Suite (JTS) PostGIS WMS WFS GML Shap e GeoTools Libraries Platform Application Eclipse RCP uDig EMF GEF JAI Language The R Project for Statistical Computing What is inside ILCYM for the GIS component?
  7. Project view Layers view Map view Table view Catalogue, attributes,

    What is inside ILCYM for the GIS component?
  8. ILCYM adds three new menus in the uDIG platform to

    the menu bar for proper connection with the phenology, modeling and climate data:  Modeling  ILCYM tools  Spatial analysis The module: Population analysis & mapping
  9. The module: Population analysis & mapping Modeling:  Risk indices

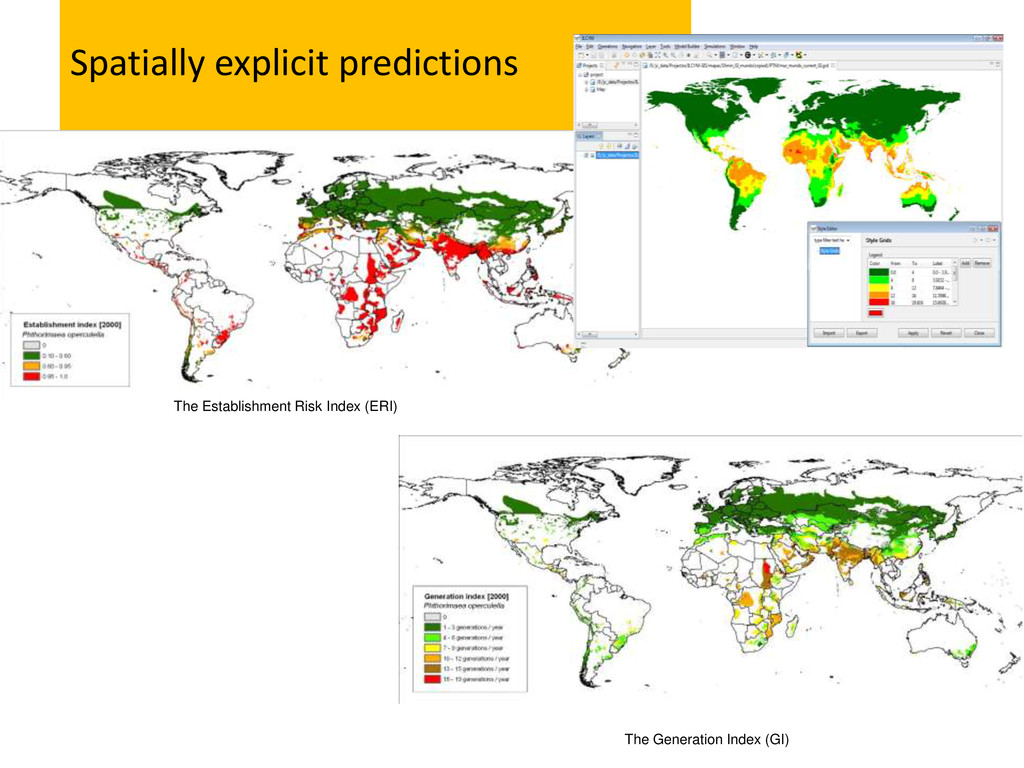
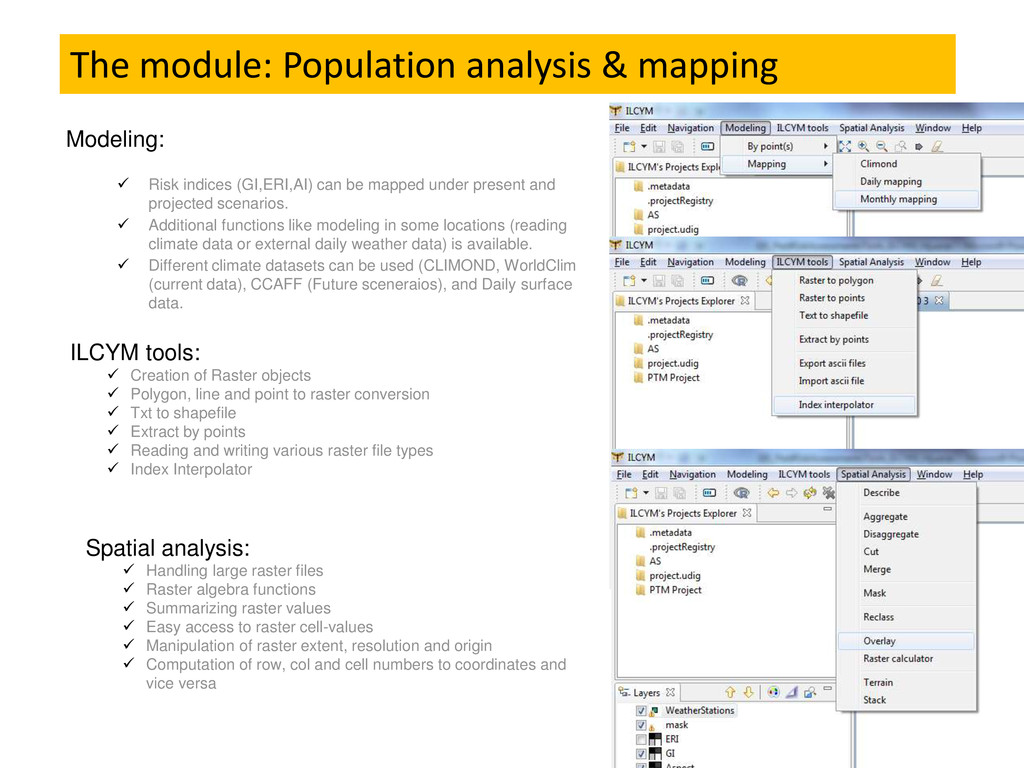
    (GI,ERI,AI) can be mapped under present and projected scenarios.  Additional functions like modeling in some locations (reading climate data or external daily weather data) is available.  Different climate datasets can be used (CLIMOND, WorldClim (current data), CCAFF (Future sceneraios), and Daily surface data. ILCYM tools:  Creation of Raster objects  Polygon, line and point to raster conversion  Txt to shapefile  Extract by points  Reading and writing various raster file types  Index Interpolator Spatial analysis:  Handling large raster files  Raster algebra functions  Summarizing raster values  Easy access to raster cell-values  Manipulation of raster extent, resolution and origin  Computation of row, col and cell numbers to coordinates and vice versa
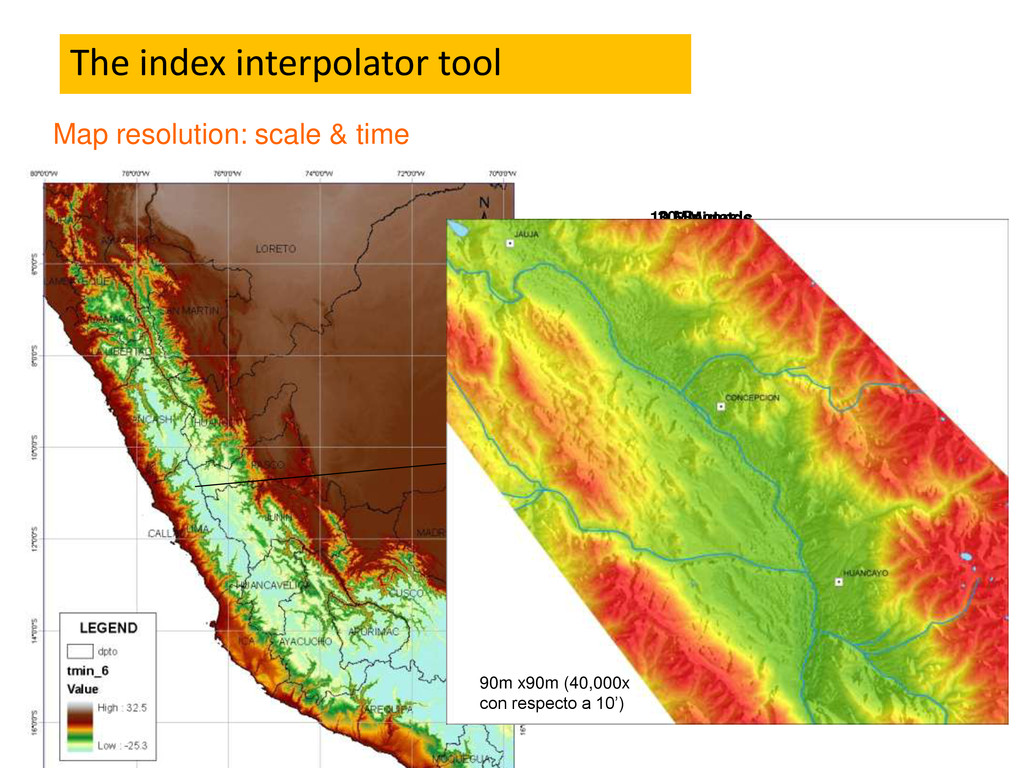
  10.  Available climate information (WorldClim, CCAFF, CRU, Climond, etc) are

    useful for global/regional insect modelling: scale resolution, monthly data, average of 20-40 years!)  This tool was developed for analysing the Risk Index at higher spatial (pixel size of 90m) and temporal resolution (daily data) for capturing on small-scale of insect population distribution and abundance. The index interpolator tool
  11. 10 Minutes  18x18km (1x) 2.5 Minutes  4.5x4.5km (16x

    con respecto 10’) 30 Seconds  0.9x0.9km (400x con respecto 10’) 90m x90m (40,000x con respecto a 10’) Map resolution: scale & time The index interpolator tool
  12. Climate interpolator (thin plate smothing spline) [Diario] Tmax n=365 Tmin

    n=365 [Mapping Index: GI, ERI, AI] [Calculating the Indexes (GI, ERI, AI) directly on the each weather station. GI, ERI, AI Index Interpolator tool (thin plate smothing spline) ANUSPLIN 4.1 (Australia) The index interpolator tool
  13. No hay generaciones 1 generación / año 2 generaciones /

    año 3 generaciones / año 4 - 5 generaciones / añ The index interpolator tool Generation index  Both methodologies captures well the effect of small-scale for insect population distribution and abundance.  Running ILCYM on interpolated weather data (365 layers for Tmax & Tmin) took almost 30 days to complete the simulation.  Calculating the Indexes directly on each weather station and then interpolate the indices (Index interpolator tool) took 5 minutes. Running ILCYM on interpolated weather data. Calculating the Indexes (GI, ERI, AI) directly on the each weather station.
  14. Outlook . Project with African partners on building a database

    of insect models (final year 2013) Building risk atlas of insect pests (on-going) Integration with crop modeling tools based on R (planned for 2013) Going mobile (planned)  Http://www.cipotato.org/ilcym  Funding: Fontagro, BMZ, CRP RTB