Upgrade to Pro — share decks privately, control downloads, hide ads and more …

Update: Colliers Seminar 2013

Update: Colliers Seminar 2013

An update to Colliers 2013 Seminar: Trends in Real Estate

More Decks by Colliers International | Boston

Other Decks in Business

Transcript

  1. Click to edit Master title style COLLIERS INTERNATIONAL’S 34TH ANNUAL

    SEMINAR TRENDS IN THE REAL ESTATE MARKET January 17, 2013 Boston Convention & Exhibition Center
  2. Click to edit Master title style Largest Employers Massachusetts 1

    Massachusetts General Hospital Healthcare 2 The Stop & Shop Supermarket Co. LLC Retail 3 The University of Massachusetts Education 4 Steward Health Care System Healthcare 5 Harvard University Education 6 Brigham and Women's Hospital Healthcare 7 UMass Memorial Health Care Healthcare 8 Massachusetts Institute of Technology (MIT) Education 9 Raytheon Co. (NYSE: RTN) Electronics 10 State Street Corp. (NYSE: STT) Financial Services 4 HEALTHCARE 3 EDUCATION 1 ELECTRONICS 1 FINANCIAL SERVICES 1 RETAIL
  3. Click to edit Master title style Money Management Ranking by

    State Ranking by City State Assets under Management ($ trillions) City Assets under Management ($ trillions) NY $10.8 New York $10.50 CA $7.8 Boston $5.90 MA $7.0 Newport Beach $2.90 PA $2.1 Los Angeles $2.50 IL $1.7 Chicago $1.60 Source: Institutional Investor
  4. Click to edit Master title style Boston Population 801,444 697,197

    641,071 562,994 574,283 589,141 617,594 625,087 400,000 450,000 500,000 550,000 600,000 650,000 700,000 750,000 800,000 850,000 1950 1960 1970 1980 1990 2000 2010 2012 Growth: 7,000
  5. Click to edit Master title style Acetylon Ad Biotech Solutions

    Agile Commerce Aisle Buyer Aldebaran Allen & Gerritsen (A&g) Altaeros Energies Ambrian Innovation Apperian Argus Arista Solutions Llc Bamboon Biodefense Corporation Blue State Digital Bocoup Boost3 Boston Technologies Brightcove Bsa Bullhorn Buzzient Cengage Larning Clovr Coincident Communispace Connected Bits Convergex Group Crimson Hexagon Curemeta Cytonome Dataxu Dentovations Dynamo Fable Vision Fama Pr Fastcap Systems Fialkoff Firstgiving Fundraise.Com Gazelle Gemvara Get Fused Ginkgobioworks Goby Green Trade Association Greentown Labs Harpoon Brewery Heartland Robotics Height & Hand I Jukebox Ifactory Immunetics Intronis Cloud Backup + Recovery Kernel Kyruus Locately Mad Pow Maplab Massdrive.Com Mendix Metro Mitx Mobile Monday Modkit Monster Mosaic Loft Neoscape Next Step Living Nortek Usa Novophage Npr Digital Services Nyx Oasys Water Omgeo Onchippower Onward Technologies, Ltd. Openview Venture Partners Oscomp Systens Owneriq Pgr Media Promethean Power Systems Pubget Rue La La Satcon Seeding Labs Sessionm Simpletuition Skyhook Solsolution Space With A Soul Tributes Triton Digital Tro Jb Turningart Verndale Wiggio Zmags Innovation District Start Ups
  6. Click to edit Master title style Real Estate Daily Boston’s

    commercial real estate market leading national recovery Boston’s commercial real estate prices are fast approaching peak levels last seen in December 2007, while the local market as a whole is head-and-shoulders above the rest when comes to rebounding from the depths of the most-recent recession. That’s according to a new report by Moody’s Investors Service, which tracked commercial real estate prices in major markets throughout the United States during the 12 months ended Sept. 30. Moody’s said Boston was far and away the strongest commercial real estate market in the country during the period studied and was the closest to recovering the value lost during the downturn that followed the recession and 2008 financial crisis. The ratings firm said local CRE prices rose 10.4 percent in the 12-month span, tops among all major U.S. metros and well above the 8 percent growth logged by second- place New York. San by 5.7 percent and 7.5 percent as of Sept. 30. The local rebound appears to be prompting more property owners to test the market. Among them is The BlackStone Group, which according to multiple reports is actively marketing swaths of its real estate portfolio, including some 12 million square feet of space in Greater Boston. Nationally, commercial real estate prices have increased by 28 percent since hitting their January 2010 low point, but still remain 21.8 percent below their record highs reached five years ago, Moody’s said. Among the report’s other highlights was the fact that central business districts are leading the recovery, with property values rising nationally by 5 percent in the three months ended Sept. 30 and by 19.7 percent on a year- over-year basis. Also of note: Washington, D.C., which was the strongest market in the U.S. for several years running (prices spiked 42 percent between April 2009 and March 2011), has ground to a standstill amid concerns over U.S. Francisco ranked third in the Moody’s study, having recorded a 7.8 percent rise in prices over the past year. Moody’s said its commercial property price index rose nationally by 1.4 percent during the period analyzed. Boston also ranked as the best-performing CRE market in the country in terms of value recovered since the industry bottomed out in early 2010. According to the report, Boston’s commercial values are less than 1 percent below their market peak in December 2007. Washington, D.C., and New York were a distant second and third in reclaiming peak values, respectively falling short Game Changers
  7. Click to edit Master title style Game Changers Real Estate

    News Office Building for State Street Bank Slated for Fort Point Channel Center The tax deal announced today will help finance construction of an 11- story office building for State Street at the Channel Center complex off A Street. The $11.5 million tax break, which still needs approval from the Boston Redevelopment Authority, will be spread over 15 years. Among the city’s largest financial services employers, State Street is the latest of several companies to win a tax break for new offices on the waterfront. Vertex Pharmaceuticals Inc. received more $21.8 million in city and state tax incentives for a pair of large office buildings nearby at Fan Pier. Such tax deals are often controversial, as the companies receiving them are often profitable. State Street, for example, reported net income of create 1,200 construction jobs. “State Street Bank & Trust Co is Boston’s seventh largest employer and keeping this economic giant in the city not only ensures that we are retaining jobs, but is a key to attracting new jobs and creating an economically successful and vibrant city,” Boston Mayor Thomas M. Menino said in a statement. State Street could not be reached immediately for comment. The company has thousands of employees in Boston and already occupies some of its most prominent commercial buildings. Channel Center’s developer, Commonwealth Ventures, filed detailed plans for the office building last month, but State Street was not formally revealed as the tenant until today. The project will also include construction $1.92 billion in 2011 and paid its chief executive, Joseph Hooley, total compensation of $16 million, according to government filings. But city officials say the tax breaks are necessary to spur investment in the neighborhood. In 2008, investment bank JP Morgan Chase & Co. received a $4 million break to move to the waterfront. The tax concessions for State Street will reduce its tax bill by about 20 percent, but the company will still pay $43.4 million in new taxes over the 15-year period and
  8. Click to edit Master title style Game Changers Extra! Extra!

    Brown Bros. Harriman Taking 400K SF at 50 Post Office Square Lorem ipsum dolor sit amet, consectetur adipiscing elit. Nullam venenatis fringilla mauris ac pellentesque. Nunc in nibh lectus. Fusce non nibh at dui condimentum molestie. Nulla facilisi. Nunc a dui vel turpis pellentesque dictum. Pellentesque nec porta ante. Aliquam a arcu turpis, at tincidunt risus. Praesent lorem ligula, vulputate hendrerit vehQuisque dapibus est ut eros ullamcorper molliicula in, mollis eget neque. Curabitur pretium diam sit amet dolor volutpa Nam dapibus felis at lorem tristique lobortis. Fusce sit amet imperdiet ligula. Vivamus sed purus leo. Nunc ipsum eros, feugiat sit amet tempus quis, varius quis urna. Etiam et enim id mauris malesuada pharetra. Nunc in nibh lectus. Fusce non nibh at dui condimentum molestie. Nulla facilisi. Nunc a dui vel turpis pellentesque Vivamus sed purus leo. Nunc ipsum eros, feugiat sit amet tempus quis, varius quis urna. Etiam et enim id mauris malesuada pharetra. Nunc in nibh lectus. Fusce non nibh at dui condimentum molestie. Nulla facilisi. Nunc a dui vel turpis pellentesque Nunc commodo metus ac magna hendrerit porta. Mauris porta vestibulum sapien eu molestie. Praesent ac tellus mauris. In quis magna non est semper rutrum. Aenean sed magna a diam convallis lobortis ac non nulla. Pellentesque imperdiet feugiat eros lacinia consequat. Donec egestas ultricies elit eu la Praesent sed enim nibh, ut pretium augue. Nunc metus enim, pharetra eget varius id, ullamcorper sit amet quam. gravida fringilla risus feugiat. Pellentesque ac tellus quis urna aliquam eleifend vel ac neque. Nulla iaculis sollicitudin consequat. Vestibulum posuere tortor vel mauris adipiscing quis malesuada turpis feugiat. Praesent sed enim nibh, ut pretium augue. Nunc metus enim, pharetra eget varius id, ullamcorper sit amet quam. Quisque dapibus est ut eros ullamcorper mollis. Vestibulum imperdiet felis vitae massa egestas id malesuada ligula elementum. Quisque consectetur diam lacus. Nulla non enim eget nunc varius molestie non eget ipsum. Aliquam mattis dapibus magna, non mollis eros euismod non. Phasellus risus Nunc in nibh lectus. Fusce non nibh at dui condimentum molestie. Nulla facilisi. Nunc a dui vel turpis pellentesque dictum. Pellentesque nec porta ante. Aliquam a arcu turpis, at tincidunt risus. Praesent lorem ligula, vulputate hendrerit vehQuisque purus. Proin purus nunc, sagittis Nunc commodo metus ac magna hendrerit porta. At condimentum ac, sagittis vitae augue. Aenean imperdiet, nunc non facilisis consectetur, enim urna faucibus metus, quis rutrum
  9. Click to edit Master title style Game Changers Real Estate

    News Blue Cross moving HQ to 101 Huntington Avenue Blue Cross Blue Shield of Massachusetts is moving its headquarters to Boston Properties' (NYSE: BXP) 101 Huntington Ave. tower in Boston after the health insurer's lease at the Landmark Center expires in 2015, Blue Cross officials confirmed Thursday morning. “At a time when we’re doing all we can to keep our administrative costs as low as possible, 101 Huntington proved to be the most affordable option that will best meet the needs of our business and our valued associates,” President and CEO Andrew Dreyfus said in a prepared statement. Blue Cross Blue Shield will lease 330,000 square feet at 101 Huntington — slightly below the 368,000 square feet it leases at The Landmark. Terms of the new lease were not disclosed. 101 Huntington Ave. has 506,000 square feet of rentable space. The tower was built in 1972, according to Boston Properties. in 2011 by an investment group including JPMorgan Investment Management Inc. and Samuels & Associates. Mauris porta vestibulum sapien eu molestie. Praesent ac tellus mauris. In quis magna non est semper rutrum. Aenean sed magna a diam convallis lobortis ac non nulla. Pellentesque imperdiet feugiat eros lacinia consequat. Donec egestas ultricies elit eu laoreet. Duis ultrices aliquet massa at sodales. Praesent aliquam mauris vitae nulla accumsan elementum mauris. Suspendisse cursus, risus et commodo iaculis, ante libero vulputate ante, vel vehicula nisl metus vehicula diam. Pellentesque nec porta ante. Aliquam a arcu turpis, at tincidunt risus. Praesent lorem ligula, vulputate hendrerit vehicula in, mollis eget neque. Curabitur pretium gravida fringilla risus feugiat. Pellentesque ac tellus quis urna aliquam eleifend vel ac neque. Nulla iaculis sollicitudin consequat. Vestibulum posuere tortor vel mauris adipiscing quis malesuada turpis feugiat. Praesent sed enim nibh, ut pretium augue. Nunc metus enim, pharetra eget varius id, ullamcorper sit amet quam. Quisque dapibus est ut eros ullamcorper mollis. Vestibulum imperdiet felis vitae massa egestas id malesuada ligula elementum. Quisque consectetur diam lacus. Nulla non enim eget nunc varius molestie non eget ipsum. Aliquam mattis dapibus magna, non mollis eros euismod non. Phasellus risus nunc, porttitor nec Blue Cross also has offices in Quincy and Hingham and warehouse space in South Boston. The Landmark Center, a Fenway property with nearly 1 million square feet of space, was bought
  10. Click to edit Master title style The Boston Market |

    61M SF Overall: 13.1% Financial District - 33M SF: 15.2% Back Bay -12M SF: 9.4% Seaport - 6.5M SF: 12.2% Net Absorption: Rents: Vacancy: Overall: 1,487,576 SF Financial District: 1,391,398 SF Back Bay: (387,368) SF Seaport: 315,365 SF Class A: $45 - $75 per RSF Class B: $25 - $45 per RSF Seaport: $25 - $65 per RSF
  11. Click to edit Master title style Tower Study | 29.5M

    SF Financial District Back Bay Vacancy Rents 4.9% $45 to $65 3.3% 4.8% $45 to $75 8.9% 20th Floor 20th Floor
  12. Click to edit Master title style Areas of Opportunity 10,000

    SF Financial District 49 29 7 25,000 SF 100,000 SF Back Bay 13 8 3 Seaport District 11 8 2
  13. Click to edit Master title style New Developments Channel Center

    Fan Pier 888 Boylston Street Pier 4 | 5M SF Two Harbor Street Seaport Square
  14. Click to edit Master title style 185,000 SF Lovejoy Wharf

    Velocity 500,000 SF Channel Center 88,000 SF One Financial Center 82,000 SF 1 Marina Park Drive 400,000 SF 50 Post Office Square 330,000 SF 101 Huntington Avenue 65,000 SF One International Place 100,000 SF 327 Summer Street 170,000 SF 125 High Street 150,000 SF 10 Post Office Square 135,000 SF 500 Washington Street 129,000 SF One Federal Street 250,000 SF Thomson Place 245,000 SF One Financial Center 98,000 SF One Harbor Street Typical Size: 20,000 SF
  15. Click to edit Master title style Tenants in the Market

    | 4M SF 350,000 SF 125,000 SF 400,000 SF 150,000 SF 100,000 SF 100,000 SF 100,000 SF 100,000 SF 70,000 SF 300,000 SF 100,000 SF
  16. Click to edit Master title style Top 25 | 25%

    Active in 2012: Eleven (11) Total Requirements: 2.4M SF
  17. Click to edit Master title style Market Forecast 8.6% 13.1%

    10.2% -20% -15% -10% -5% 0% 5% 10% 15% 20% -3,000 -2,000 -1,000 0 1,000 2,000 3,000 2001 2002 2003 2004 2005 2006 2007 2008 2009 2010 2011 2012 2013 2014 2015 Vacancy Rates Future Absorption Absorption SF (in thousands)
  18. Click to edit Master title style Cambridge Trends ›Biotech-fueled building

    boom ›“New Golden Age” of MA biotech ›Kendall Square transition ›Crowding in + Crowding out ›“Live, Work, Play” progress
  19. Click to edit Master title style Biotech Vacancy | Absorption

    SF (Thousands) 252 -89 265 120 -70 493 14.0% 15.0% 17.0% 10.9% 0% 5% 10% 15% 20% -200 -100 0 100 200 300 400 500 600 2007 2008 2009 2010 2011 2012 Vacancy Rates Absorption 2010 2012 Market Size: 8.7M SF 2007 2009
  20. Click to edit Master title style Biotech Transactions | Velocity

    571 382 869 954 1,450 1,280 0 200 400 600 800 1,000 1,200 1,400 1,600 1,800 2007 2008 2009 2010 2011 2012 SF (Thousands) 369 500 515 439 420 1,030 370 910 New Lease Renewal 2012: 20 Transactions
  21. Click to edit Master title style Largest Lab Leases 110,000

    SF 110,000 SF 110,000 SF 102,000 SF 102,000 SF 102,000 SF 300,000 SF 300,000 SF 300,000 SF 91,000 SF 91,000 SF 91,000 SF 126,000 SF 126,000 SF 126,000 SF 244,000 SF 244,000 SF 244,000 SF 64,000 SF 64,000 SF 64,000 SF MIT
  22. Click to edit Master title style Class A - Existing

    Class A - Existing Rent: $54 - $65 TI: $25 - $125 Rent: $54 - $65 TI: $25 - $125 Class A - Existing Rent: $54 - $65 TI: $25 - $125 Build-to-Suit Build-to-Suit Rent: $65 - $76 TI: $150 - $200 Rent: $65 - $76 TI: $150 - $200 Build-to-Suit Rent: $65 - $76 TI: $150 - $200 Current Asking NNN Rents Average for Term Current Asking NNN Rents Average for Term Class B Class B Rent: $35 - $48 TI: $20 - $150 Rent: $35 - $48 TI: $20 - $150 Class B Rent: $35 - $48 TI: $20 - $150 Class A Shell Class A Shell Rent: $58 - $68 TI: $150 - $200 Rent: $58 - $68 TI: $150 - $200 Class A Shell Rent: $58 - $68 TI: $150 - $200
  23. Click to edit Master title style Office Vacancy | Absorption

    137 -345 -410 272 244 -83 8.6% 15.5% 10.0% 10.8% -10% -5% 0% 5% 10% 15% 20% -800 -600 -400 -200 0 200 400 600 800 1,000 1,200 1,400 2007 2008 2009 2010 2011 Vacancy Rates Absorption SF (Thousands) 2007 2010 2011 2012 Market Size: 10.3M SF
  24. Click to edit Master title style Core Kendall Square Market

    Very Tight!! 3.0% Vacancy 3.0% Vacancy MIT 193,000 SF 193,000 SF 193,000 SF 2 Canal Park 110,000 SF 110,000 SF 110,000 SF 10 Canal Park
  25. Click to edit Master title style Office Transaction Velocity 46

    Leases | 985,000 SF 47,000 SF 47,000 SF 47,000 SF 63,000 SF 63,000 SF 63,000 SF 48,000 SF 48,000 SF 48,000 SF 105,000 SF 105,000 SF 105,000 SF Total: 294,000 SF Extension: 140,000 SF Expansion: 104,000 SF New Construction: 50,000 SF Total: 294,000 SF Extension: 140,000 SF Expansion: 104,000 SF New Construction: 50,000 SF Total: 294,000 SF Extension: 140,000 SF Expansion: 104,000 SF New Construction: 50,000 SF MIT MIT
  26. Click to edit Master title style Asking Rents - Current

    1 & 101 Main Street $62.00/SF 13% Class A 215 First Street $46.50/SF 26% Class B 141 Portland Street $48.00/SF 14% Class B+
  27. Click to edit Master title style Migration to Seaport (and

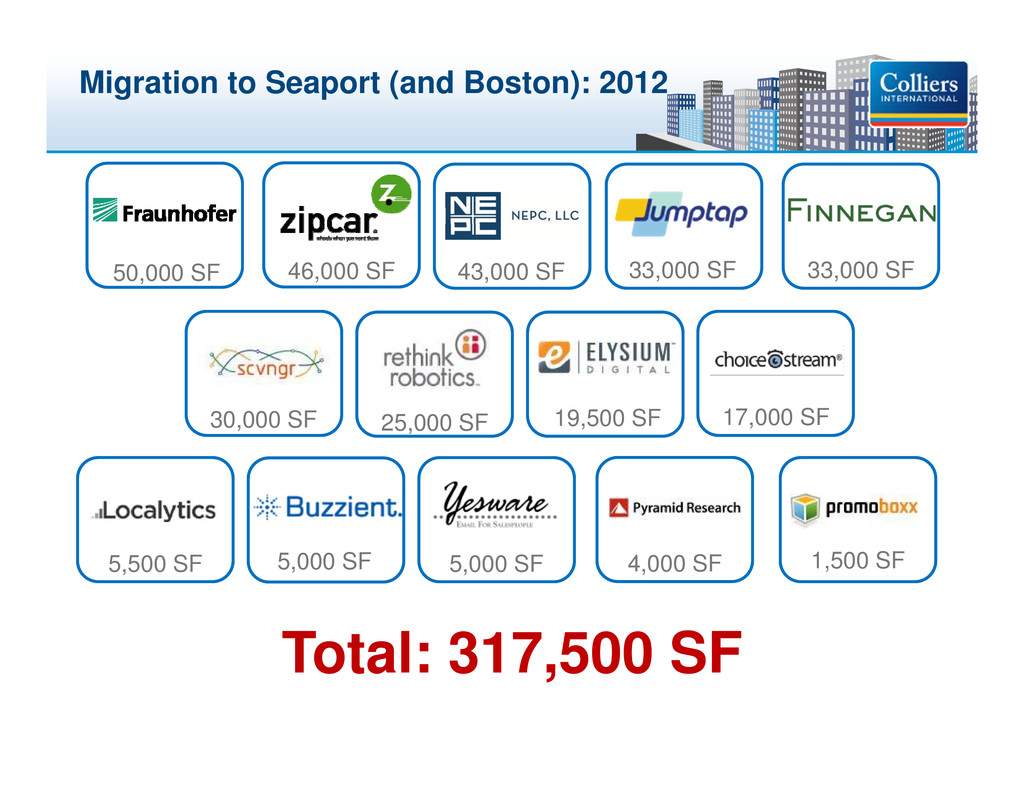
    Boston): 2012 50,000 SF 50,000 SF 50,000 SF 46,000 SF 46,000 SF 46,000 SF 43,000 SF 43,000 SF 43,000 SF 33,000 SF 33,000 SF 33,000 SF 33,000 SF 33,000 SF 33,000 SF 30,000 SF 30,000 SF 30,000 SF 25,000 SF 25,000 SF 25,000 SF 17,000 SF 17,000 SF 17,000 SF 5,000 SF 5,000 SF 5,000 SF 1,500 SF 1,500 SF 1,500 SF 5,000 SF 5,000 SF 5,000 SF 4,000 SF 4,000 SF 4,000 SF 19,500 SF 19,500 SF 19,500 SF 5,500 SF 5,500 SF 5,500 SF Total: 317,500 SF Total: 317,500 SF
  28. Click to edit Master title style Route 128  Cambridge

    Venture Capitalist Migration Existing Cambridge VCs Existing Cambridge VCs
  29. Click to edit Master title style Alexandria Center at Kendall

    Square 50 Binney Street - 549,000 SF 100 Binney Street - 416,000 SF
  30. Click to edit Master title style NorthPoint Build-to-Suits: 2,000,000 SF

    20 Child Street ›355 luxury units ›20 stories
  31. Click to edit Master title style MIT Kendall Square Rezoning

    Petition Office/Lab/Ret.: 1,000,000 SF Residential: 200,000 SF (300 units) Academic: 800,000 SF 26-acre district
  32. Click to edit Master title style MIT Kendall Square Rezoning

    Petition Main Street Live, Work, Play!
  33. Click to edit Master title style Kendall Square Restaurant Scene

    January 15, 2013 Hip at the Square: Kendall Square, with its local, independent businesses, has seen success that is a lesson in community-building.
  34. Click to edit Master title style Value! Value! Value! Transit!

    Transit! Transit! Parking! Parking! Parking! Amenities! Amenities! Amenities! Rent! Rent! Rent! Location! Location! Location! Image! Image! Image!
  35. Click to edit Master title style Coming Attractions… Waltham Place,

    Waltham Totten Pond Office Park, Waltham 5 & 15 Wayside Road, Burlington Riverside Center, Newton 120 & 150 Presidential Way, Woburn 1 & 2 Heritage Drive, Quincy Prologis Cabot Business Park Portfolio, Mansfield
  36. Click to edit Master title style Current Themes and Observations

    › Real estate a great relative value › High demand for “knowledge-based” economies › “Urbanism” guiding investment strategies › Declining debt costs lowering cap rates › Capital moving up the risk curve › Underwriting job growth potential
  37. Click to edit Master title style $0 $1 $2 $3

    $4 $5 $6 2007 2008 2009 2010 2011 2012 Apartment Industrial Retail Suburban Office CBD Office Aggregate Sales Volume in Greater Boston $15.1B $3.4B $1.9B $2.9B $5.2B $4.5B
  38. Click to edit Master title style 2012 Boston Buyers by

    Sector CBD Office Foreign REITs Funds Private Suburban Office User REITs Funds Private $1.6B $1.1B
  39. Click to edit Master title style 2012 Boston Buyers by

    Sector Multi-Family Foreign REITs Funds Private Retail Foreign REITs Funds Private $886M $313M
  40. Click to edit Master title style Public REIT Offerings 2006-2012

    (capital raised in billions) $0 $10 $20 $30 $40 $50 $60 $70 $80 2006 2007 2008 2009 2010 2011 2012 $ Billions Total Capital Secondary Equity Secondary Debt IPO Source: NAREIT $49B $36B $18B $35B $47B $51B $73B
  41. Click to edit Master title style CBD Headline: Capital Follows

    Tenants Fort Point Channel Office Portfolio › National Development / Angelo Gordon to Clarion › $129.3 million price - $317 per SF › 5% estimated cap rate; 6-building portfolio Brickman Seaport Portfolio › Brickman to DivcoWest › $106.7 million price - $294 per SF › 5.75% estimated cap rate; 4-building portfolio 451 D Street – The Fargo Building › Beal/Rockpoint to Shorenstein › $115 million price - $274 per SF › 6.5% estimated going-in cap rate
  42. Click to edit Master title style Suburban Headline: Funds Recognize

    Relative Value One Network Drive, Burlington › CarVal Investors to J.P. Morgan › $250 million price - $311 per SF › 6% estimated cap rate; 200,000 SF of expansion One and Three Burlington Woods, Burlington › Davis Co. to Colony Realty Partners › $54 million price - $202 per SF › 6% estimated cap rate; previous sale $32.7 million in 2010 Bedford Business Park, Bedford › Boston Properties to Davis Co. › $62.8 million price - $134 per SF › 8.6% going-in cap rate; mix of office and R&D
  43. Click to edit Master title style Fidelity Campus, Marlborough ›

    Fidelity to TJX Companies › $62.5 million price - $87 per SF › 700,000 SF in 2 buildings; sold vacant 770 Cochituate Road, Framingham › Campanelli, et al to TJX Companies › $116.6 million price - $145 per SF › 801,000 SF; TJX in occupancy One Constitution Way, Foxborough › REIT Management to Meditech › $19.8 million price - $95 per SF › 208,000 SF; fully vacant at sale Suburban Headline: Users Lock-in Occupancy Costs
  44. Click to edit Master title style 801 Boylston Street ›

    Tribeca Holdings to Frazer (Ireland) › $27 million price - $799 per SF › Fidelity in retail space 815 Boylston Street › Heritage Legacy to Tribeca (U.K.) › $27.5 million price - $1,288 per SF › Apple flagship; sub 4% cap rate Retail Headline: Off-Shore Buyers Prize “High Street” 28 Newbury Street › Private investors to Safra affiliate (Brazil) › $26.7 million price - $1,404 per SF › Banana Republic; sub 5% cap rate
  45. Click to edit Master title style Boston Core Cap Rates

    By Property Type 0% 1% 2% 3% 4% 5% 6% 7% 8% 9% 10% Apartment Grocery Retail CBD Office Warehouse Suburban Office Flex 12 Months Ago Current Current vs. 12 Months Ago
  46. Click to edit Master title style Core Cap Rates vs.

    Debt 0% 1% 2% 3% 4% 5% 6% 7% 8% 9% 03 04 05 06 07 08 09 10 11 12 Average Cap Rates 10-Year Treasuries Average Mortgage Coupons 200 bps 450 bps 420 bps
  47. Click to edit Master title style Outlook for 2013 ›

    Interest rates/cap rates remain low › Capital seeking yield › NOI poised to grow › Pricing relative to replacement cost › Expiring loan modifications › Demand not immune to macro concerns › Sellers recognize optimal timing
  48. Click to edit Master title style 0 2 4 6

    8 10 12 14 16 0 0.0000002 0.0000004 0.0000006 0.0000008 0.000001 0.0000012 1960 1965 1970 1975 1980 1985 1990 1995 2000 2005 2010 10-year Treasury Nominal Interest Rate History % % % % % % % % %
  49. Click to edit Master title style Construction Activity 0 2

    4 6 8 10 12 14 16 0 2 4 6 8 10 12 14 16 1960 1965 1970 1975 1980 1985 1990 1995 2000 2005 2010 Millions SF 10‐year Treasury and SF Construction SF Office and R&D 10 Year Treasury (Avg Annual) % % % % % % % % %
  50. Click to edit Master title style Multi-Family Construction 2011 Boston

    Metro 120 2,224 3,041 2012 2013 Suffolk County 120 335 1,233 SOURCE: Property & Portfolio Research
  51. Click to edit Master title style Retail Sales of 2012

    Boylston Street $27M 28 Newbury Street $27M Liberty Wharf $70M 4-6 Newbury Street $50M 18-28 JFK Street $32M 801 Boylston Street $27M
  52. Click to edit Master title style Retail Leases of 2012

    - Suburban Chestnut Hill Shopping Center Bierbrier Development Newton Center
  53. Click to edit Master title style Bricks vs. Clicks April

    15, 2012 Online Vs. Brick-and-Mortar: Which Is Better for Back to School Shopping? September 25, 2012 Why Brick-and-Mortar Stores Will Trump Online in End: CEO Main Street Fairness Act Draws Amazon Support, eBay Opposition August 1, 2011 Main Street Fairness Act Draws Amazon Support, eBay Opposition June 6, 2012 November 18, 2009 Shopping online vs. shopping in-store local
  54. Click to edit Master title style Migration Pattern 0 500

    1,000 1,500 2,000 2,500 2011 2012 2013 2014 Total New Residential Units – City of Boston In Construction, Dec 2012 Potential Future Deliveries
  55. Click to edit Master title style Looking Ahead > Vacancy

    > Rents > Survival of the Fittest > Technology to Continue to Elevate Shopping Experience > City Neighborhoods to Add Service Establishments
  56. Click to edit Master title style Don’t Stop the Party

    > Casinos Coming into Focus > Liquor Sales Licenses Increase > Medical Marijuana Dispensaries
  57. Click to edit Master title style ________________________________________________ • Market sf

    includes partners’ share of JV properties • Other Markets include Atlanta, Austin, Chicago, Columbus, Dallas, Denver, Florida, Las Vegas, Minneapolis, New Orleans, Seattle, and Washington D.C. Equity Office is Blackstone’s domestic office operating platform consisting of 65.7m sf BOSTON 24.3% of Portfolio 12.2m sf NORTHERN CALIFORNIA 25.7% of Portfolio 16.3m sf SOUTHERN CALIFORNIA 7.6% of Portfolio 19.6m sf NEW YORK 13.4% of Portfolio 3.1m sf OTHER MARKETS 9.0% of Portfolio 14.5m sf Office Portfolio
  58. Click to edit Master title style Occupancy Comparison 30 Top

    Office Markets by Occupancy (‘00 v.’12E) Number of 30 Top Markets with Occupancy over 90% ________________________________________________ Source: Green Street Advisors 10/16/2012 25 5 0 0 1 11 12 6 0 5 10 15 20 25 30 >90% 85‐90% 80‐85% <80% Number of Markets Occupancy 2000 2012 23 25 2 2 2 2 4 9 10 5 1 1 1 1 0 5 10 15 20 25 30 Number of Markets In ‘00, no major U.S. Office market had vacancy above 15%, compared to more than half of markets currently Washington D.C.
  59. Click to edit Master title style U.S. Office Market Statistics

    ________________________________________________ Source: Green Street Advisors and Reis. U.S. net absorption recorded an eighth consecutive positive quarter (total 38m sf), after 11 quarters of decline (total 117m sf) 6 10 19 9 19 12 15 15 15 12 9 11 18 14 5 (2) (4) (13) (17) (23) (17) (17) (11) (9) 0 (4) 3 6 4 5 6 5 4 5 (30) (25) (20) (15) (10) (5) 0 5 10 15 20 25 Net Absorption (U.S. Top 50) (sf in millions)
  60. Click to edit Master title style Jobs _______________________________________________ Source: Federal

    Bureau of Labor Statistics, through November 2012. 0 2 4 6 8 10 12 (1,200) (1,000) (800) (600) (400) (200) ‐ 200 400 600 800 1,000 1,200 1970 1980 1990 2000 2010 Unemployment Rate Employmees in thousands Employment Growth / (Loss) Job Growth / (Loss) Unemployment Rate 8.8m jobs lost 4.1m jobs gained
  61. Click to edit Master title style $15.00 $20.00 $25.00 $30.00

    $35.00 8% 10% 12% 14% 16% 18% Asking Rent Vacancy Rate U.S. Office Market Market Vacancy and Asking Rents Source: CB Richard Ellis Econometric Advisors, Q3 2012. Office vacancy has dropped for the past 10 quarters and as a result rents have gradually increased
  62. Click to edit Master title style Tech demand driving market

    Office Market Trends: Northern California – Silicon Valley & Peninsula  Palo Alto epicenter; Demand is pushing further into San Jose and Central Peninsula  Rents at 2007 levels  Development pipeline beginning to grow; most space is pre-committed Northern California – Silicon Valley and Peninsula $ PSF Rents (Gross) & Vacancy Rate $45 $79 $36 $27 $24 $25 $28 $31 $42 $40 $32 $32 $38 $41 0% 5% 10% 15% 20% 25% $0 $10 $20 $30 $40 $50 $60 $70 $80 1999 2000 2001 2002 2003 2004 2005 2006 2007 2008 2009 2010 2011 2012 Average Ask Rate (Gross) Overall Vacancy ________________________________________________ Source: CBRE Silicon Valley and Peninsula Office All Classes as of 9/30/2012, weighted by inventory
  63. Click to edit Master title style Tech tenants with entertainment

    / gaming focus driving demand Office Market Trends: Southern California – West LA Southern California – West LA $ PSF Rents (Gross) & Vacancy Rate ________________________________________________ Source: CBRE West LA All Classes as of 9/30/12 $24 $25 $30 $31 $38 $37 $33 $33 $33 $34 $39 $53 $50 $42 $39 $39 $40 0% 2% 4% 6% 8% 10% 12% 14% 16% 18% $0 $10 $20 $30 $40 $50 $60 1996 1997 1998 1999 2000 2001 2002 2003 2004 2005 2006 2007 2008 2009 2010 2011 2012 Average Ask Rate (Gross) Overall Vacancy  Santa Monica most vibrant with demand moving east and south  Vacancy rate in Southern CA has decreased for five consecutive quarters  Rental rates improving but more gradually than NorCal
  64. Click to edit Master title style Demand down / minimal

    large new deals in 2012 Office Market Trends: New York – Midtown New York – Midtown $ PSF Rents (Gross) & Vacancy Rate $38 $41 $50 $55 $68 $65 $58 $54 $58 $60 $70 $91 $90 $65 $66 $71 $73 0% 2% 4% 6% 8% 10% 12% 14% 16% $0 $10 $20 $30 $40 $50 $60 $70 $80 $90 $100 1996 1997 1998 1999 2000 2001 2002 2003 2004 2005 2006 2007 2008 2009 2010 2011 2012 Average Ask Rate (Gross) Overall Vacancy  Technology demand continues to grow; Midtown West is anticipated to benefit from limited availability in Midtown South / Chelsea  Financial / Legal sectors remain soft  Asking rents flat / modestly higher y-o-y; concessions rising slightly ________________________________________________ Jones Lang LaSalle Class A as of 9/30/2012
  65. Click to edit Master title style Vacancy decreasing with rent

    growth in Back Bay Office Market Trends: Boston – CBD  Technology demand driving Cambridge and Seaport markets  Price-conscious tenants beginning to seek space in Financial District  CBD remains soft due to financial / legal tenant base Boston – CBD $ PSF Rents (Gross) & Vacancy Rate ________________________________________________ Source: C&W CBD Class A as of 9/30/2012 $33 $37 $44 $50 $58 $54 $47 $38 $37 $40 $46 $67 $62 $46 $44 $48 $49 0% 2% 4% 6% 8% 10% 12% 14% 16% $0 $10 $20 $30 $40 $50 $60 $70 1996 1997 1998 1999 2000 2001 2002 2003 2004 2005 2006 2007 2008 2009 2010 2011 2012 Average Ask Rate (Gross) Overall Vacancy
  66. Click to edit Master title style 128 $202 $230 $12

    $2 $11 $31 $31 $0 $60 $120 $180 $240 '06 '07 '08 '09 '10 '11 '12 YTD U.S. CMBS Issuance(1) ($ in billions) Global credit crisis also caused enormous dislocation in the commercial real estate industry 0% 2% 4% 6% 8% (1) Source: Credit Suisse “CMBS Weekly Report” October 2012. (2) Source: JPMorgan “European ABS Weekly Data Sheet” November 19, 2012. European CMBS Issuance(2) (€ in billions) Major Financial Institutions Have Exited or Downsized Opportunistic Real Estate Investing € 68.8 € 66.1 € 8.2 € 25.2 € 4.9 € 1.7 € 4.1 € 0 € 20 € 40 € 60 € 80 '06 '07 '08 '09 '10 '11 '12 YTD CMBS Loans in Special Servicing(1) (% of current balance) Down 87% Down 94%
  67. Click to edit Master title style Supply: U.S. Overall Low

    New Supply: A sliver lining to a week picture for office demand is that overall supply growth remains low. A small uptick in new supply is expected moving forward, but new construction should remain subdued relative to past norms. ________________________________________________ Green Street Advisors, November 29, 2012 0% 1% 2% 3% 4% 5% 1988 1992 1996 2000 2004 2008 2012E 2016E U.S. Office Completions as % of Existing Stock Historical Avg: 1.8%
  68. Click to edit Master title style U.S. Treasury Bond Interest

    Rate History 0% 2% 4% 6% 8% 10% 12% 14% 16% 1962 1972 1982 1992 2002 2012 Interest Rate _______________________________________________ Source: federalreserve.gov
  69. Click to edit Master title style 2012 Marks the Highest

    Volume Year on Record for REIT Issuance ________________________________________________ Note: Excludes residential mortgage REITs. Source: Deutsche Bank. 1.1 6.0 5.1 9.0 12.3 9.9 19.9 12.9 8.0 20.6 22.0 18.8 26.5 250 500 750 1,000 1,250 $0 $5 $10 $15 $20 $25 $30 2000 2001 2002 2003 2004 2005 2006 2007 2008 2009 2010 2011 2012 YTD RMZ Issuance ($bn) Equity REIT Issuance Follow‐On IPOs Convert RMZ
  70. Click to edit Master title style Public Company Debt Costs

    Public Company Debt Costs Company Sector Bond Yields (1) Retail 2.4% Apartments 2.7% Retail 2.8% Office 2.9% Healthcare 3.2% Industrial 3.3% Retail 3.3% ________________________________________________ (1) YTW as of November 2, 2012. Bond maturities between 7-10 years.