Upgrade to Pro — share decks privately, control downloads, hide ads and more …

CIDUE 2011

CIDUE 2011

Slides from the IEEE Symposium on Computational Intelligence in Dynamic and Uncertain Environments

Gregory Ditzler

July 12, 2013
Tweet

More Decks by Gregory Ditzler

Other Decks in Research

Transcript

  1. Hellinger Distance Based Drift Detection for Nonstationary Environments Gregory Ditzler

    and Robi Polikar Rowan University Signal Processing & Pattern Recognition Laboratory Dept. of Electrical & Computer Engineering [email protected] [email protected] This material is based upon work supported by the National Science Foundation under Grant No 0926159. Any opinions, findings, and conclusions or recommendations expressed in this material are those of the author(s) and do not necessarily reflect the views of the National Science Foundation.
  2. Contents • Introduction • Motivation • Approach – HDDDM •

    Experimental Results • Conclusions Introduction Motivation HDDDM Results Conclusions
  3. About Greg Contact Email: [email protected] Website: http://sites.google.com/site/gregditzler/ Awards 1. 2011

    Excellence in Graduate Research, Rowan University 2. 2011 Graduate Research/Teaching Fellowship, Drexel University 3. 2009 Graduate Research Assistantship, Rowan University 4. 2008 Award for Service to the IEEE Student Branch, Pennsylvania College of Technology 5. 2008 Award for Service to the College and Community, Pennsylvania College of Technology Introduction Motivation HDDDM Results Conclusions
  4. Why is change detection important? • Specific Example: predict adds

    that are relevant to a user’s interests o User interests are known to evolve – or drift – with time o Algorithms must identify the change in a user’s interest to be considered useful o Ok, that is a simple example, but where can I find this in practice? • Yandex.Direct  selects ads which reflect the user’s current interest • Google Adsense  display adds related to the content of your webpage • The above applications are related through contextual advertising • General Examples: electricity demand, financial, climate, epidemiological, and spam (too name a few) Introduction Motivation HDDDM Results Conclusions
  5. Detecting Concept Drift/Change • Control chart derived detection methods o

    Shrewhart and CUSUM are control charts commonly used in drift detection (derived from monitoring processes) [2-4] o CI-CUSUM – pdf free extension to the CUSUM [5;6] • ICI-rule based drift detection [7] o Use the intersection of confidence intervals (ICI) rule to detect a nonstationary change when the distribution is unknown. • Methods like control charts and the ICI-rule may monitor features, but classifier error is another possibility o EDDM – use classifier error and the distances between classifier error to determine when sufficient evidence is found to detect change [8] • Extension of DDM • Cieslak & Chawla [12] suggest using the Hellinger distance to measure bias between a training and testing source o A framework was developed from monitoring a classifier’s failure on a testing dataset o We use this a stepping stone to tackle drift detection in an incremental learning scenario Introduction Motivation HDDDM Results Conclusions
  6. Properties of the approach • Properties of drift detection algorithms

    [4] o data chunks: batch based • as opposed to processing an instance at a time o information used: raw features • as opposed to error or features which summarize the data (mean, median, variance, kurtosis,…) o change detection mode: explicit • as opposed to implicit detection which will not flag drift being detected o classifier specific vs. classifier-free: classifier free • Strategy: use recent raw features from sequential batch data to determine if there is enough evidence to suggest if the data instances are sampled from different distributions Introduction Motivation HDDDM Results Conclusions
  7. Hellinger distance I • Hellinger distance: measure of distribution similarity

    o & are relative frequency charts with bins, i.e. histograms of the features • Rule of thumb  = where is the number of instances in the batch o Computed as the averaged of the Hellinger distance of the individual features [12] • Properties o 0 ≤ , ≤ 2 o , = 2 if and only if and are completely divergent, i.e. no overlap o , = 0 if and are equal , = 1 , , =1 − , , =1 2 =1 =1 (1) Introduction Motivation HDDDM Results Conclusions
  8. Hellinger distance II • Advantages of the Hellinger Distance o

    Straight forward interpretation of the divergence between two distributions o No assumption about the distribution of the data o We can avoid holding on to old data by keeping a histogram of the data over time , = 1 , , =1 − , , =1 2 =1 =1 (1) Introduction Motivation HDDDM Results Conclusions
  9. t=0 t=100 t=25 t=75 A simple example I • Example:

    two Gaussian components each belonging to a different class where o Centers: 1 = cos , sin and 2 = − 1 o Covariance: Σ1 = Σ2 = 0.5 ∗ o = 2 where where is the number of cycles, is the (integer valued) time stamp that iterates from zero to − 1, and is a 2×2 identity matrix. • Compute Hellinger distance between the 1st batch and each subsequent batch of data Introduction Motivation HDDDM Results Conclusions
  10. A simple example II 0 100 200 300 400 500

    600 0 0.1 0.2 0.3 0.4 0.5 0.6 0.7 0.8 all  1  2 0 100 200 300 400 500 600 0.06 0.07 0.08 0.09 0.1 0.11 0.12 0.13 0.14 0.15 0.16 all  1  2 Fig. Hellinger distance computed on a rotating Gaussian centers problem. The Hellinger distance is computed between datasets 1 and where = 2,3, … , 600 for 1 , 2 , and all classes. Recurring environments occur when the Hellinger distance is at a minimum. Fig. Hellinger distance computed on a static Gaussian problem. The Hellinger distance is computed between 1 and where = 2,3, … , 600 for 1 , 2 , and all classes. • The Hellinger distance changes as the Gaussian components drift away from and towards the original component location • No drift  no variation in the Hellinger distance • Natural bias in the sample is responsible for a non-zeros Hellinger distance Introduction Motivation HDDDM Results Conclusions
  11. Proposed Approach • Hellinger Distance Drift Detection Method (HDDDM) o

    Relies only on the raw data features to estimate whether drift is present in a supervised incremental learning scenario o Hellinger distance is used to infer whether drift is present between two batches of data using an adaptive threshold o Inspired by Cieslak & Chawla’s study of bias and classifier failure [12] • Assumption o Data distributions have finite support: ≤ = 0 for ≤ 1 and ≥ = 0 for ≥ 2, where T1 < T2 are finite real numbers. • this assumption is primarily required because of our histogram implementation • HDDDM is designed for truly incremental learning scenarios and can be applied to supervised, i.e. change in (|), as well as unsupervised learning scenarios, i.e. change in () Introduction Motivation HDDDM Results Conclusions
  12. HDDDM I Algorithm Description Algorithm Pseudo Code • Initialize =

    1 and = 1 o where indicates the last time change was detected o 1 is established as the first baseline reference • Construct histograms from and from • The HD between the two histograms and is then computed using Eq. (1). • Compute (), the difference in divergence between , and − 1 • Compute the mean, , and standard deviation, , of () o where = , + 1, … , − 1 o current time stamp and all steps before are not included in the mean difference calculation Input: Training data, = () ∈ (); ∈ Ω where = 1,2, … Initialize: = 1 then = 1 for = 2,3, … do • Generate a histogram, , from and a histogram, , from .Each histogram has bins. • Calculate the Hellinger distance between and using Eq. (1). Call this . • Compute the difference in Hellinger distance = − − 1 • Update the adaptive threshold = 1 − − 1 −1 = = − 2 −1 = − − 1 • Compute using the standard deviation or the confidence interval method. • Determine if drift is present if > then = Reset by setting = Indicate change was detected else Update with → = , end if end for Introduction Motivation HDDDM Results Conclusions
  13. HDDDM II Algorithm Description Algorithm Pseudo Code • Compute the

    adaptive threshold, , at time step • Deviation test = + where is some positive/real constant, indicating how many standard deviations of change around the mean we accept as “different enough”. • Confidence test = + 2, − − 1 where 2, where is the two tailed -statistic with degrees of freedom • We use + and not ± o flag drift when the magnitude of the change is significantly greater than the average of the change in recent time Input: Training data, = () ∈ (); ∈ Ω where = 1,2, … Initialize: = 1 then = 1 for = 2,3, … do • Generate a histogram, , from and a histogram, , from .Each histogram has bins. • Calculate the Hellinger distance between and using Eq. (1). Call this . • Compute the difference in Hellinger distance = − − 1 • Update the adaptive threshold = 1 − − 1 −1 = = − 2 −1 = − − 1 • Compute using the standard deviation or the confidence interval method. • Determine if drift is present if > then = Reset by setting = Indicate change was detected else Update with → = , end if end for Introduction Motivation HDDDM Results Conclusions
  14. HDDDM III Algorithm Description Algorithm Pseudo Code • If ()

    > () then we signal that change has been detected o reset = and = • If drift is not detected, then we update, the distribution with the new data • This histogram can be updated or reset using the following equation: , ← , + , , if drift is not detected , ← , , if drift is detected • We need only retain the histogram of rather than the data o HDDDM fulfills the incremental learning requirement Input: Training data, = () ∈ (); ∈ Ω where = 1,2, … Initialize: = 1 then = 1 for = 2,3, … do • Generate a histogram, , from and a histogram, , from .Each histogram has bins. • Calculate the Hellinger distance between and using Eq. (1). Call this . • Compute the difference in Hellinger distance = − − 1 • Update the adaptive threshold = 1 − − 1 −1 = = − 2 −1 = − − 1 • Compute using the standard deviation or the confidence interval method. • Determine if drift is present if > then = Reset by setting = Indicate change was detected else Update with → = , end if end for Introduction Motivation HDDDM Results Conclusions
  15. Experiment Design • Synthetic and real world datasets were selected

    to evaluate the HDDDM algorithm o Four synthetic and three real-world o Drift is synthetically injected into the database from UCI [18] (*** MAGIC) • Sort by a feature in ascending order and divide the entire data in bins. o Train on current bin; Test on next future bin • Missing at Random (MAR) bias • Experimental Setup o Use histograms in HDDDM to model | and Dataset Instances Source Drift type Checkerboard [15] 800,000 Synthetically Generated Synthetic Elec 27,5494 Web source1 Natural SEA [5%] 400,000 Synthetically Generated Synthetic RandGauss 812,500 Synthetically Generated Synthetic Magic 13,065 UCI2 Synthetic NOAA 18,159 NOAA3 Natural GaussCir 950,000 Synthetically Generated Synthetic 1. http://www.liaad.up.pt/~jgama/ales/ales_5.html 2. UCI Machine Learning Repository (http://www.ics.uci.edu/~mlearn/) 3. National Oceanic and Atmospheric Administration(www.noaa.gov) 4. All missing instances with missing features have been removed Introduction Motivation HDDDM Results Conclusions
  16. Parameter → Measure ↓ 0.5 1.0 1.5 2.0 0.05 0.1

    F-measure (1) 0.80 0.84 0.78 0.64 0.79 0.82 Sensitivity (1) 1.0 0.97 0.81 0.61 0.98 1.0 Specificity (1) 0.97 0.98 0.98 0.99 0.97 0.97 F-measure (2) 0.79 0.81 0.78 0.64 0.82 0.80 Sensitivity (2) 0.99 0.94 0.86 0.58 0.97 0.98 Specificity (2) 0.97 0.98 0.98 0.98 0.89 0.97 Performance 0.81 0.87 0.91 0.92 0.85 0.82 1 22 42 62 82 102 122 142 162 182 202 222 242 262 282 1 2 3 4 5 6 Postive Class 0.05   0.10   0.50   1.00   1.50   2.00   1 22 42 62 82 102 122 142 162 182 202 222 242 262 282 1 2 3 4 5 6 Negative Class 0.05   0.10   0.50   1.00   1.50   2.00   Abrupt Change in Checker-board Data • Total of 15 concept changes (abrupt) • Table below indicates F-measure, sensitivity and specificity of the HDDDM’s detections as averages of 10 independent trials • Easily computed since drift location is known • Performance measure indicates the detection rate across all data • We observe HDDM’s location of drift detection on 1 and 2 from the rotating checkerboard dataset • Each marker that coincides with the vertical lines is a correct detection of drift. • Each marker that falls off a vertical grid is a false alarm of a non-existing drift Introduction Motivation HDDDM Results Conclusions
  17. HDDDM Assessment Generate two naïve Bayes classifiers with the 1st

    database. Call them 1 and 2 . for = 2,3, … do • Begin processing new databases for the presence of concept drift using HDDDM. o 1 is our target classifier which is updated or reset based on HDDDM decision. If drift is detected using HDDDM, reset 1 and train 1 only on the new data, otherwise incrementally update 1 with the new data. o Regardless of whether or not drift is detected, 2 is incrementally trained with the new data. 2 is therefore the control classifier that is not subject to HDDDM intervention. o Compute error of 1 and 2 on new test data end for Introduction Motivation HDDDM Results Conclusions
  18. 0 50 100 150 0.2 0.25 0.3 0.35 0.4 0.45

    0.5 0.55 0.6 0.65 Time Stamp Error NOAA120 No Update =0.5 =1.0 =1.5 =2.0 =0.1 0 50 100 150 200 250 300 0.25 0.3 0.35 0.4 0.45 0.5 0.55 0.6 0.65 0.7 0.75 Time Stamp Error Checkerboard No Update =0.5 =1.0 =1.5 =2.0 =0.1 0 10 20 30 40 50 60 70 0 0.05 0.1 0.15 0.2 0.25 0.3 0.35 0.4 0.45 0.5 Time Stamp Error Magic04 No Update =0.5 =1.0 =1.5 =2.0 =0.1 0 10 20 30 40 50 60 0.25 0.3 0.35 0.4 0.45 0.5 0.55 0.6 Time Stamp Error Elec2 No Update =0.5 =1.0 =1.5 =2.0 =0.1 (a) (b) (d) (e) 0 20 40 60 80 100 120 140 0 0.05 0.1 0.15 0.2 0.25 0.3 0.35 0.4 0.45 Time Stamp Error Parametric Gaussian No Update =0.5 =1.0 =1.5 =2.0 =0.1 (c) 0.06 0.08 0.1 0.12 0.14 0.16 0.18 0.2 0.22 Error SEA (5%) No Update =0.5 =1.0 =1.5 =2.0 =0.1 (g) 0 50 100 150 200 250 300 350 400 0.2 0.3 0.4 0.5 0.6 0.7 0.8 0.9 Time Stamp Error Checkerboard No Update =0.5 =1.0 =1.5 =2.0 =0.1 (f) 0 0.1 0.2 0.3 0.4 0.5 0.6 0.7 0.8 0.9 1 Error Parametric Gaussian No Update =0.5 =1.0 =1.5 =2.0 =0.1 (h) Fig. 8. Error evaluation of the online naïve Bayes classifiers (updated and dynamically reset) with a variation in the parameters of the Hellinger Distance Drift Detection Method (HDDDM). (a) Checker board with abrupt changes in rotation, (b) NOAA (120 instances), (c) RandGauss, (d) magic, (e) elec, (f) checkerboard with continuous drift, (g) SEA (5% noise), and (h) GaussCir.
  19. Conclusions • Proposed approach uses raw features to estimate whether

    drift is present in an incremental learning scenario o Hellinger distance is used as a measure to quantify the “overlap” between a baseline and the current distribution o An adaptive threshold in used in conjunction with the difference in Hellinger distance to determine when drift is present o Two formulations of the adaptive threshold have been presented and analyzed • Our HDDDM approach can be used in conjunction with a classifier to decrease the error of the classification system o Control classifier is updated all the time o HDDDM+OLC resets a classifier when HDDDM detects drift, otherwise the classifier is trained on new data o Results indicate that HDDDM+OLC can efficiently detect drift on controlled experiments • Future work: integration of other detection procedure to reinforce the decision of the HDDDM as well as addressing false alarms in only one class Introduction Motivation HDDDM Results Conclusions
  20. References 1. A. Tsymbal, "Technical Report: The problem of concept

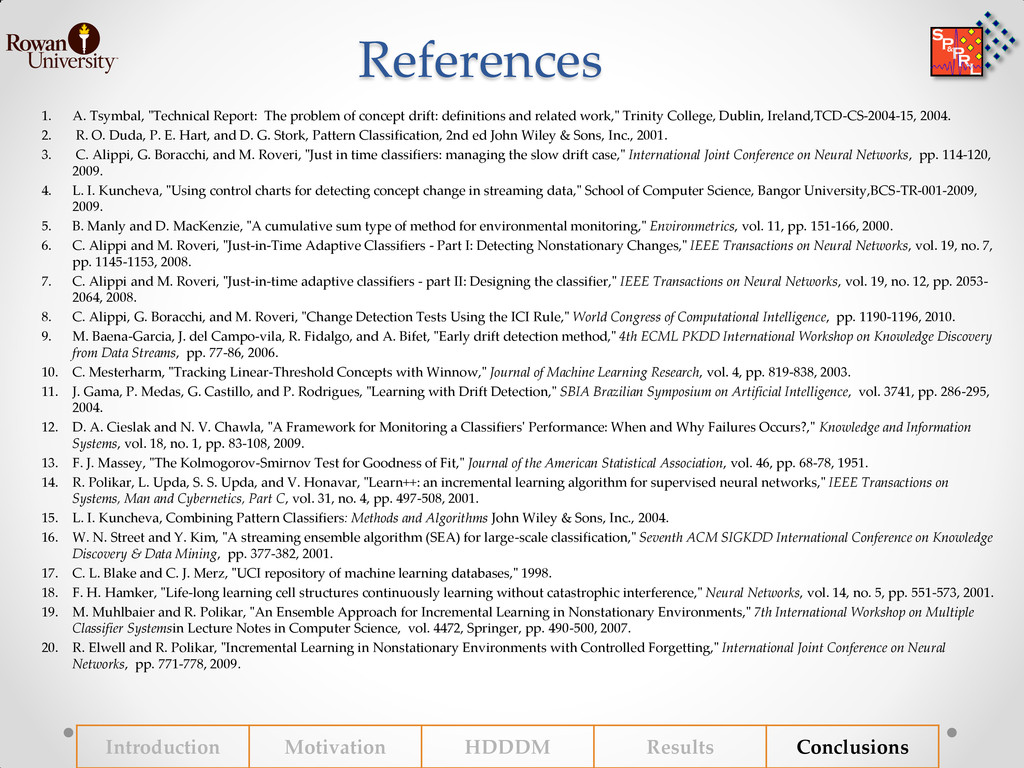
    drift: definitions and related work," Trinity College, Dublin, Ireland,TCD-CS-2004-15, 2004. 2. R. O. Duda, P. E. Hart, and D. G. Stork, Pattern Classification, 2nd ed John Wiley & Sons, Inc., 2001. 3. C. Alippi, G. Boracchi, and M. Roveri, "Just in time classifiers: managing the slow drift case," International Joint Conference on Neural Networks, pp. 114-120, 2009. 4. L. I. Kuncheva, "Using control charts for detecting concept change in streaming data," School of Computer Science, Bangor University,BCS-TR-001-2009, 2009. 5. B. Manly and D. MacKenzie, "A cumulative sum type of method for environmental monitoring," Environmetrics, vol. 11, pp. 151-166, 2000. 6. C. Alippi and M. Roveri, "Just-in-Time Adaptive Classifiers - Part I: Detecting Nonstationary Changes," IEEE Transactions on Neural Networks, vol. 19, no. 7, pp. 1145-1153, 2008. 7. C. Alippi and M. Roveri, "Just-in-time adaptive classifiers - part II: Designing the classifier," IEEE Transactions on Neural Networks, vol. 19, no. 12, pp. 2053- 2064, 2008. 8. C. Alippi, G. Boracchi, and M. Roveri, "Change Detection Tests Using the ICI Rule," World Congress of Computational Intelligence, pp. 1190-1196, 2010. 9. M. Baena-Garcia, J. del Campo-vila, R. Fidalgo, and A. Bifet, "Early drift detection method," 4th ECML PKDD International Workshop on Knowledge Discovery from Data Streams, pp. 77-86, 2006. 10. C. Mesterharm, "Tracking Linear-Threshold Concepts with Winnow," Journal of Machine Learning Research, vol. 4, pp. 819-838, 2003. 11. J. Gama, P. Medas, G. Castillo, and P. Rodrigues, "Learning with Drift Detection," SBIA Brazilian Symposium on Artificial Intelligence, vol. 3741, pp. 286-295, 2004. 12. D. A. Cieslak and N. V. Chawla, "A Framework for Monitoring a Classifiers' Performance: When and Why Failures Occurs?," Knowledge and Information Systems, vol. 18, no. 1, pp. 83-108, 2009. 13. F. J. Massey, "The Kolmogorov-Smirnov Test for Goodness of Fit," Journal of the American Statistical Association, vol. 46, pp. 68-78, 1951. 14. R. Polikar, L. Upda, S. S. Upda, and V. Honavar, "Learn++: an incremental learning algorithm for supervised neural networks," IEEE Transactions on Systems, Man and Cybernetics, Part C, vol. 31, no. 4, pp. 497-508, 2001. 15. L. I. Kuncheva, Combining Pattern Classifiers: Methods and Algorithms John Wiley & Sons, Inc., 2004. 16. W. N. Street and Y. Kim, "A streaming ensemble algorithm (SEA) for large-scale classification," Seventh ACM SIGKDD International Conference on Knowledge Discovery & Data Mining, pp. 377-382, 2001. 17. C. L. Blake and C. J. Merz, "UCI repository of machine learning databases," 1998. 18. F. H. Hamker, "Life-long learning cell structures continuously learning without catastrophic interference," Neural Networks, vol. 14, no. 5, pp. 551-573, 2001. 19. M. Muhlbaier and R. Polikar, "An Ensemble Approach for Incremental Learning in Nonstationary Environments," 7th International Workshop on Multiple Classifier Systemsin Lecture Notes in Computer Science, vol. 4472, Springer, pp. 490-500, 2007. 20. R. Elwell and R. Polikar, "Incremental Learning in Nonstationary Environments with Controlled Forgetting," International Joint Conference on Neural Networks, pp. 771-778, 2009. Introduction Motivation HDDDM Results Conclusions