Upgrade to Pro — share decks privately, control downloads, hide ads and more …

Dynamic clinical prediction models for cardiac surgery

Dynamic clinical prediction models for cardiac surgery

Presented at the SCTS Annual Meeting 2013, Brighton, UK (17-19 March, 2013)

Graeme Hickey

March 18, 2013
Tweet

More Decks by Graeme Hickey

Other Decks in Research

Transcript

  1. Dynamic  clinical  predic.on  
    models  for  cardiac  surgery  
    Hickey  GL1,  Grant  SW2,  Caiado  C3,  Kendall  S4,    
    Dunning  J4,  Poullis  M5,  Buchan  I1,  Bridgewater  B1,2  
     
    1Northwest  Ins.tute  of  Bio-­‐Health  Informa.cs;  2University  Hospital  of  South  
    Manchester;  3University  of  Durham;  4The  James  Cook  University  Hospital;    
    5Liverpool  Heart  and  Chest  Hospital  
    This  research  was  generously  funded  by  
    Heart  Research  UK  [Grant  Number  RG2583]  
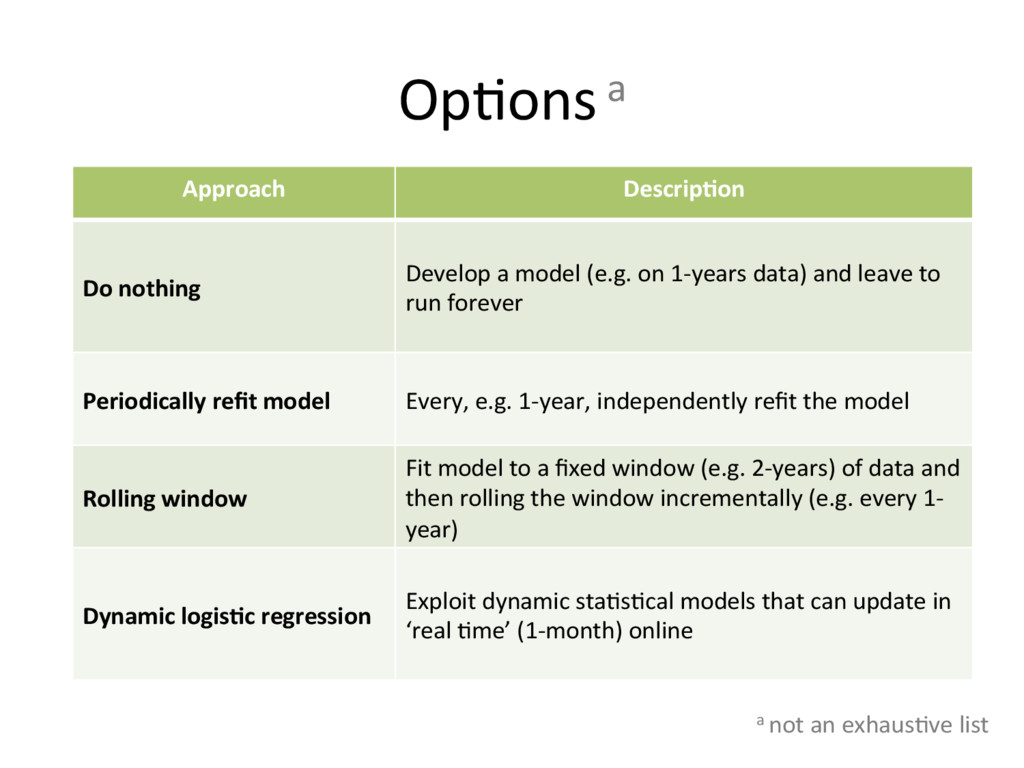
    View Slide

  2. History  of  clinical  predic.on  models  
    for  cardiac  surgery  
    1989  
    • Parsonnet  
    1999  
    • Addi.ve  EuroSCORE  
    2003  
    • Logis.c  EuroSCORE  
    2008  
    • STS  Models  
    2012  
    • EuroSCORE  II  
    Future  
    • Where  next?  
    Procedure  specific  
    Mul.ple  outcomes  
    Dominant  
    European  model  
    for  ~10  years  

    View Slide

  3. What’s  wrong  with  the  status  quo?  
    0.02 0.04 0.06 0.08
    Mortality (proportion)
    Trend
    2002 2004 2006 2008 2010
    0.4 0.5 0.6 0.7
    Time (annual quarter)
    O:E ratio
    O:E ratio
    LOESS
    0.02 0.04 0.06 0.08 0.10
    Mortality (proportion)
    Observed
    Expected
    Actual
    Overall average
    Trend
    4 0.5 0.6 0.7
    O:E ratio
    O:E ratio
    LOESS
    0.02 0.04 0.06 0.08 0.
    Mortality (proportion)
    Observed
    Expected
    Actual
    Overall average
    Trend
    2002 2004 2006 2008 2010
    0.4 0.5 0.6 0.7
    Time (annual quarter)
    O:E ratio
    O:E ratio
    LOESS
    In  April  2010,  predicted  mortality  was  2.7  x  observed  mortality  

    View Slide

  4. Consequences  
    Logistic EuroSCORE Recalibrated EuroSCO
    0%
    5%
    10%
    15%
    0 200 400 600 800 0 200 400
    Number of procedures
    Mortality rate
    Number  of  procedures  
    MisrepresentaGon  

    View Slide

  5. Op.ons  a  
    Approach   DescripGon  
    Do  nothing  
    Develop  a  model  (e.g.  on  1-­‐years  data)  and  leave  to  
    run  forever  
    Periodically  refit  model   Every,  e.g.  1-­‐year,  independently  refit  the  model  
    Rolling  window  
    Fit  model  to  a  fixed  window  (e.g.  2-­‐years)  of  data  and  
    then  rolling  the  window  incrementally  (e.g.  every  1-­‐
    year)  
    Dynamic  logisGc  regression  
    Exploit  dynamic  sta.s.cal  models  that  can  update  in  
    ‘real  .me’  (1-­‐month)  online  
    a  not  an  exhaus.ve  list  

    View Slide

  6. ‘Nuts  &  bolts’  of  dynamic  regression  
    •  Described  by  
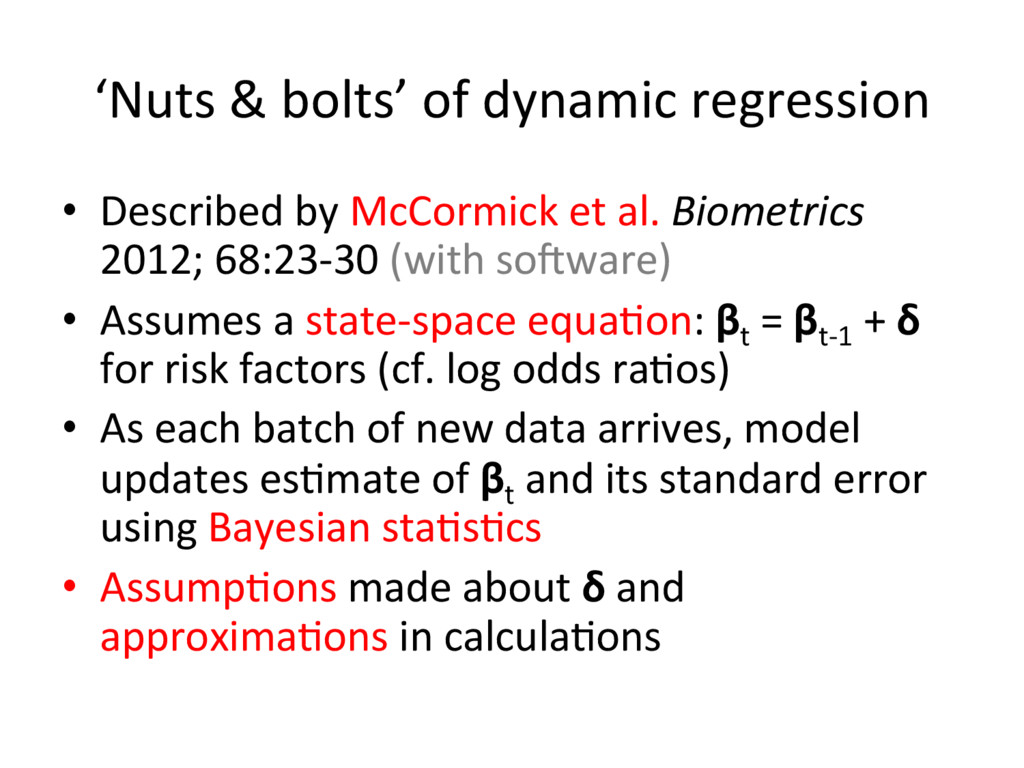
McCormick  et  al.  Biometrics  
    2012;  68:23-­‐30  (with  sogware)  
    •  Assumes  a  state-­‐space  equa.on:  βt
     =  βt-­‐1
     +  δ  
    for  risk  factors  (cf.  log  odds  ra.os)  
    •  As  each  batch  of  new  data  arrives,  model  
    updates  es.mate  of  βt
     and  its  standard  error  
    using  Bayesian  sta.s.cs  
    •  Assump.ons  made  about  δ  and  
    approxima.ons  in  calcula.ons  
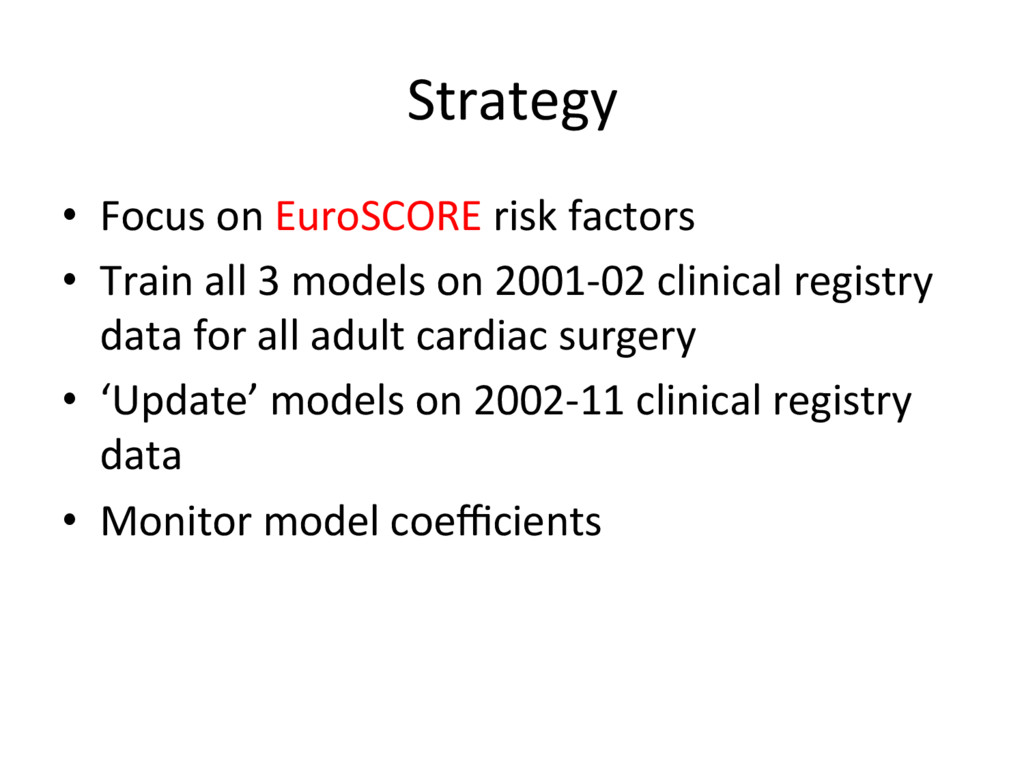
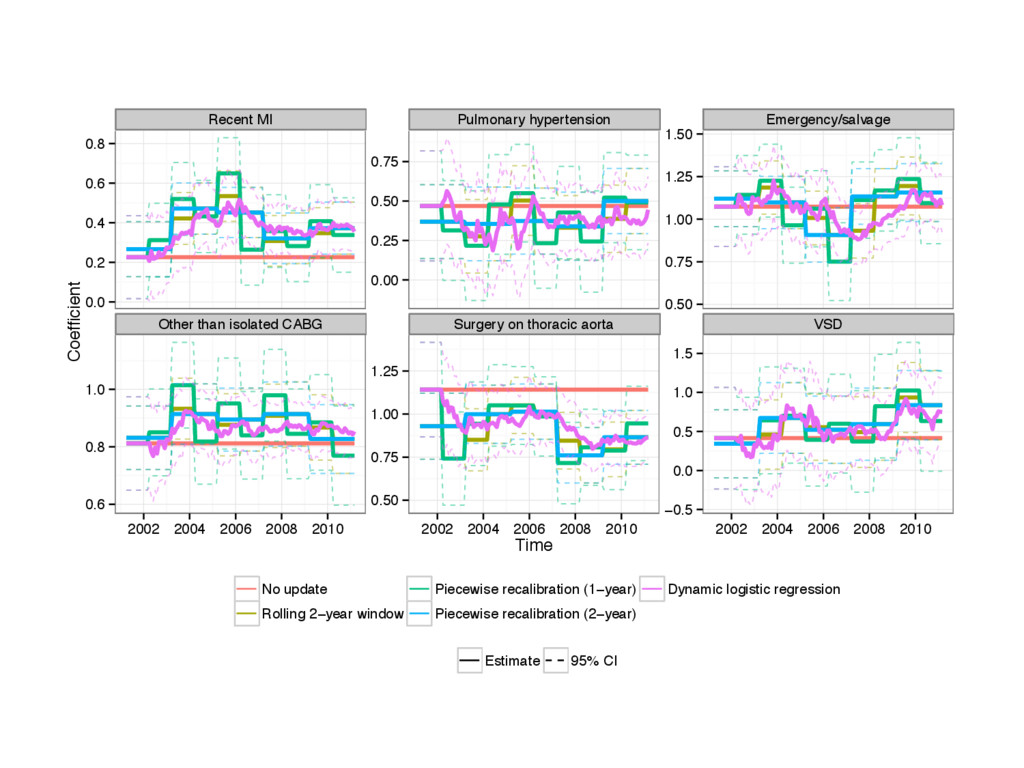
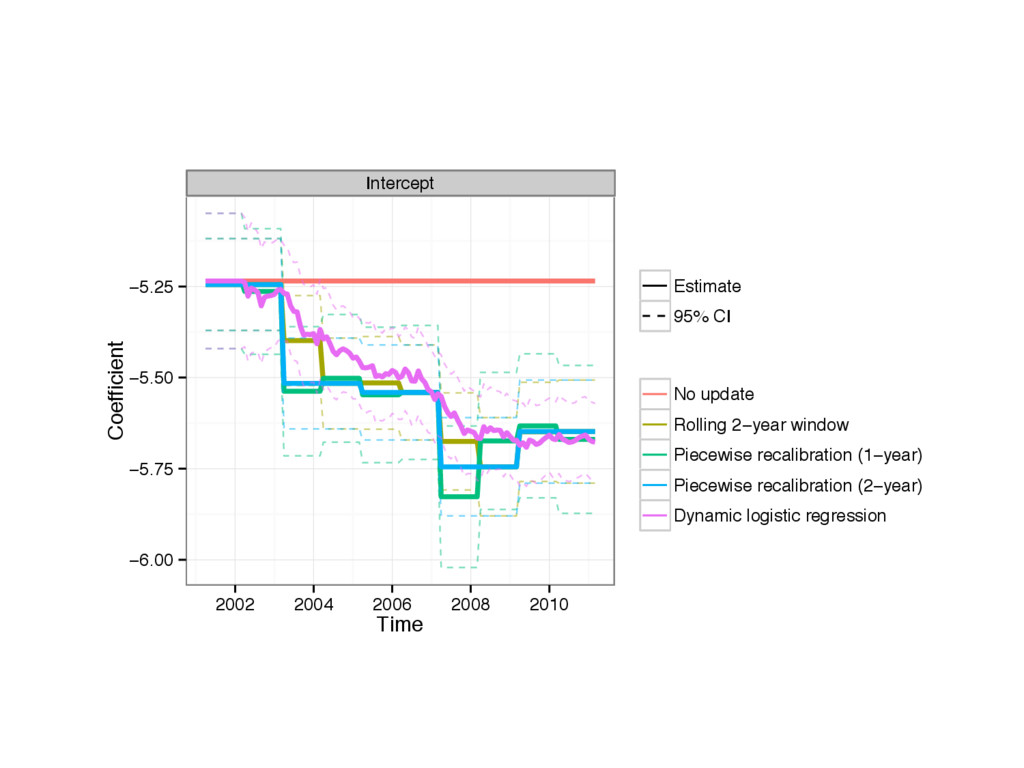
    View Slide

  7. Strategy  
    •  Focus  on  EuroSCORE  risk  factors  
    •  Train  all  3  models  on  2001-­‐02  clinical  registry  
    data  for  all  adult  cardiac  surgery  
    •  ‘Update’  models  on  2002-­‐11  clinical  registry  
    data  
    •  Monitor  model  coefficients  

    View Slide

  8. Results  

    View Slide

  9. 2002 2003 2004 2005 2006 2007 2008 2009 2010 2011
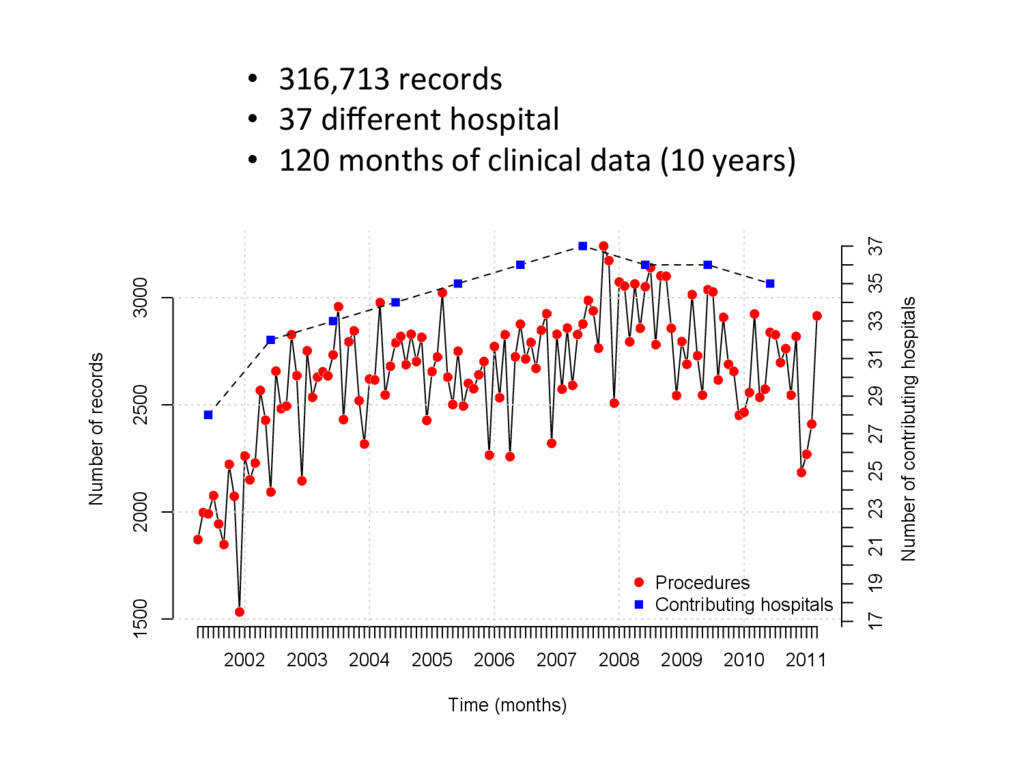
    1500 2000 2500 3000
    Time (months)
    Number of records
    17 19 21 23 25 27 29 31 33 35 37
    Number of contributing hospitals
    Procedures
    Contributing hospitals
    •  316,713  records  
    •  37  different  hospital  
    •  120  months  of  clinical  data  (10  years)  

    View Slide

  10. Age (adjusted) Female Pulmonary disease
    Extracardiac arteriopathy Neurological dysfunction Previous cardiac surgery
    0.05
    0.06
    0.07
    0.2
    0.4
    0.6
    0.0
    0.2
    0.4
    0.2
    0.4
    0.6
    0.8
    −0.5
    0.0
    0.5
    1.0
    0.7
    0.9
    1.1
    1.3
    2002 2004 2006 2008 2010 2002 2004 2006 2008 2010 2002 2004 2006 2008 2010
    Time
    Coefficient
    No update
    Rolling 2−year window
    Piecewise recalibration (1−year)
    Piecewise recalibration (2−year)
    Dynamic logistic regression
    Estimate 95% CI

    View Slide

  11. Creatinine > 2.2mg/dl Active endocarditis Critical pre−op
    Unstable angina LV function: moderate LV function: poor
    0.50
    0.75
    1.00
    1.25
    1.50
    0.0
    0.4
    0.8
    1.2
    0.3
    0.6
    0.9
    0.0
    0.4
    0.8
    0.2
    0.4
    0.6
    0.75
    1.00
    1.25
    1.50
    2002 2004 2006 2008 2010 2002 2004 2006 2008 2010 2002 2004 2006 2008 2010
    Time
    Coefficient
    No update
    Rolling 2−year window
    Piecewise recalibration (1−year)
    Piecewise recalibration (2−year)
    Dynamic logistic regression
    Estimate 95% CI

    View Slide

  12. Recent MI Pulmonary hypertension Emergency/salvage
    Other than isolated CABG Surgery on thoracic aorta VSD
    0.0
    0.2
    0.4
    0.6
    0.8
    0.00
    0.25
    0.50
    0.75
    0.50
    0.75
    1.00
    1.25
    1.50
    0.6
    0.8
    1.0
    0.50
    0.75
    1.00
    1.25
    −0.5
    0.0
    0.5
    1.0
    1.5
    2002 2004 2006 2008 2010 2002 2004 2006 2008 2010 2002 2004 2006 2008 2010
    Time
    Coefficient
    No update
    Rolling 2−year window
    Piecewise recalibration (1−year)
    Piecewise recalibration (2−year)
    Dynamic logistic regression
    Estimate 95% CI

    View Slide

  13. Intercept
    −6.00
    −5.75
    −5.50
    −5.25
    2002 2004 2006 2008 2010
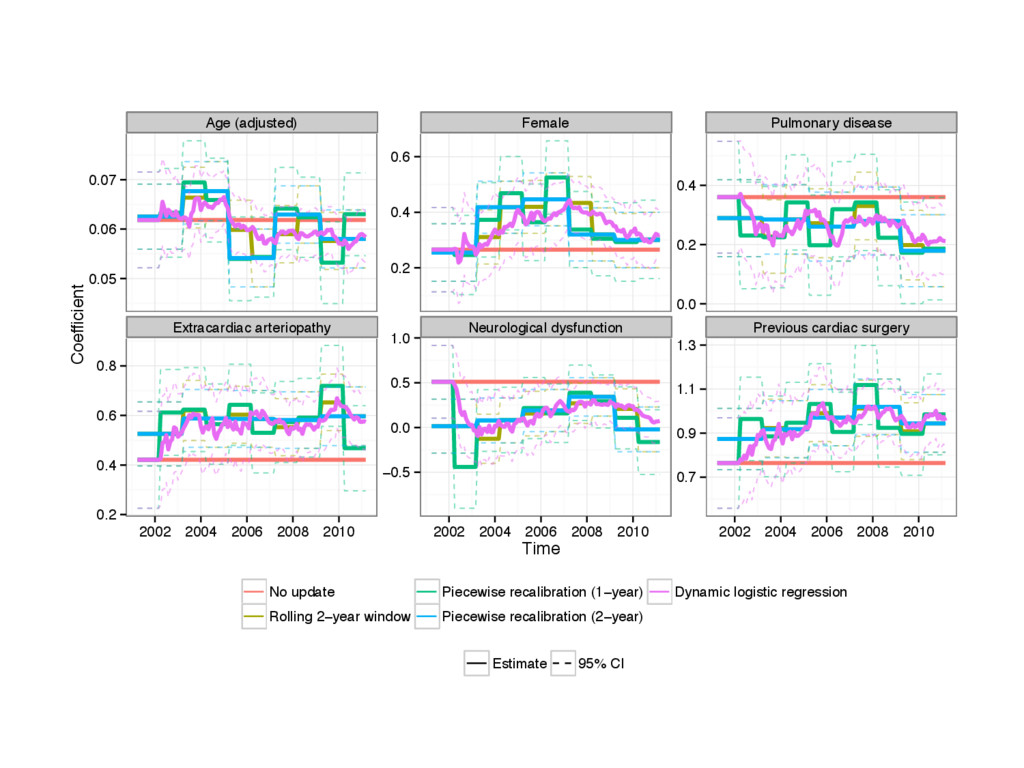
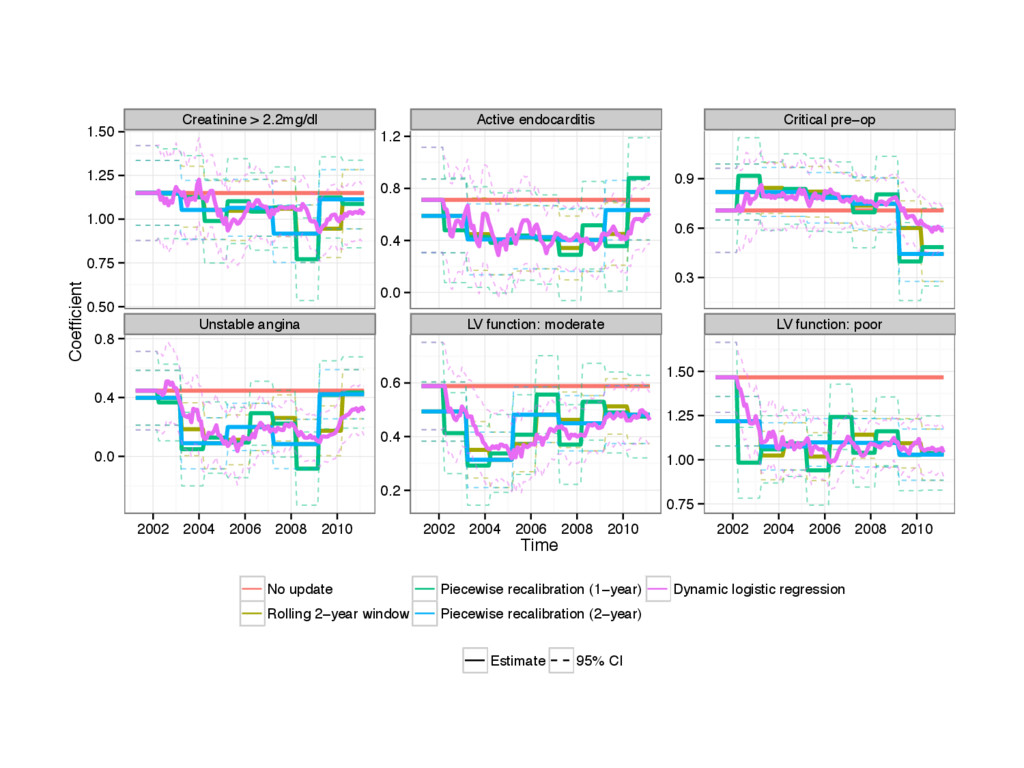
    Time
    Coefficient
    Estimate
    95% CI
    No update
    Rolling 2−year window
    Piecewise recalibration (1−year)
    Piecewise recalibration (2−year)
    Dynamic logistic regression

    View Slide

  14. Conclusions  
    •  Doing  nothing  is  not  an  op.on  
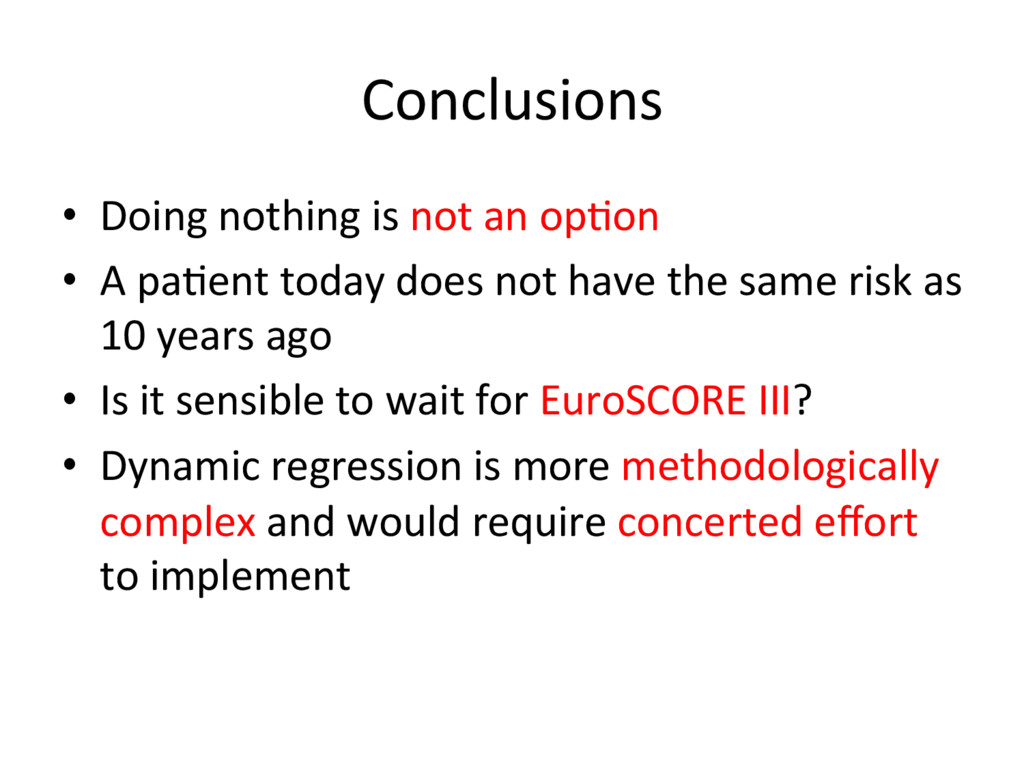
    •  A  pa.ent  today  does  not  have  the  same  risk  as  
    10  years  ago  
    •  Is  it  sensible  to  wait  for  EuroSCORE  III?  
    •  Dynamic  regression  is  more  methodologically  
    complex  and  would  require  concerted  effort  
    to  implement  

    View Slide