AT I O N I N P R O D U C T P R O D U C T C A M P B O S T O N 2 0 1 6 C T O D D L O M B A R D O C H I E F D E S I G N S T R A T E G I S T - F R E S H T I L L E D S O I L @ I A M C T O D D
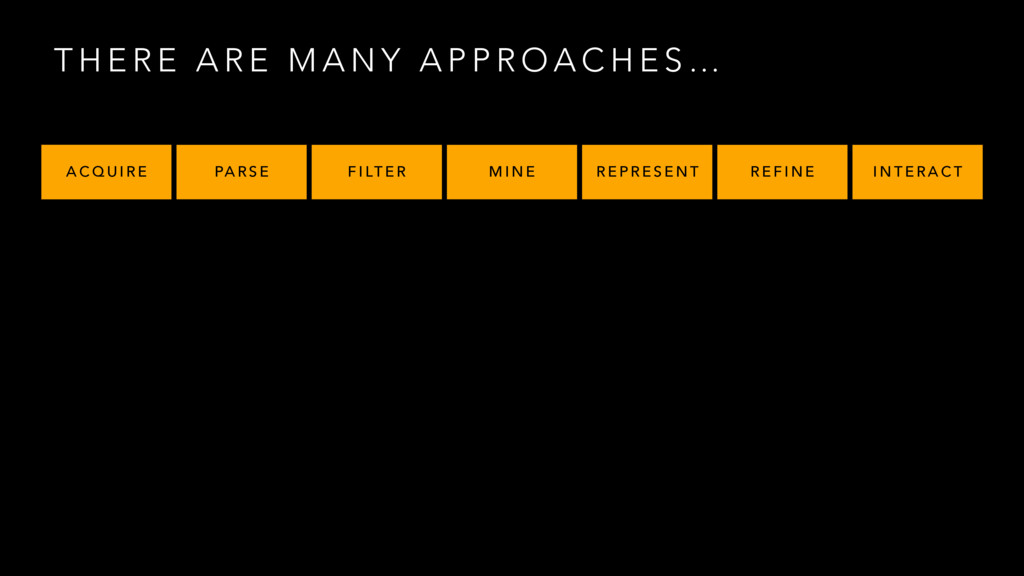
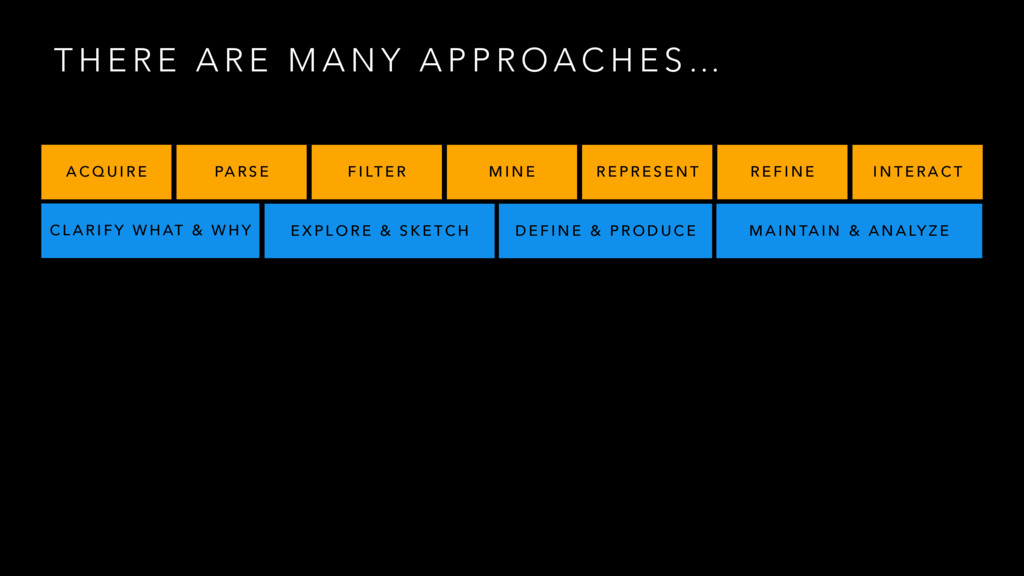
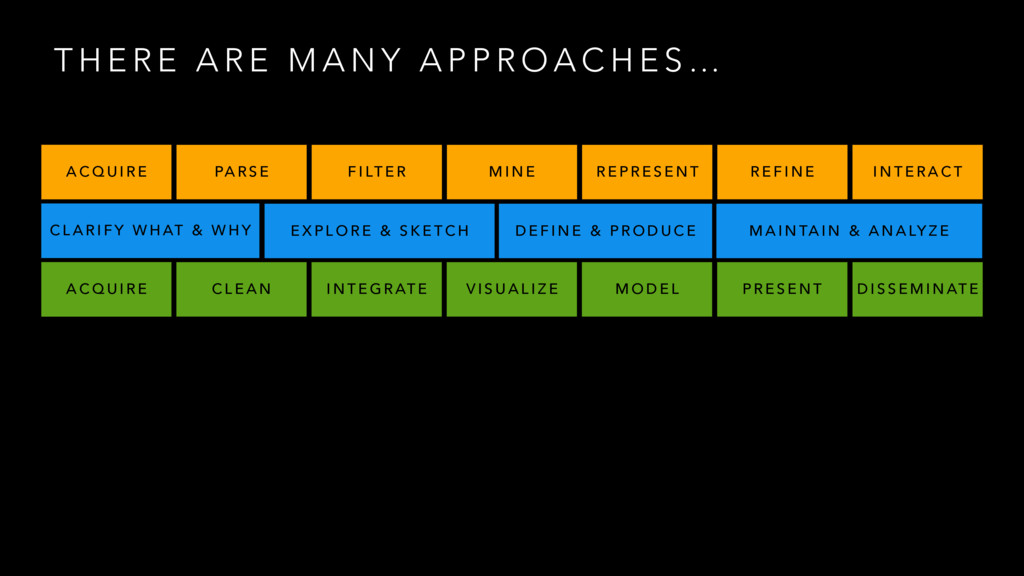
N Y A P P R O A C H E S … A C Q U I R E PA R S E F I LT E R M I N E R E P R E S E N T R E F I N E I N T E R A C T C L A R I F Y W H AT & W H Y E X P L O R E & S K E T C H D E F I N E & P R O D U C E M A I N TA I N & A N A LY Z E
N Y A P P R O A C H E S … A C Q U I R E PA R S E F I LT E R M I N E R E P R E S E N T R E F I N E I N T E R A C T C L A R I F Y W H AT & W H Y E X P L O R E & S K E T C H D E F I N E & P R O D U C E M A I N TA I N & A N A LY Z E A C Q U I R E C L E A N I N T E G R AT E V I S U A L I Z E M O D E L P R E S E N T D I S S E M I N AT E
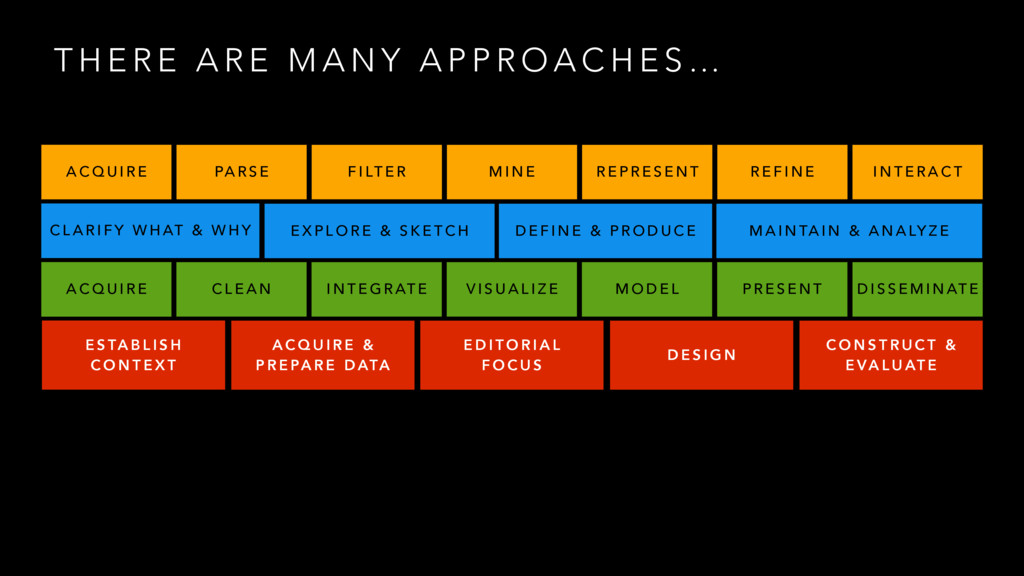
N Y A P P R O A C H E S … A C Q U I R E PA R S E F I LT E R M I N E R E P R E S E N T R E F I N E I N T E R A C T C L A R I F Y W H AT & W H Y E X P L O R E & S K E T C H D E F I N E & P R O D U C E M A I N TA I N & A N A LY Z E A C Q U I R E C L E A N I N T E G R AT E V I S U A L I Z E M O D E L P R E S E N T D I S S E M I N AT E E S TA B L I S H C O N T E X T A C Q U I R E & P R E PA R E D ATA E D I T O R I A L F O C U S D E S I G N C O N S T R U C T & E VA L U AT E
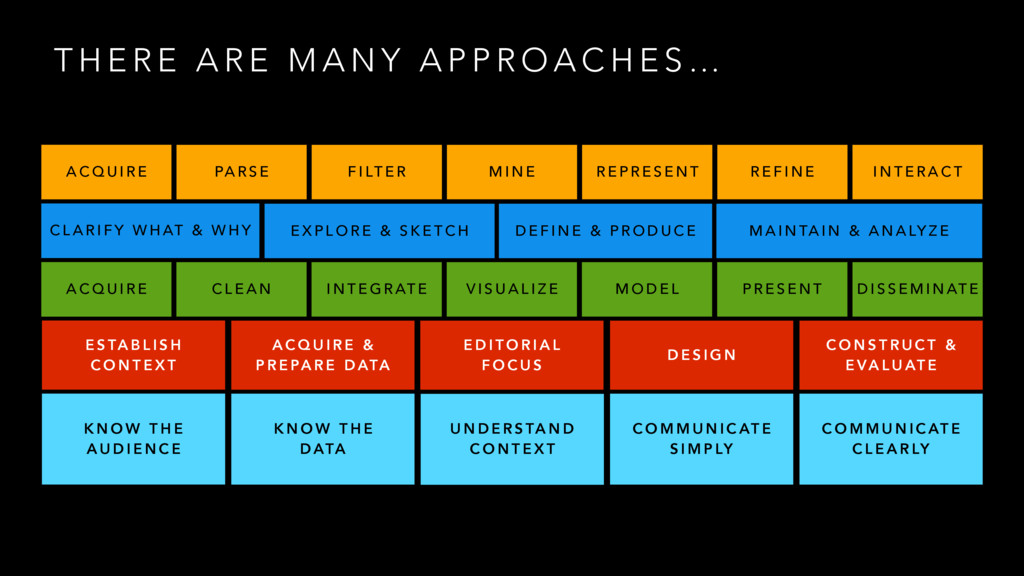
N Y A P P R O A C H E S … A C Q U I R E PA R S E F I LT E R M I N E R E P R E S E N T R E F I N E I N T E R A C T C L A R I F Y W H AT & W H Y E X P L O R E & S K E T C H D E F I N E & P R O D U C E M A I N TA I N & A N A LY Z E A C Q U I R E C L E A N I N T E G R AT E V I S U A L I Z E M O D E L P R E S E N T D I S S E M I N AT E E S TA B L I S H C O N T E X T A C Q U I R E & P R E PA R E D ATA E D I T O R I A L F O C U S D E S I G N C O N S T R U C T & E VA L U AT E K N O W T H E A U D I E N C E K N O W T H E D ATA U N D E R S TA N D C O N T E X T C O M M U N I C AT E S I M P LY C O M M U N I C AT E C L E A R LY
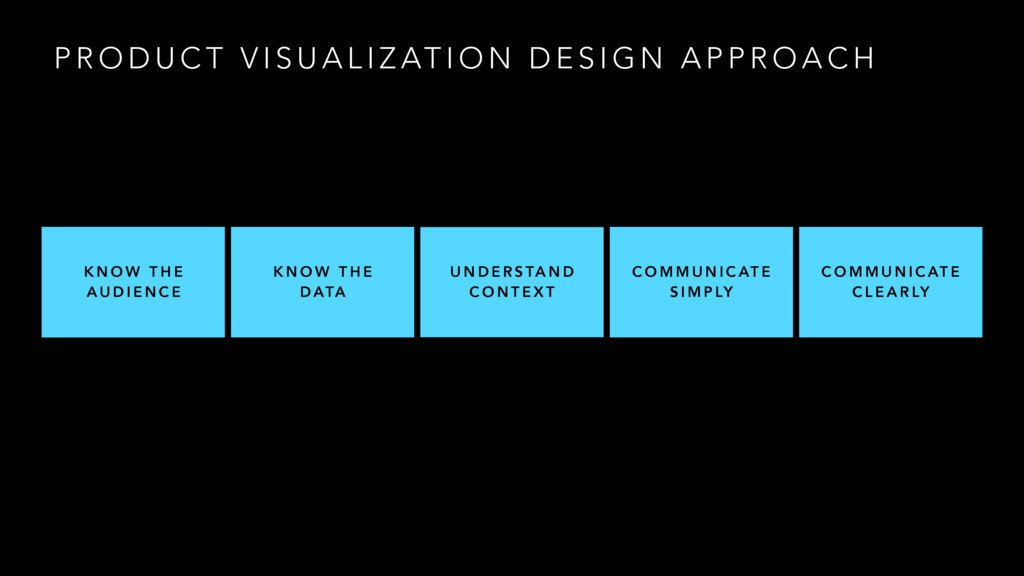
I E N C E K N O W T H E D ATA U N D E R S TA N D C O N T E X T C O M M U N I C AT E S I M P LY C O M M U N I C AT E C L E A R LY P R O D U C T V I S U A L I Z AT I O N D E S I G N A P P R O A C H
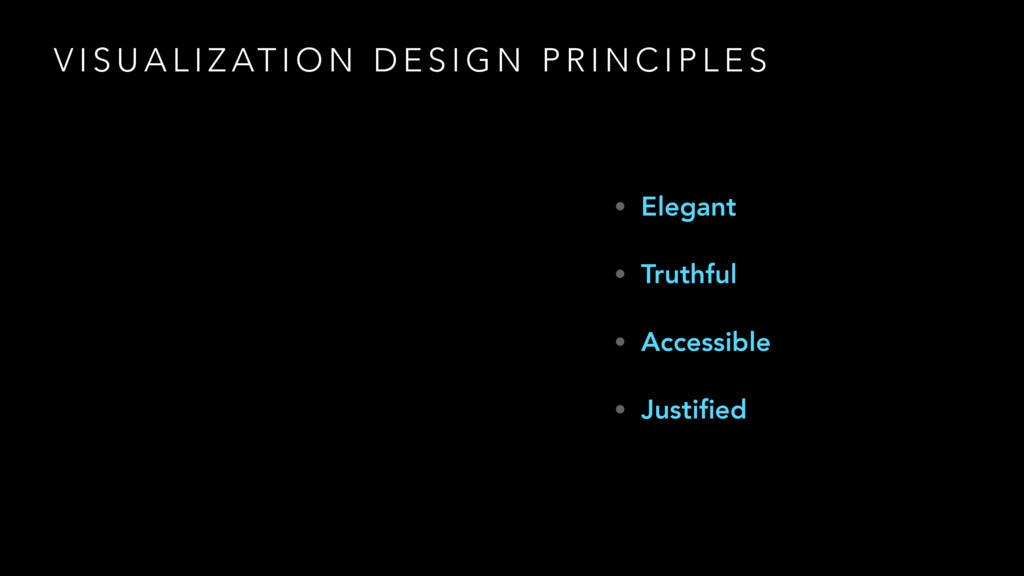
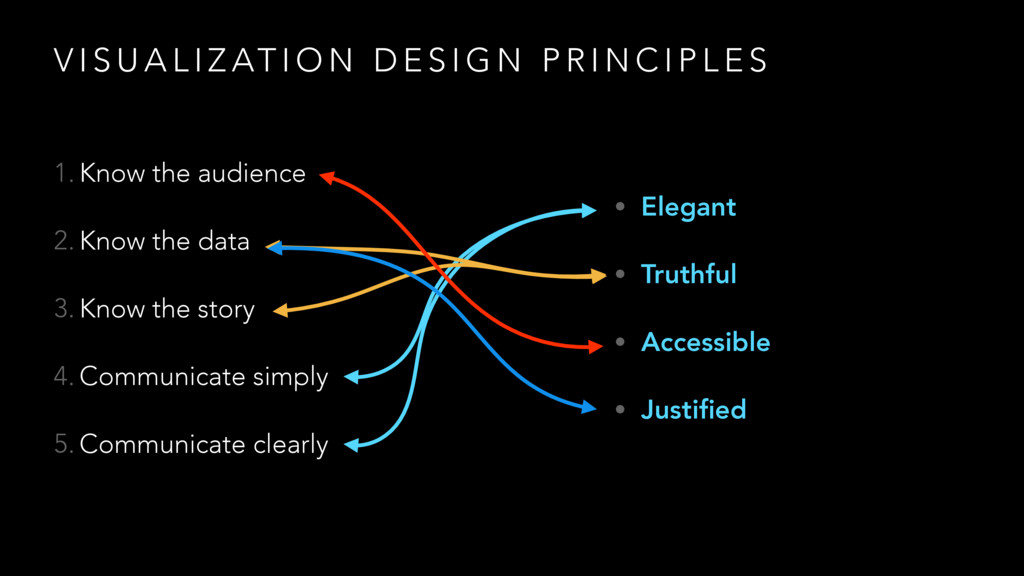
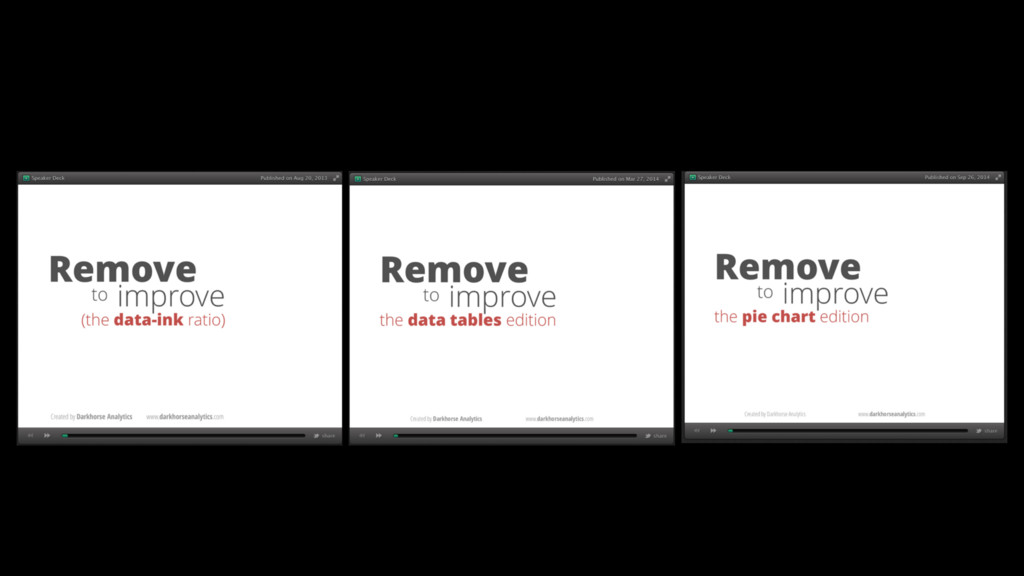
the story 4. Communicate simply 5. Communicate clearly V I S U A L I Z AT I O N D E S I G N P R I N C I P L E S • Elegant • Truthful • Accessible • Justified
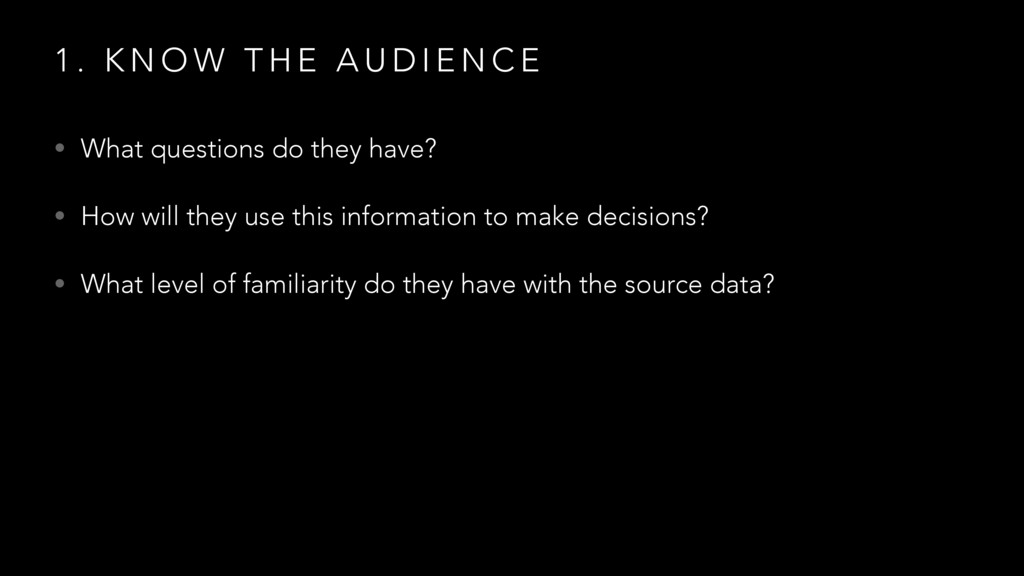
U D I E N C E • What questions do they have? • How will they use this information to make decisions? • What level of familiarity do they have with the source data?
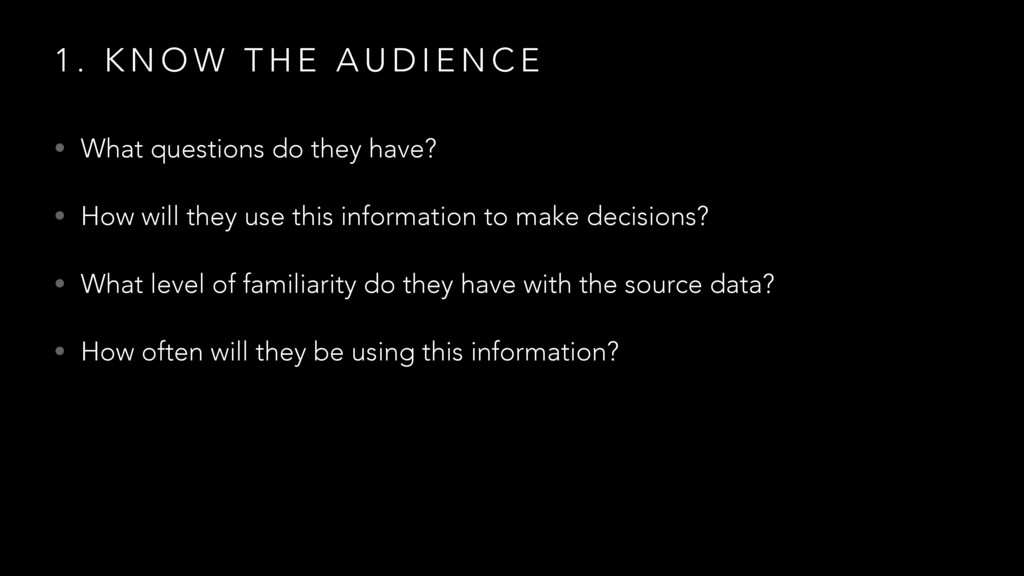
U D I E N C E • What questions do they have? • How will they use this information to make decisions? • What level of familiarity do they have with the source data? • How often will they be using this information?
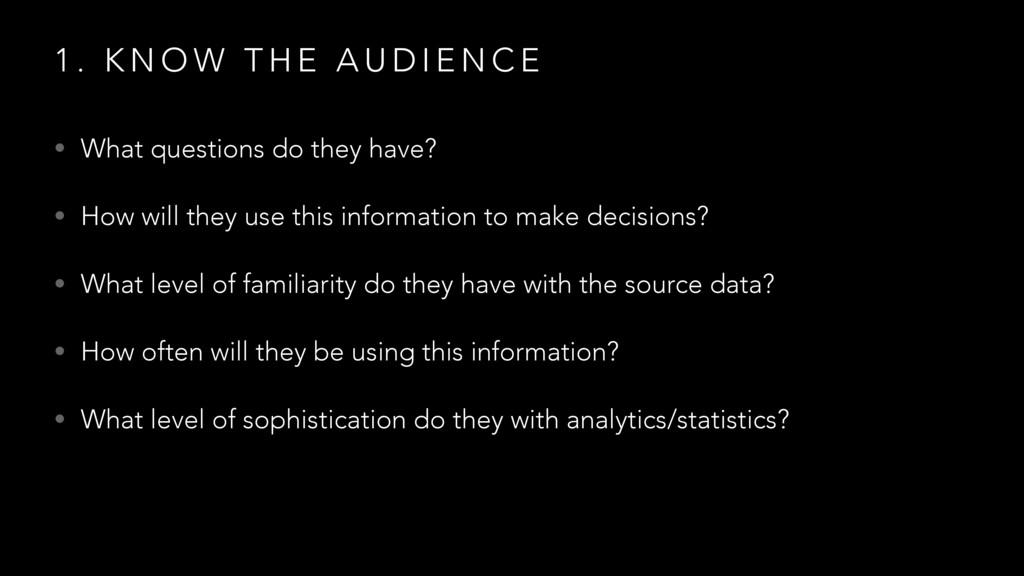
U D I E N C E • What questions do they have? • How will they use this information to make decisions? • What level of familiarity do they have with the source data? • How often will they be using this information? • What level of sophistication do they with analytics/statistics?
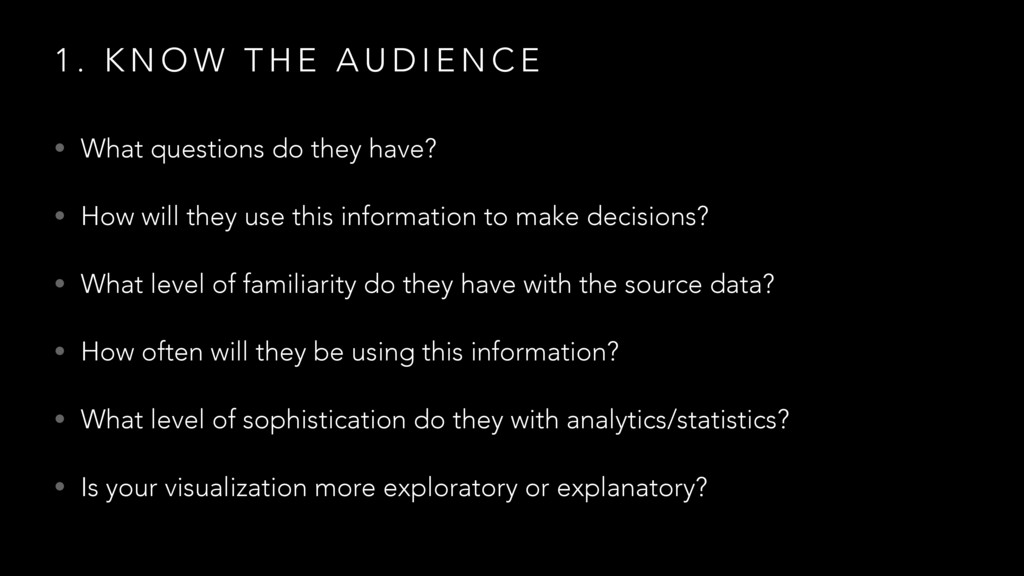
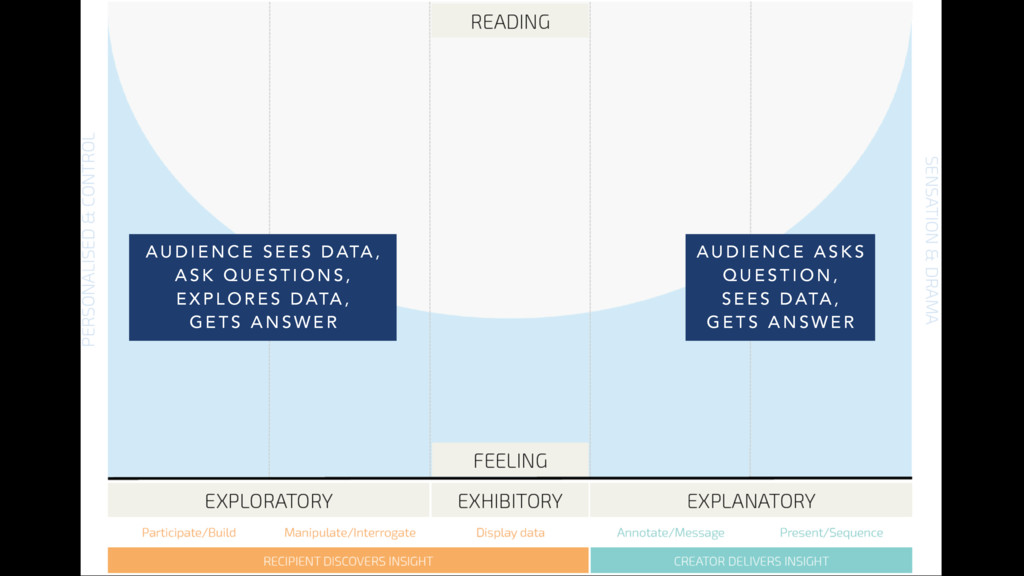
U D I E N C E • What questions do they have? • How will they use this information to make decisions? • What level of familiarity do they have with the source data? • How often will they be using this information? • What level of sophistication do they with analytics/statistics? • Is your visualization more exploratory or explanatory?
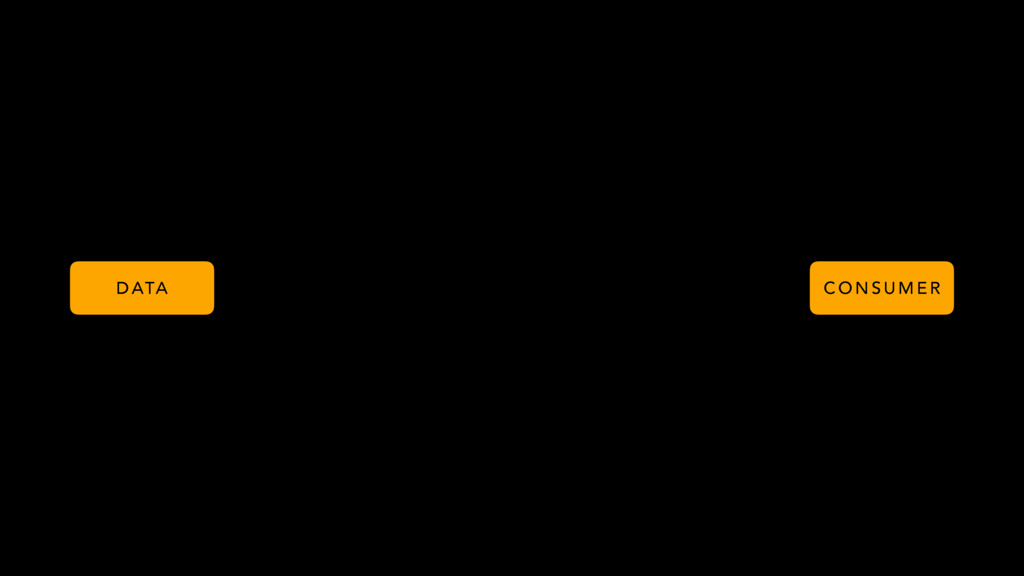
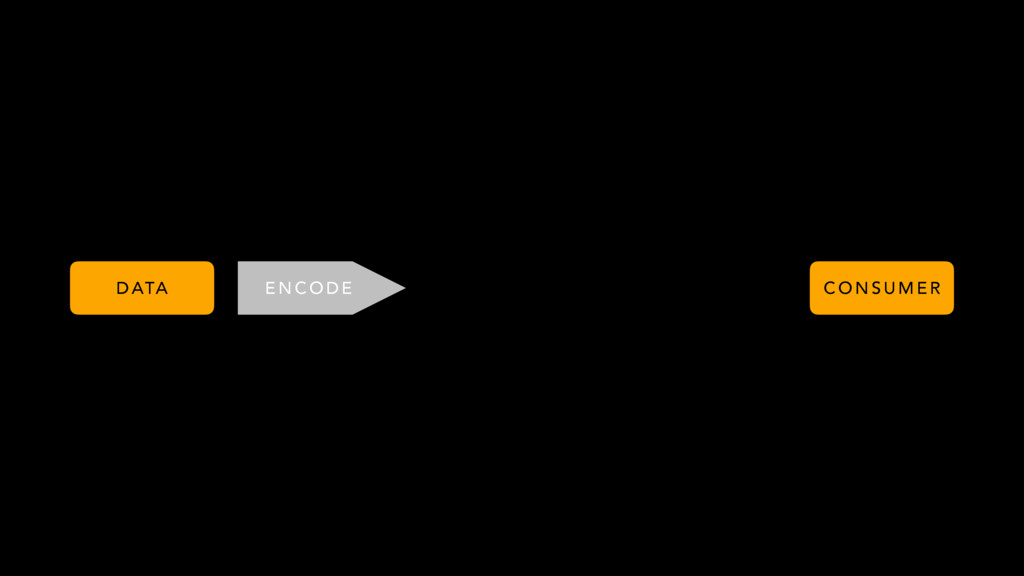
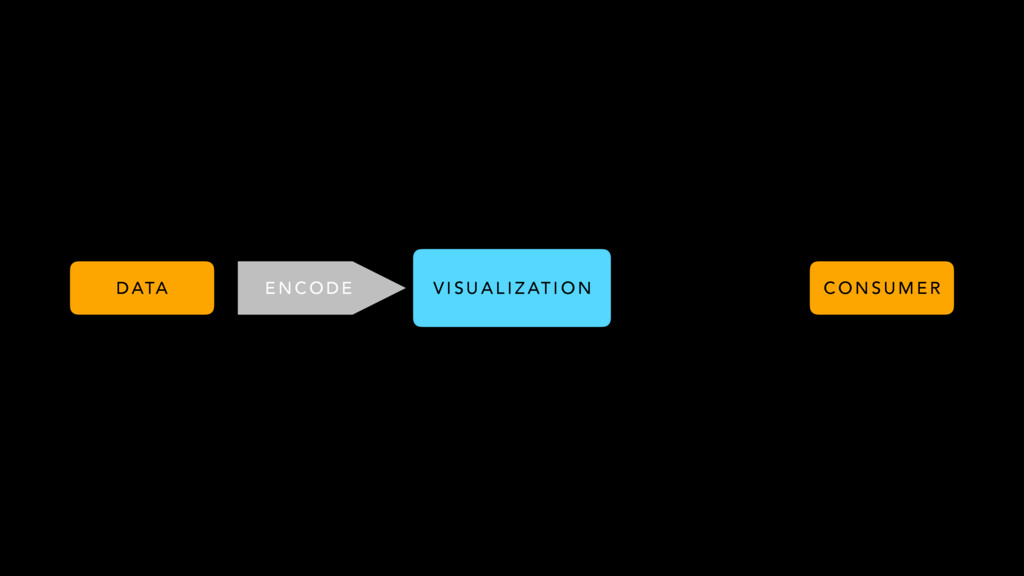
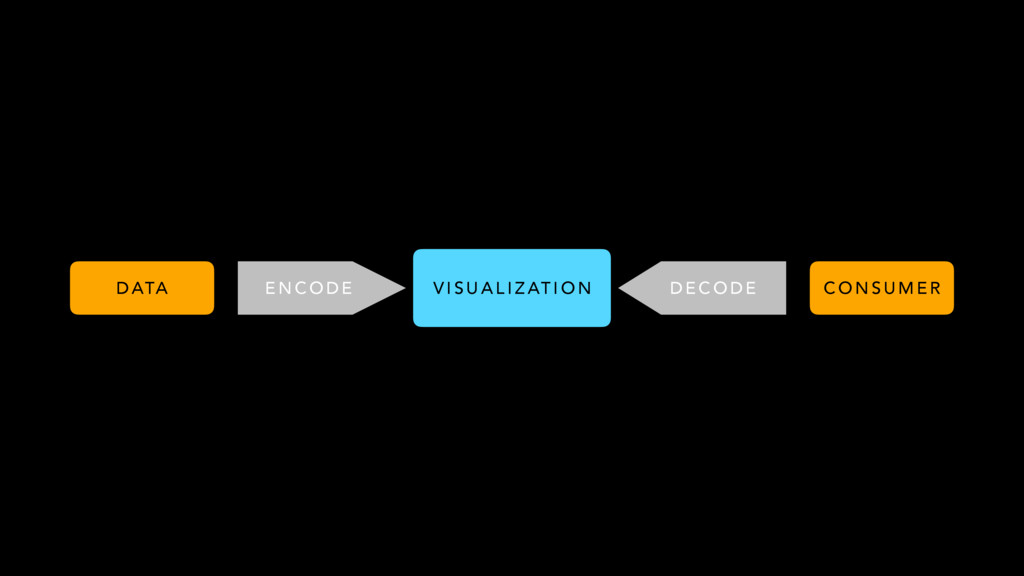
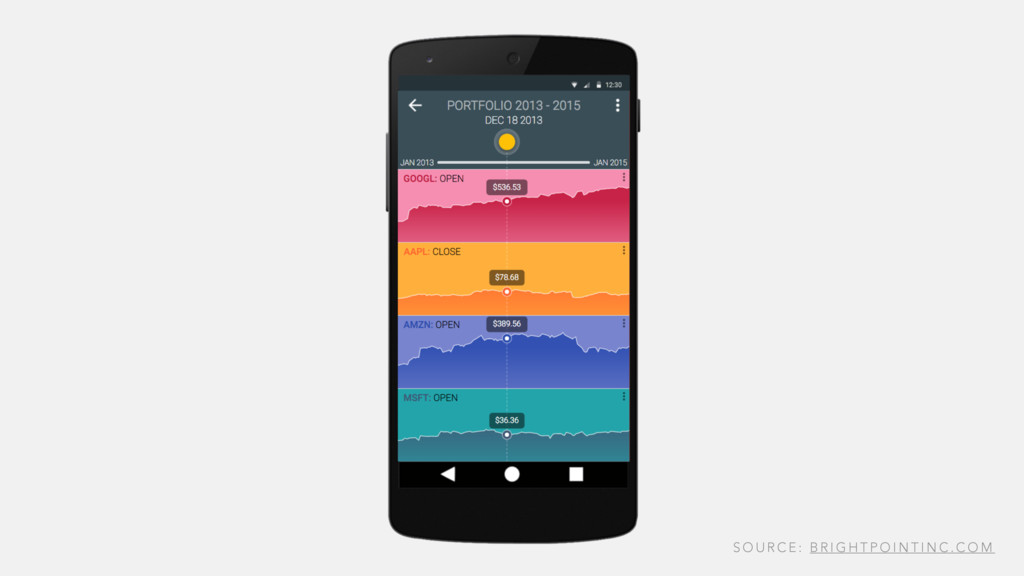
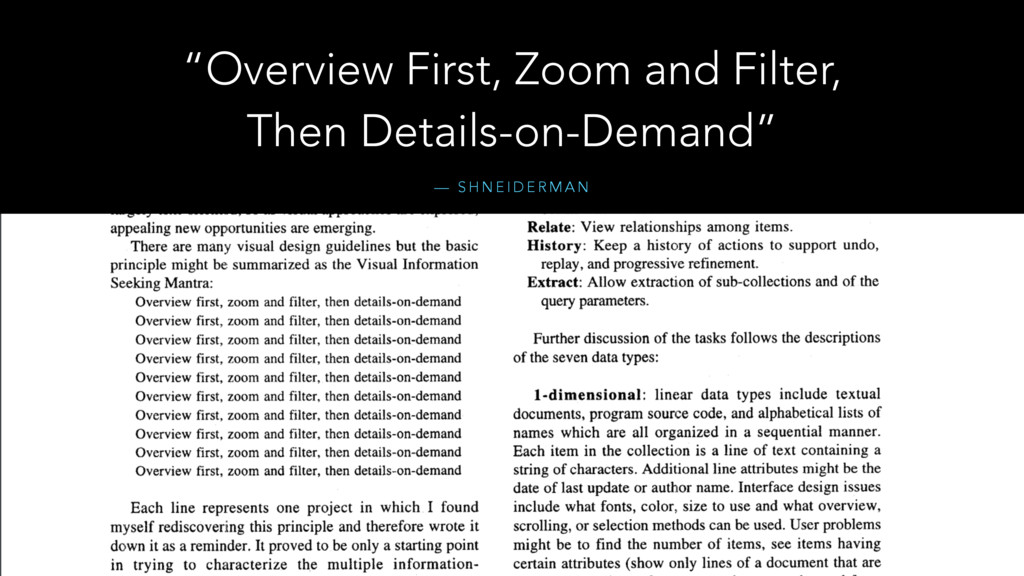
K S Q U E S T I O N , S E E S D ATA , G E T S A N S W E R A U D I E N C E S E E S D ATA , A S K Q U E S T I O N S , E X P L O R E S D ATA , G E T S A N S W E R
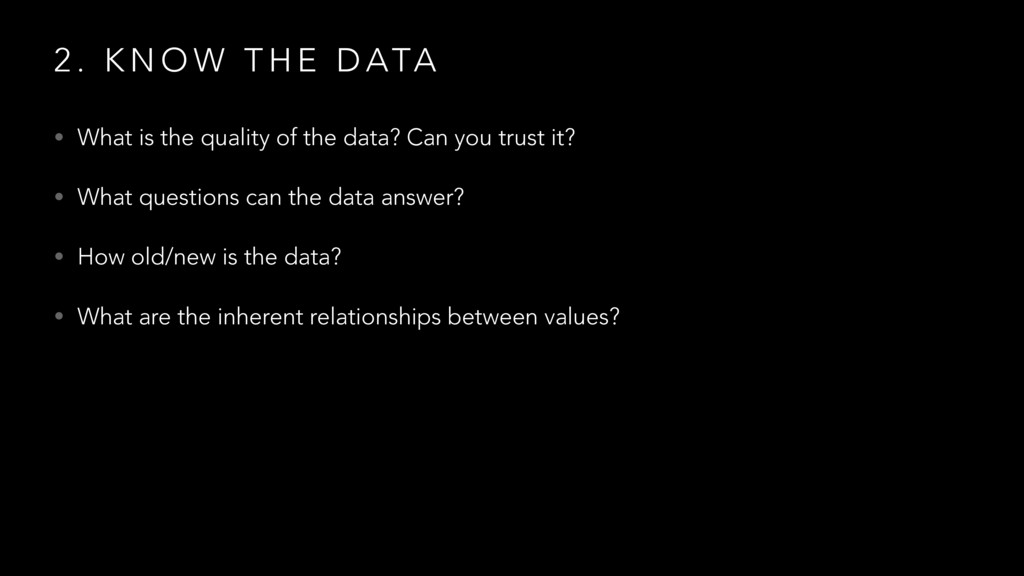
ATA • What is the quality of the data? Can you trust it? • What questions can the data answer? • How old/new is the data? • What are the inherent relationships between values?
ATA • What is the quality of the data? Can you trust it? • What questions can the data answer? • How old/new is the data? • What are the inherent relationships between values? • What other data can we combine with it?
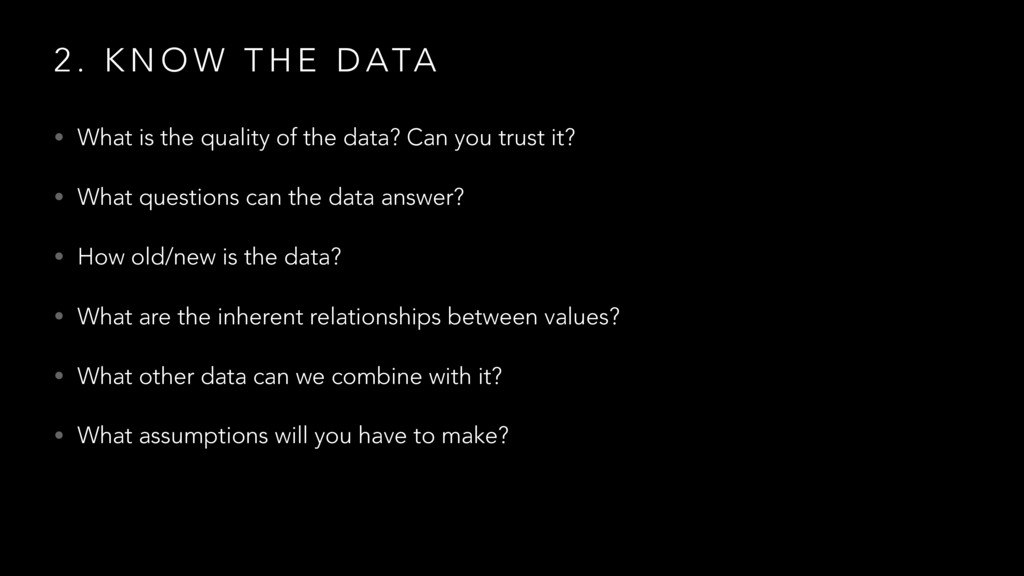
ATA • What is the quality of the data? Can you trust it? • What questions can the data answer? • How old/new is the data? • What are the inherent relationships between values? • What other data can we combine with it? • What assumptions will you have to make?
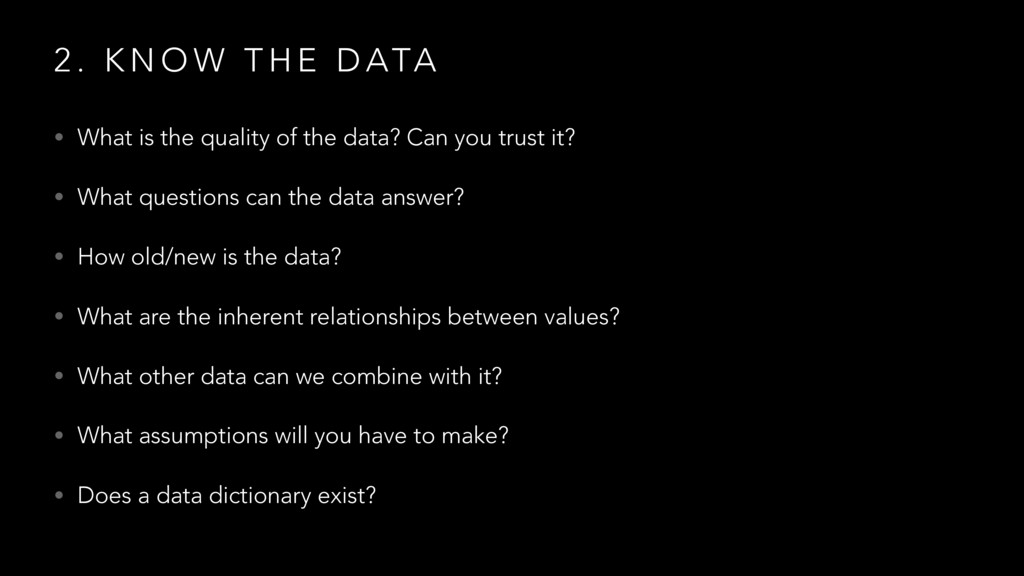
ATA • What is the quality of the data? Can you trust it? • What questions can the data answer? • How old/new is the data? • What are the inherent relationships between values? • What other data can we combine with it? • What assumptions will you have to make? • Does a data dictionary exist?
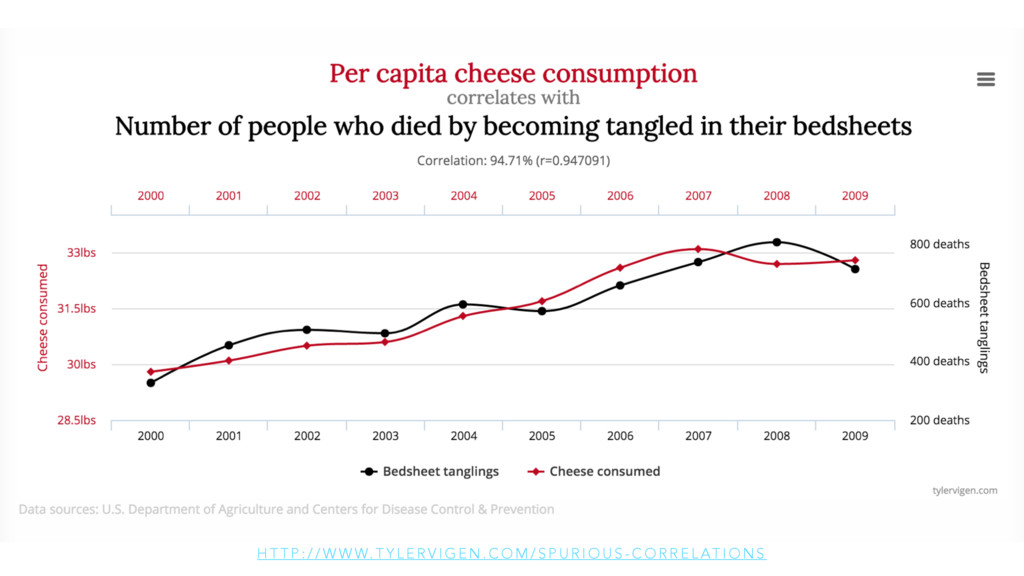
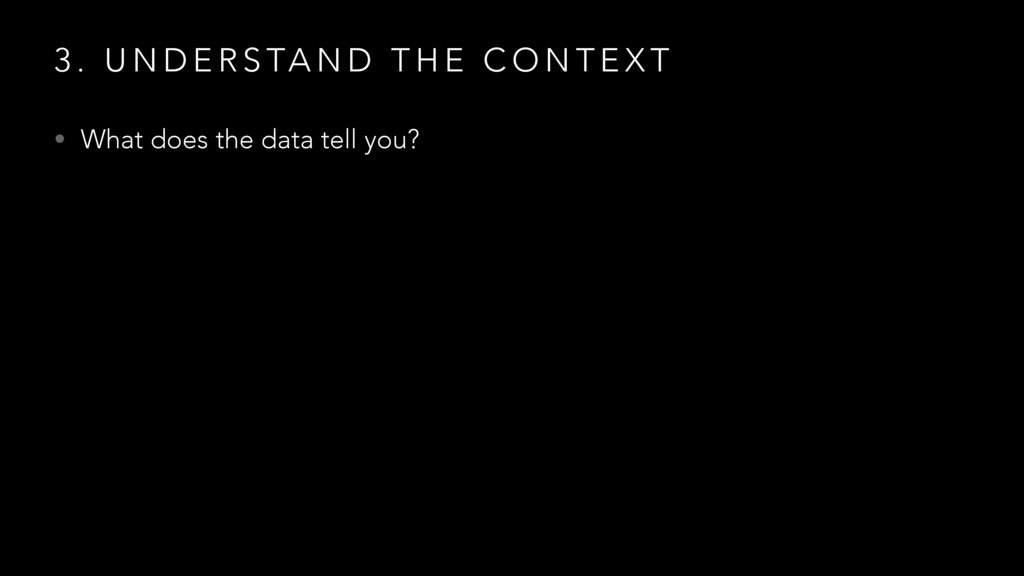
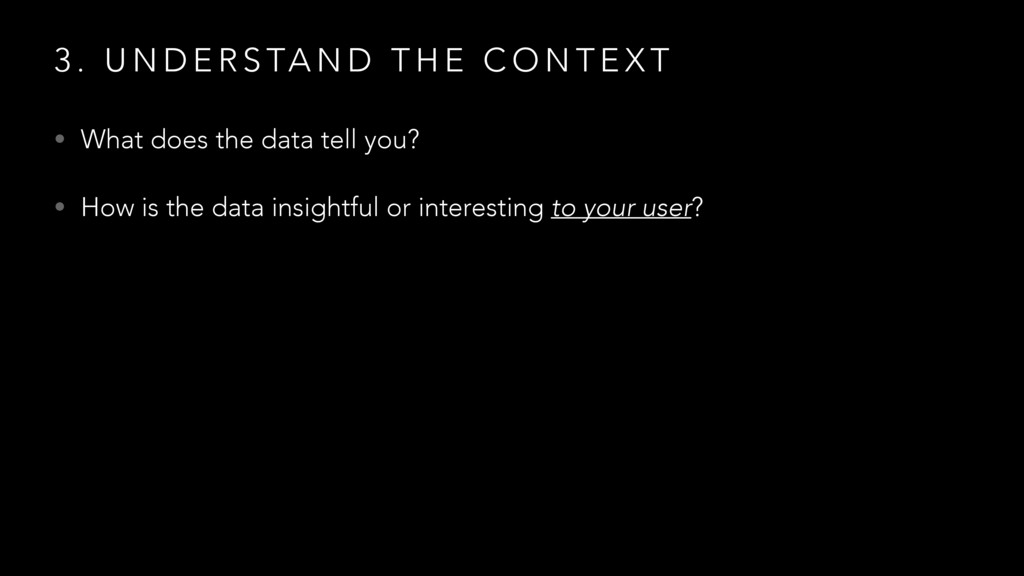
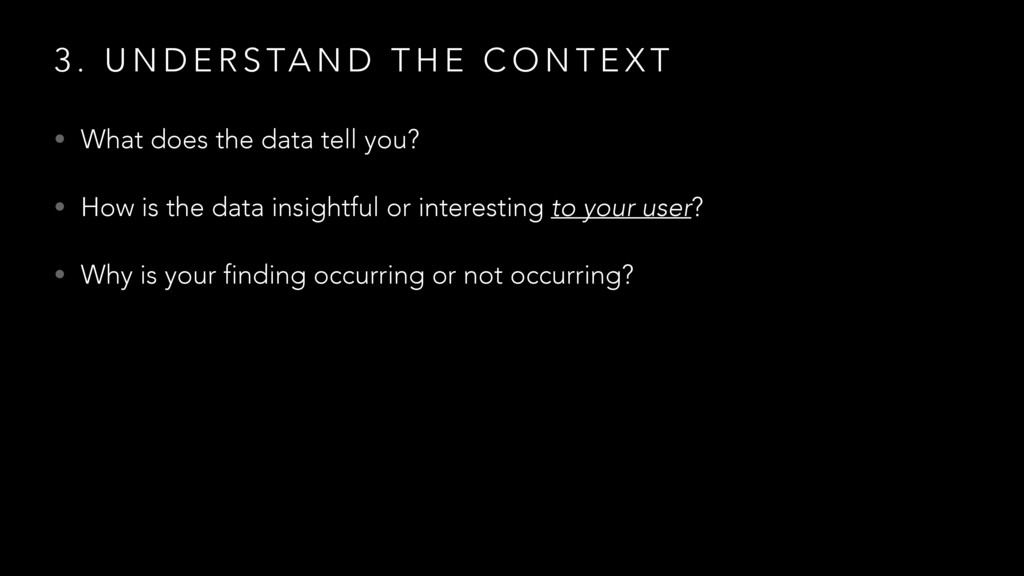
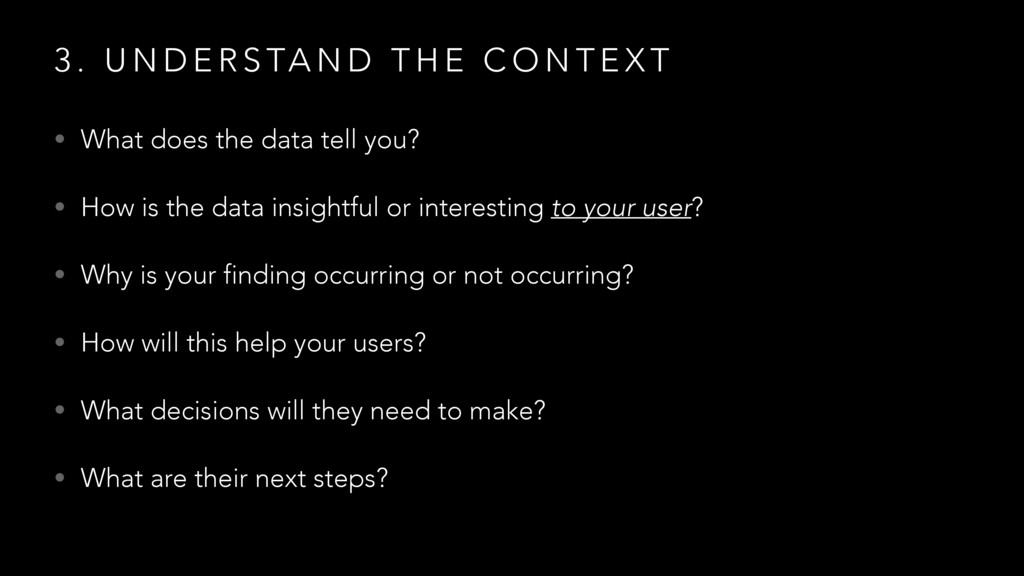
D T H E C O N T E X T • What does the data tell you? • How is the data insightful or interesting to your user? • Why is your finding occurring or not occurring?
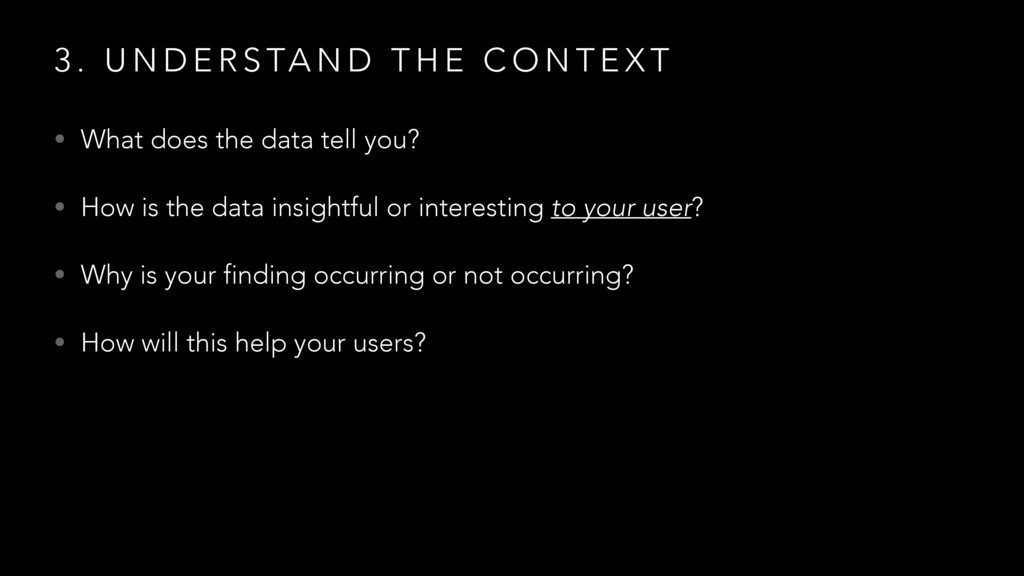
D T H E C O N T E X T • What does the data tell you? • How is the data insightful or interesting to your user? • Why is your finding occurring or not occurring? • How will this help your users?
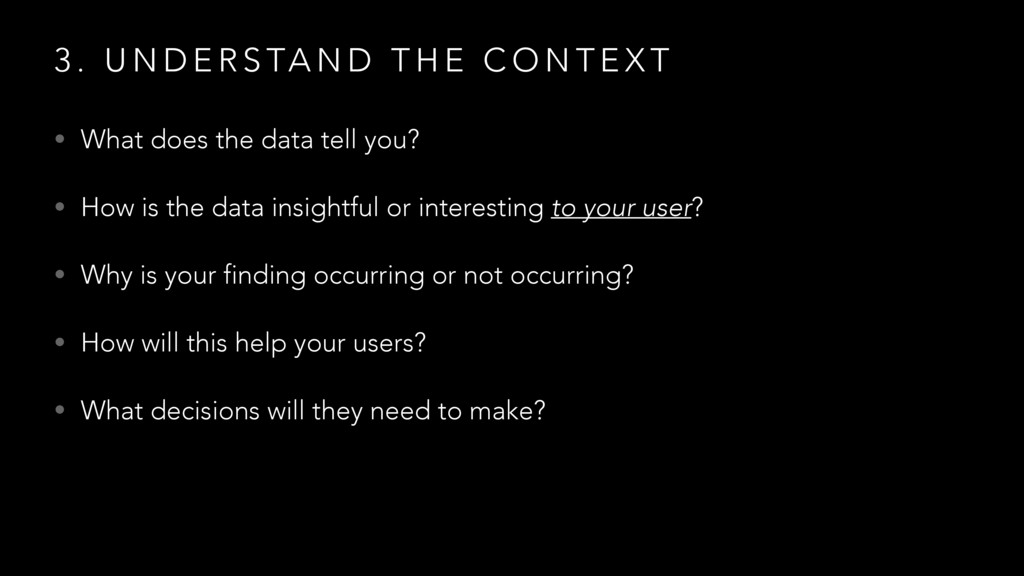
D T H E C O N T E X T • What does the data tell you? • How is the data insightful or interesting to your user? • Why is your finding occurring or not occurring? • How will this help your users? • What decisions will they need to make?
D T H E C O N T E X T • What does the data tell you? • How is the data insightful or interesting to your user? • Why is your finding occurring or not occurring? • How will this help your users? • What decisions will they need to make? • What are their next steps?
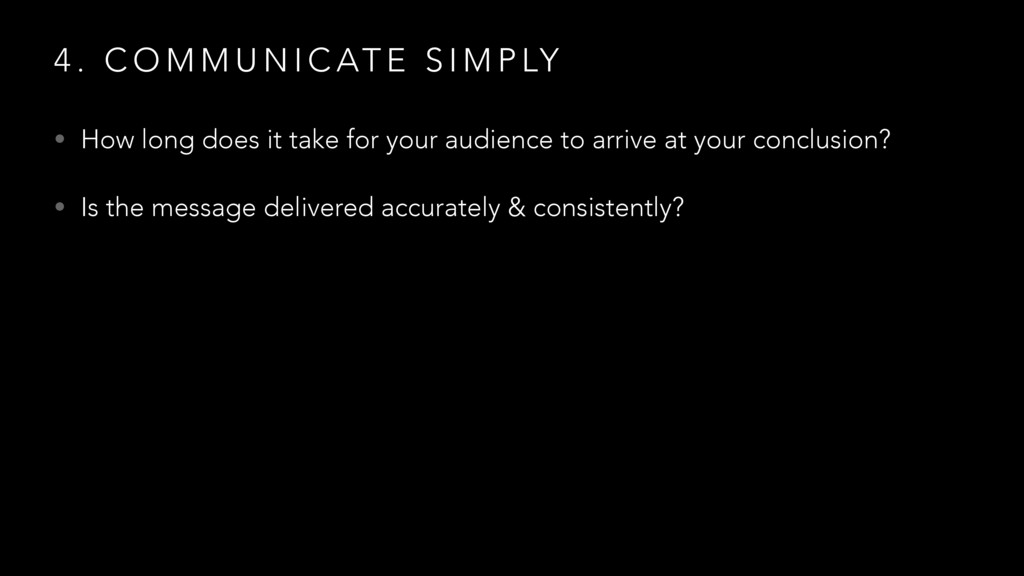
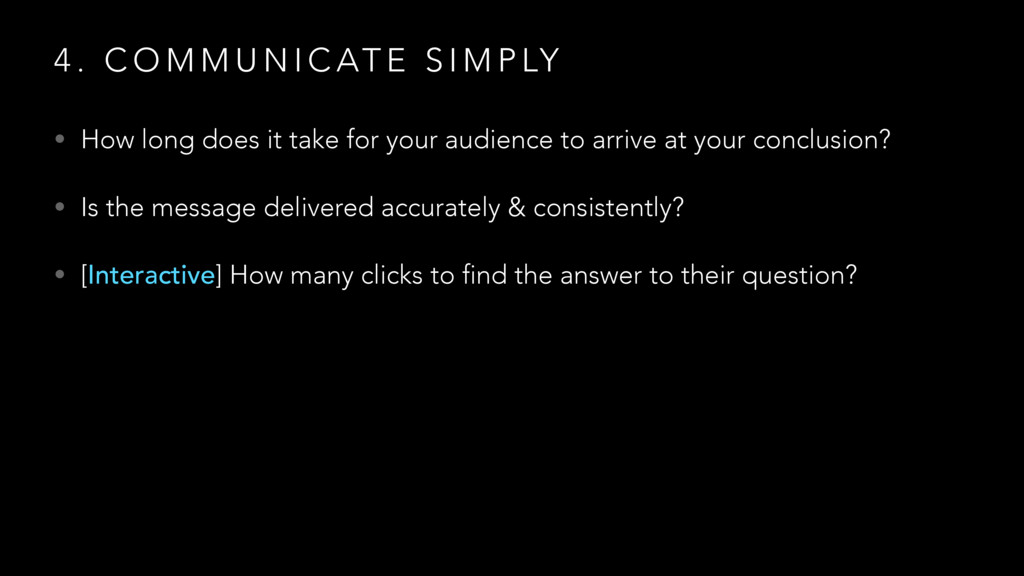
AT E S I M P LY • How long does it take for your audience to arrive at your conclusion? • Is the message delivered accurately & consistently? • [Interactive] How many clicks to find the answer to their question?
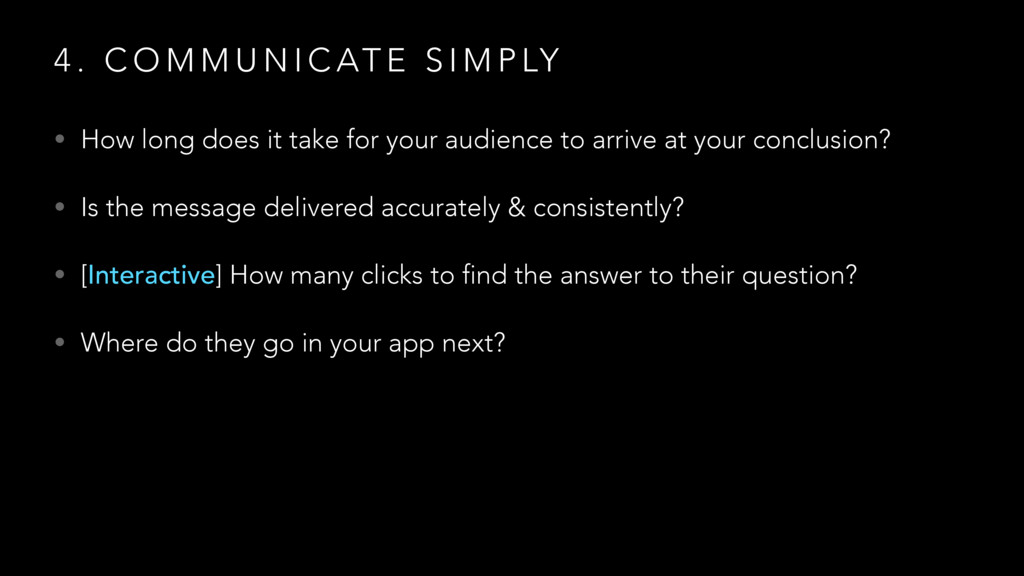
AT E S I M P LY • How long does it take for your audience to arrive at your conclusion? • Is the message delivered accurately & consistently? • [Interactive] How many clicks to find the answer to their question? • Where do they go in your app next?
AT E C L E A R LY • What are the key findings & messages? • What is the right way to visualize the findings? • How do they interpret the data? • What decisions will they make from this visualization?
AT E C L E A R LY • What are the key findings & messages? • What is the right way to visualize the findings? • How do they interpret the data? • What decisions will they make from this visualization? • Is it easy to understand the findings?
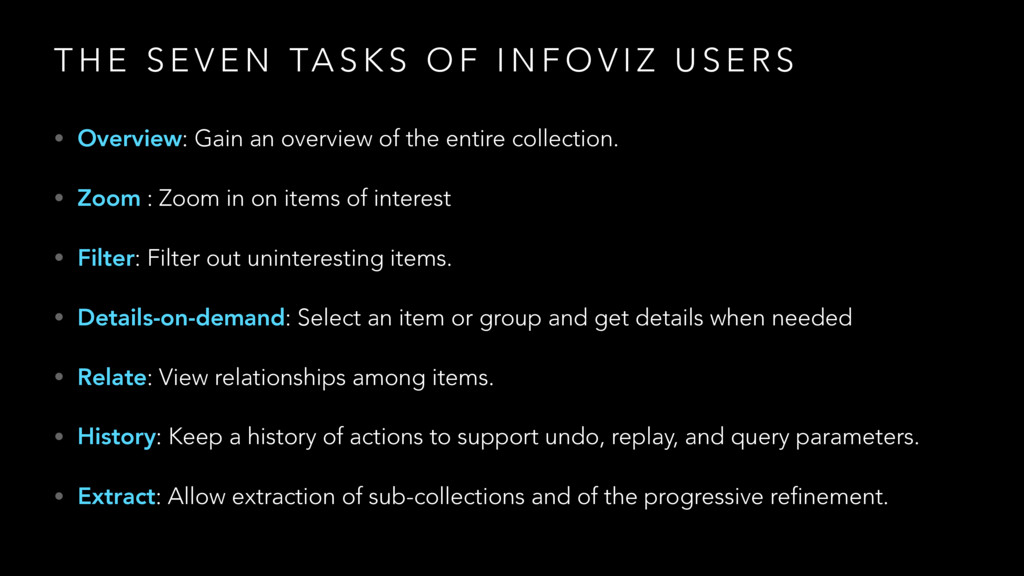
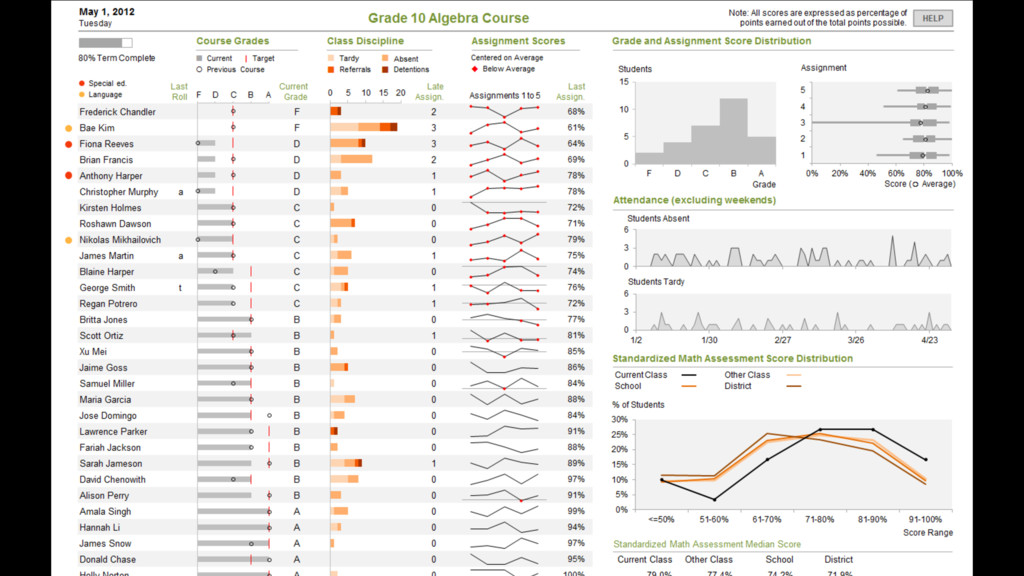
K S O F I N F O V I Z U S E R S • Overview: Gain an overview of the entire collection. • Zoom : Zoom in on items of interest • Filter: Filter out uninteresting items. • Details-on-demand: Select an item or group and get details when needed • Relate: View relationships among items. • History: Keep a history of actions to support undo, replay, and query parameters. • Extract: Allow extraction of sub-collections and of the progressive refinement.