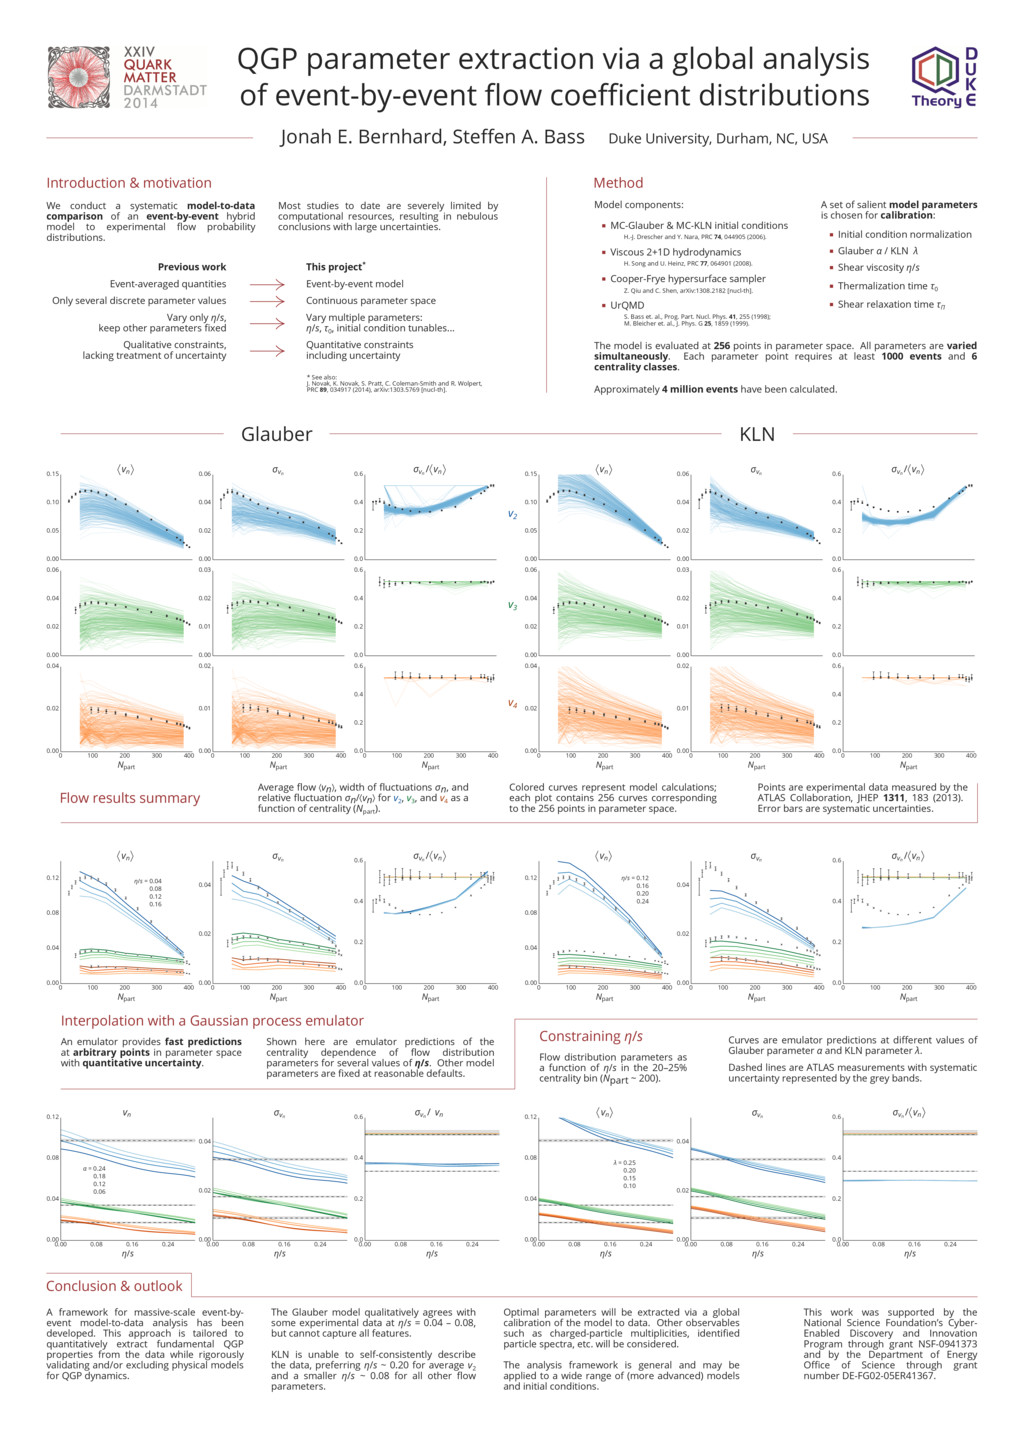
experimental data at η/s = 0.04 – 0.08, but cannot capture all features. KLN is unable to self-consistently describe the data, preferring η/s ~ 0.20 for average v2 and a smaller η/s ~ 0.08 for all other flow parameters. A framework for massive-scale event-by- event model-to-data analysis has been developed. This approach is tailored to quantitatively extract fundamental QGP properties from the data while rigorously validating and/or excluding physical models for QGP dynamics. Optimal parameters will be extracted via a global calibration of the model to data. Other observables such as charged-particle multiplicities, identified particle spectra, etc. will be considered. The analysis framework is general and may be applied to a wide range of (more advanced) models and initial conditions. This work was supported by the National Science Foundation’s Cyber- Enabled Discovery and Innovation Program through grant NSF-0941373 and by the Department of Energy Office of Science through grant number DE-FG02-05ER41367. 0.00 0.08 0.16 0.24 η/s 0.00 0.04 0.08 0.12 vn 0.00 0.08 0.16 0.24 η/s 0.00 0.02 0.04 σvn 0.00 0.08 0.16 0.24 η/s 0.0 0.2 0.4 0.6 σvn / vn Constraining η/s Flow distribution parameters as a function of η/s in the 20–25% centrality bin (Npart ~ 200). Curves are emulator predictions at different values of Glauber parameter α and KLN parameter λ. Dashed lines are ATLAS measurements with systematic uncertainty represented by the grey bands. λ = 0.25 0.20 0.15 0.10 0.00 0.08 0.16 0.24 η/s 0.00 0.04 0.08 0.12 vn 0.00 0.08 0.16 0.24 η/s 0.00 0.02 0.04 σvn 0.00 0.08 0.16 0.24 η/s 0.0 0.2 0.4 0.6 σvn / vn α = 0.24 0.18 0.12 0.06 0 100 200 300 400 Npart 0.00 0.04 0.08 0.12 vn 0 100 200 300 400 Npart 0.00 0.02 0.04 σvn 0 100 200 300 400 Npart 0.0 0.2 0.4 0.6 σvn / vn Interpolation with a Gaussian process emulator An emulator provides fast predictions at arbitrary points in parameter space with quantitative uncertainty. Shown here are emulator predictions of the centrality dependence of flow distribution parameters for several values of η/s. Other model parameters are fixed at reasonable defaults. η/s = 0.04 0.08 0.12 0.16 0 100 200 300 400 Npart 0.00 0.04 0.08 0.12 vn 0 100 200 300 400 Npart 0.00 0.02 0.04 σvn 0 100 200 300 400 Npart 0.0 0.2 0.4 0.6 σvn / vn η/s = 0.12 0.16 0.20 0.24 KLN Glauber v4 v2 v3 Flow results summary Points are experimental data measured by the ATLAS Collaboration, JHEP 1311, 183 (2013). Error bars are systematic uncertainties. Colored curves represent model calculations; each plot contains 256 curves corresponding to the 256 points in parameter space. Average flow vn , width of fluctuations σn, and relative fluctuation σn/ vn for v2 , v3 , and v4 as a function of centrality (Npart ). 0.00 0.05 0.10 0.15 vn 0.00 0.02 0.04 0.06 σvn 0.0 0.2 0.4 0.6 σvn / vn 0.00 0.02 0.04 0.06 0.00 0.01 0.02 0.03 0.0 0.2 0.4 0.6 0 100 200 300 400 Npart 0.00 0.02 0.04 0 100 200 300 400 Npart 0.00 0.01 0.02 0 100 200 300 400 Npart 0.0 0.2 0.4 0.6 0.00 0.05 0.10 0.15 vn 0.00 0.02 0.04 0.06 σvn 0.0 0.2 0.4 0.6 σvn / vn 0.00 0.02 0.04 0.06 0.00 0.01 0.02 0.03 0.0 0.2 0.4 0.6 0 100 200 300 400 Npart 0.00 0.02 0.04 0 100 200 300 400 Npart 0.00 0.01 0.02 0 100 200 300 400 Npart 0.0 0.2 0.4 0.6 We conduct a systematic model-to-data comparison of an event-by-event hybrid model to experimental flow probability distributions. Model components: MC-Glauber & MC-KLN initial conditions H.-J. Drescher and Y. Nara, PRC 74, 044905 (2006). Viscous 2+1D hydrodynamics H. Song and U. Heinz, PRC 77, 064901 (2008). Cooper-Frye hypersurface sampler Z. Qiu and C. Shen, arXiv:1308.2182 [nucl-th]. UrQMD S. Bass et. al., Prog. Part. Nucl. Phys. 41, 255 (1998); M. Bleicher et. al., J. Phys. G 25, 1859 (1999). A set of salient model parameters is chosen for calibration: Thermalization time τ0 Initial condition normalization Glauber α / KLN λ Shear viscosity η/s Shear relaxation time τΠ The model is evaluated at 256 points in parameter space. All parameters are varied simultaneously. Each parameter point requires at least 1000 events and 6 centrality classes. Approximately 4 million events have been calculated. Most studies to date are severely limited by computational resources, resulting in nebulous conclusions with large uncertainties. Method * See also: J. Novak, K. Novak, S. Pratt, C. Coleman-Smith and R. Wolpert, PRC 89, 034917 (2014), arXiv:1303.5769 [nucl-th]. This project* Event-by-event model Vary multiple parameters: η/s, τ0 , initial condition tunables... Continuous parameter space Quantitative constraints including uncertainty Previous work Vary only η/s, keep other parameters fixed Qualitative constraints, lacking treatment of uncertainty Only several discrete parameter values Event-averaged quantities Introduction & motivation Duke University, Durham, NC, USA Jonah E. Bernhard, Steffen A. Bass QGP parameter extraction via a global analysis of event-by-event flow coefficient distributions