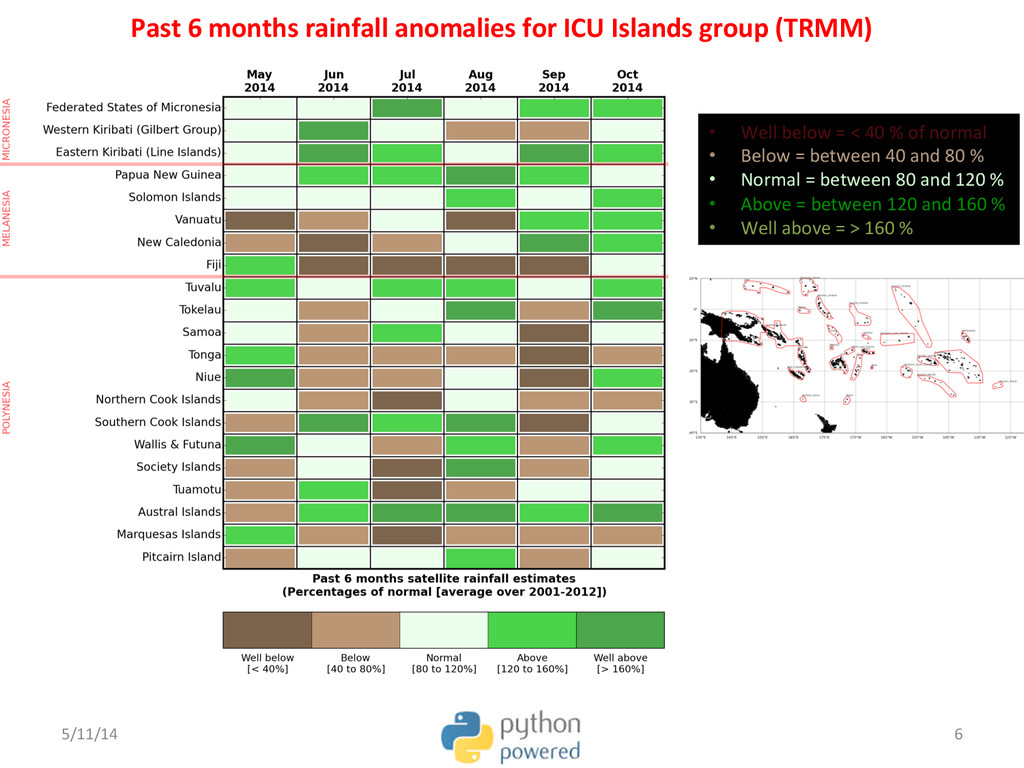
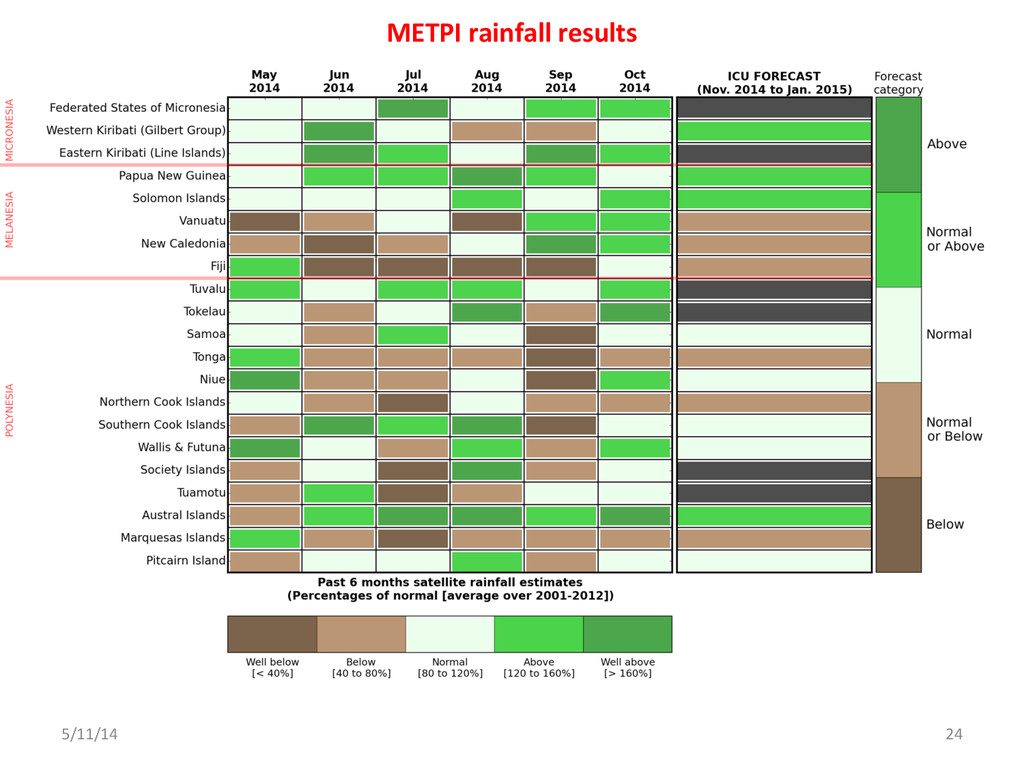
% of normal • Below = between 40 and 80 % • Normal = between 80 and 120 % • Above = between 120 and 160 % • Well above = > 160 % Past 6 months rainfall anomalies for ICU Islands group (TRMM)
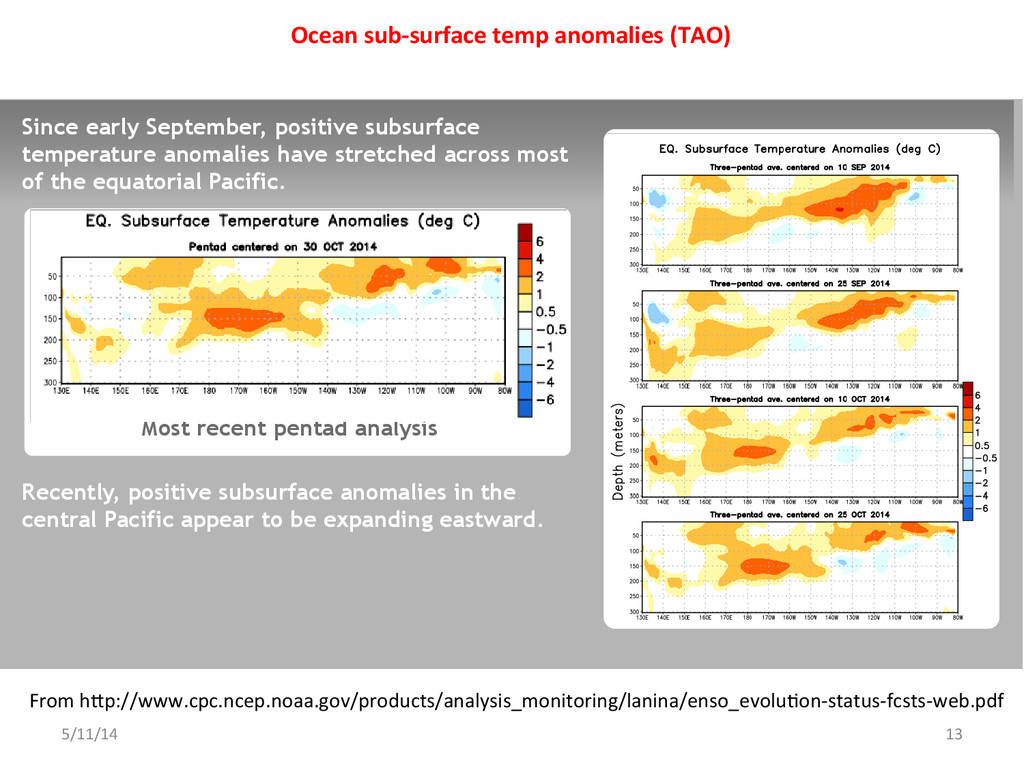
From h^p://www.cpc.ncep.noaa.gov/products/analysis_monitoring/lanina/enso_evoluEon-‐status-‐fcsts-‐web.pdf Sub-Surface Temperature Departures in the Equatorial Pacific Most recent pentad analysis Recently, positive subsurface anomalies in the central Pacific appear to be expanding eastward. Since early September, positive subsurface temperature anomalies have stretched across most of the equatorial Pacific.
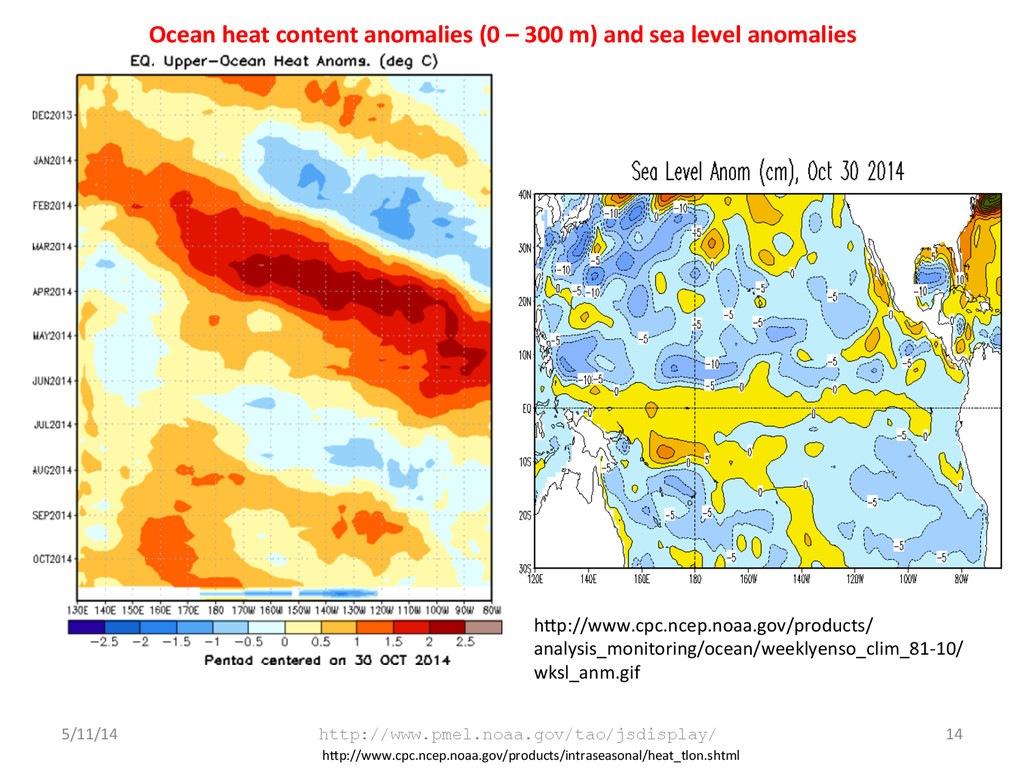
waves have alternating warm and cold phases. The warm phase is indicated by dashed lines. Down-welling and warming occur in the leading portion of a Kelvin wave, and up-welling and cooling occur in the trailing portion. During January - May 2014, the downwelling phase of a strong Kelvin wave crossed the Pacific. During May-July, positive temperature anomalies progressively disappeared from the equatorial Pacific in response to the upwelling phase of the Kelvin wave. Since early October, positive subsurface temperature anomalies have expanded eastward. 5/11/14 15 Ocean heat content anomalies (0 – 300 m) and sea level anomalies From h^p://www.cpc.ncep.noaa.gov/products/analysis_monitoring/lanina/enso_evoluEon-‐status-‐fcsts-‐web.pdf
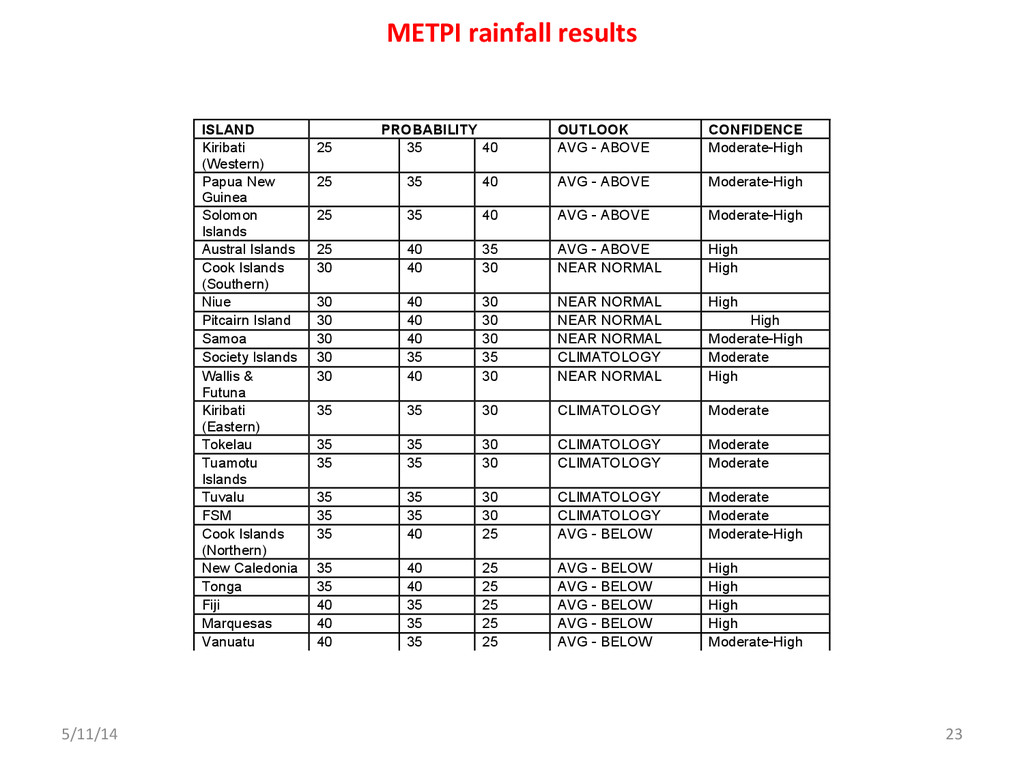
– January 2015 ICU Rainfall Guidance ISLAND PROBABILITY OUTLOOK CONFIDENCE Kiribati (Western) 25 35 40 AVG - ABOVE Moderate-High Papua New Guinea 25 35 40 AVG - ABOVE Moderate-High Solomon Islands 25 35 40 AVG - ABOVE Moderate-High Austral Islands 25 40 35 AVG - ABOVE High Cook Islands (Southern) 30 40 30 NEAR NORMAL High Niue 30 40 30 NEAR NORMAL High Pitcairn Island 30 40 30 NEAR NORMAL High Samoa 30 40 30 NEAR NORMAL Moderate-High Society Islands 30 35 35 CLIMATOLOGY Moderate Wallis & Futuna 30 40 30 NEAR NORMAL High Kiribati (Eastern) 35 35 30 CLIMATOLOGY Moderate Tokelau 35 35 30 CLIMATOLOGY Moderate Tuamotu Islands 35 35 30 CLIMATOLOGY Moderate Tuvalu 35 35 30 CLIMATOLOGY Moderate FSM 35 35 30 CLIMATOLOGY Moderate Cook Islands (Northern) 35 40 25 AVG - BELOW Moderate-High New Caledonia 35 40 25 AVG - BELOW High Tonga 35 40 25 AVG - BELOW High Fiji 40 35 25 AVG - BELOW High Marquesas 40 35 25 AVG - BELOW High Vanuatu 40 35 25 AVG - BELOW Moderate-High Rainfall outcomes estimated from an average of dynamical and statistical models for the Pacific Ocean region. The first three columns indicate the probability for rainfall occurring in one of three terciles (lower-L, middle-M, upper-U). The fourth column is an overall assessment of the expected rainfall relative to normal for the time of year.