медсестры и в кабинете заведующего отделения 3 высвобождение времени медсестер 50% ускорение реакции медсестер 50 раз сокращение контактов с больными 2 раза
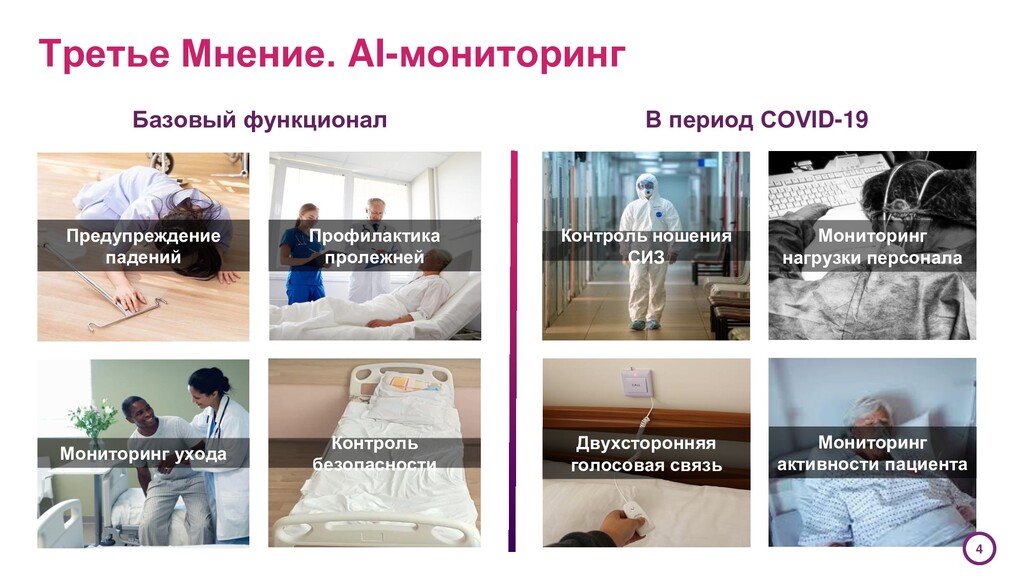
СИЗ Мониторинг активности пациента Двухсторонняя голосовая связь Мониторинг нагрузки персонала В период COVID-19 Третье Мнение. AI-мониторинг Базовый функционал 4
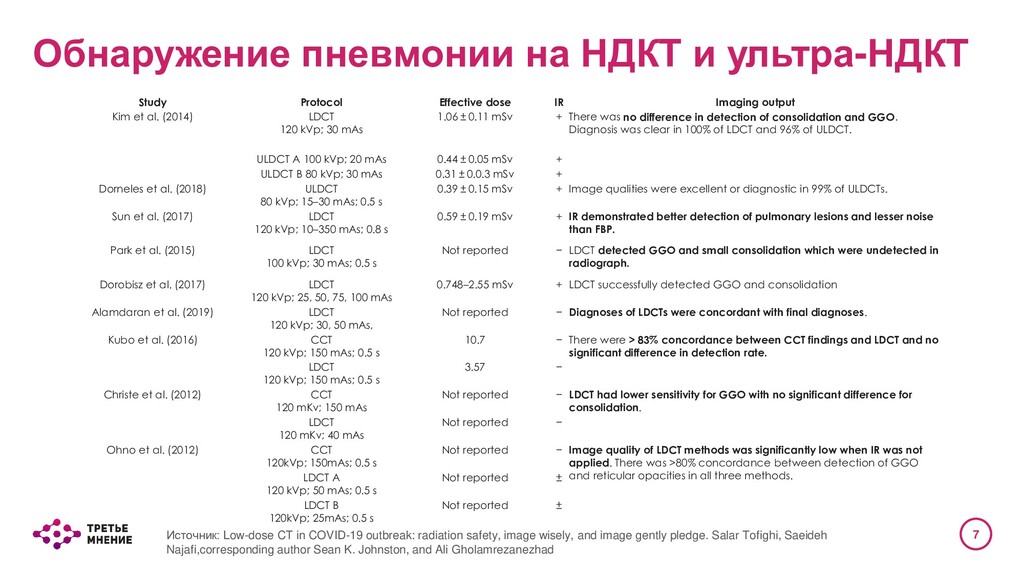
al. (2014) LDCT 120 kVp; 30 mAs 1.06 ± 0.11 mSv + There was no difference in detection of consolidation and GGO. Diagnosis was clear in 100% of LDCT and 96% of ULDCT. ULDCT A 100 kVp; 20 mAs 0.44 ± 0.05 mSv + ULDCT B 80 kVp; 30 mAs 0.31 ± 0.0.3 mSv + Dorneles et al. (2018) ULDCT 80 kVp; 15–30 mAs; 0.5 s 0.39 ± 0.15 mSv + Image qualities were excellent or diagnostic in 99% of ULDCTs. Sun et al. (2017) LDCT 120 kVp; 10–350 mAs; 0.8 s 0.59 ± 0.19 mSv + IR demonstrated better detection of pulmonary lesions and lesser noise than FBP. Park et al. (2015) LDCT 100 kVp; 30 mAs; 0.5 s Not reported − LDCT detected GGO and small consolidation which were undetected in radiograph. Dorobisz et al. (2017) LDCT 120 kVp; 25, 50, 75, 100 mAs 0.748–2.55 mSv + LDCT successfully detected GGO and consolidation Alamdaran et al. (2019) LDCT 120 kVp; 30, 50 mAs, Not reported − Diagnoses of LDCTs were concordant with final diagnoses. Kubo et al. (2016) CCT 120 kVp; 150 mAs; 0.5 s 10.7 − There were > 83% concordance between CCT findings and LDCT and no significant difference in detection rate. LDCT 120 kVp; 150 mAs; 0.5 s 3.57 − Christe et al. (2012) CCT 120 mKv; 150 mAs Not reported − LDCT had lower sensitivity for GGO with no significant difference for consolidation. LDCT 120 mKv; 40 mAs Not reported − Ohno et al. (2012) CCT 120kVp; 150mAs; 0.5 s Not reported − Image quality of LDCT methods was significantly low when IR was not applied. There was >80% concordance between detection of GGO and reticular opacities in all three methods. LDCT A 120 kVp; 50 mAs; 0.5 s Not reported ± LDCT B 120kVp; 25mAs; 0.5 s Not reported ± Источник: Low-dose CT in COVID-19 outbreak: radiation safety, image wisely, and image gently pledge. Salar Tofighi, Saeideh Najafi,corresponding author Sean K. Johnston, and Ali Gholamrezanezhad Обнаружение пневмонии на НДКТ и ультра-НДКТ
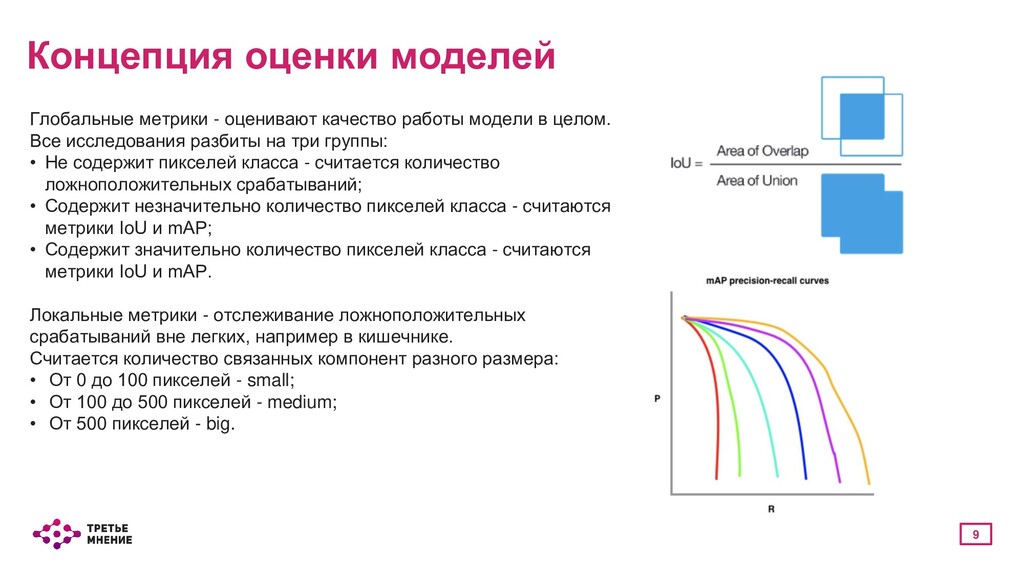
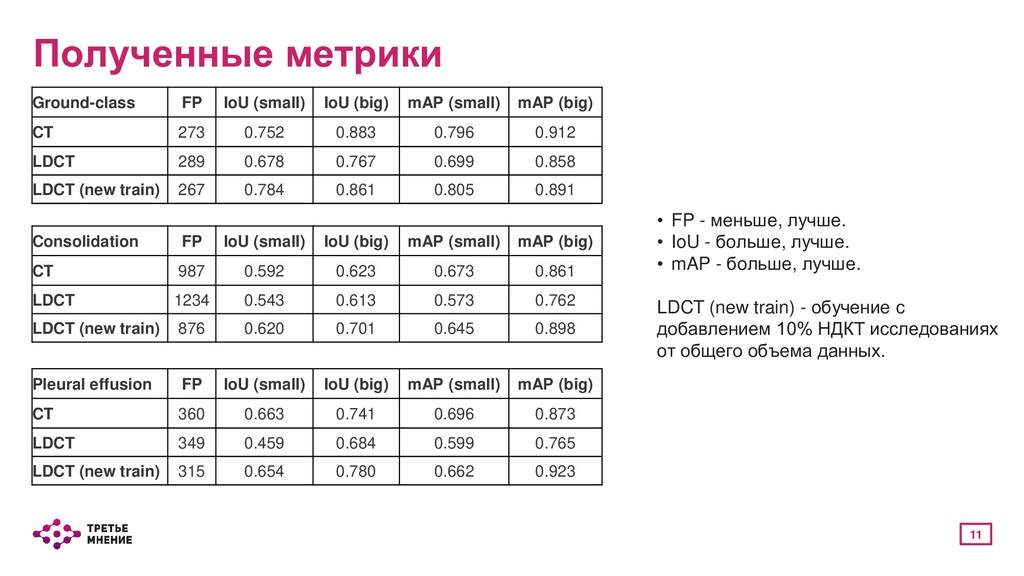
модели в целом. Все исследования разбиты на три группы: • Не содержит пикселей класса - считается количество ложноположительных срабатываний; • Содержит незначительно количество пикселей класса - считаются метрики IoU и mAP; • Содержит значительно количество пикселей класса - считаются метрики IoU и mAP. Локальные метрики - отслеживание ложноположительных срабатываний вне легких, например в кишечнике. Считается количество связанных компонент разного размера: • От 0 до 100 пикселей - small; • От 100 до 500 пикселей - medium; • От 500 пикселей - big.
![Александр Громов [email protected] Telegram: @allgrom](https://files.speakerdeck.com/presentations/706ae6f1182241b29a5570de7fca16d8/slide_13.jpg)