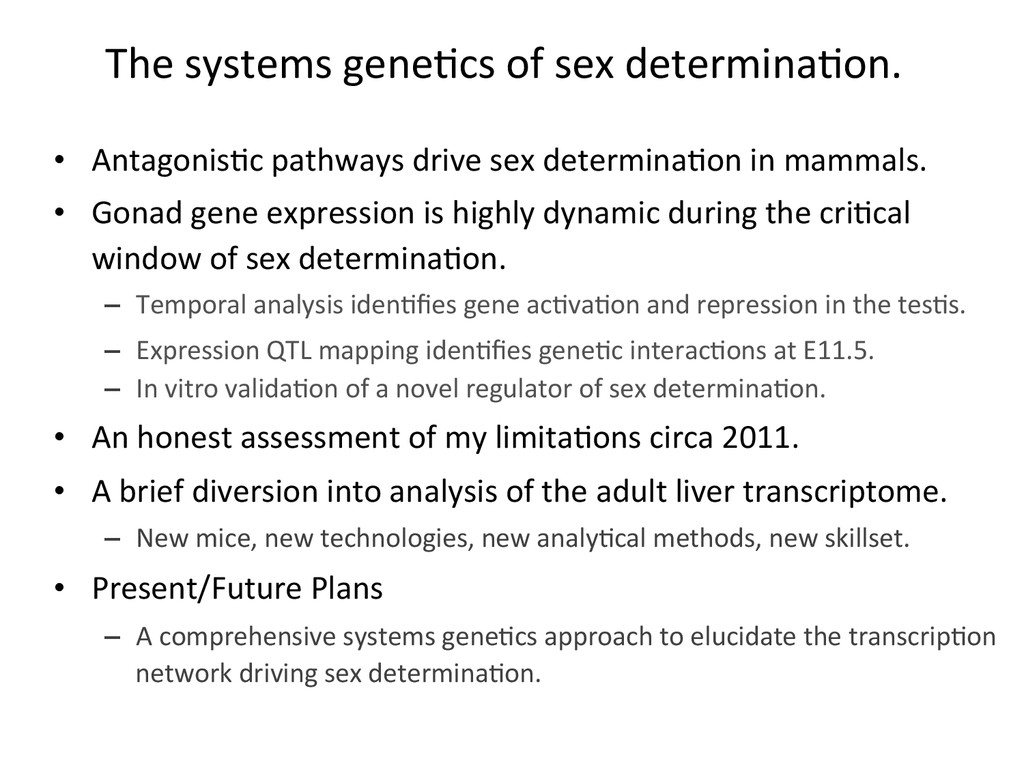
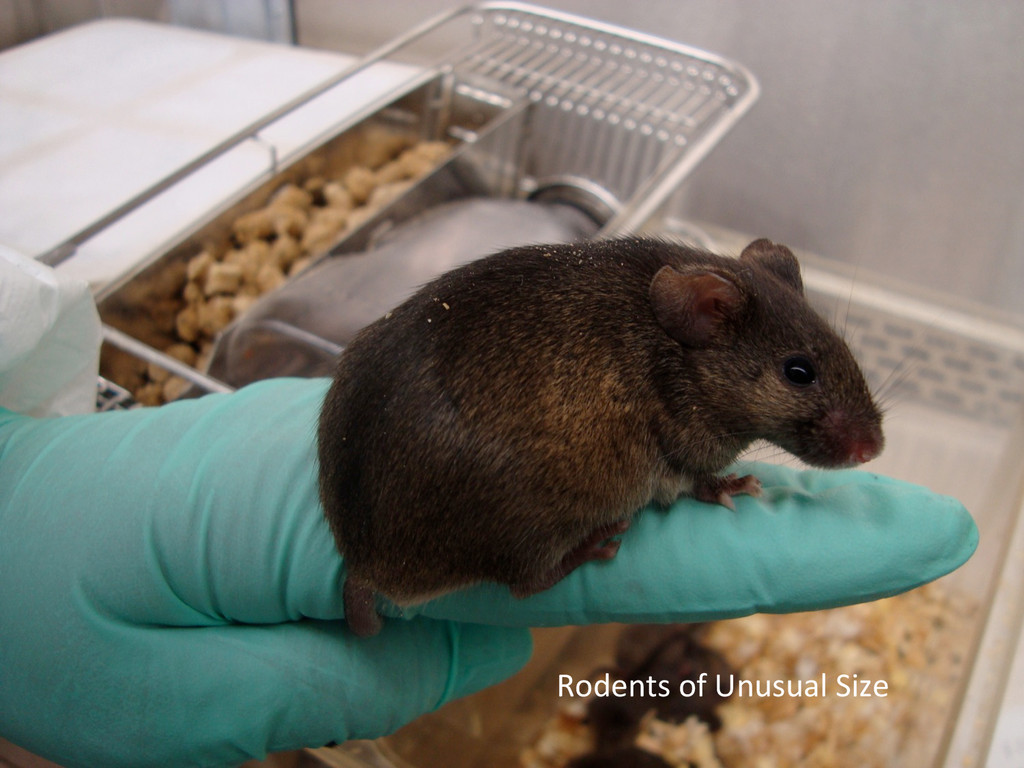
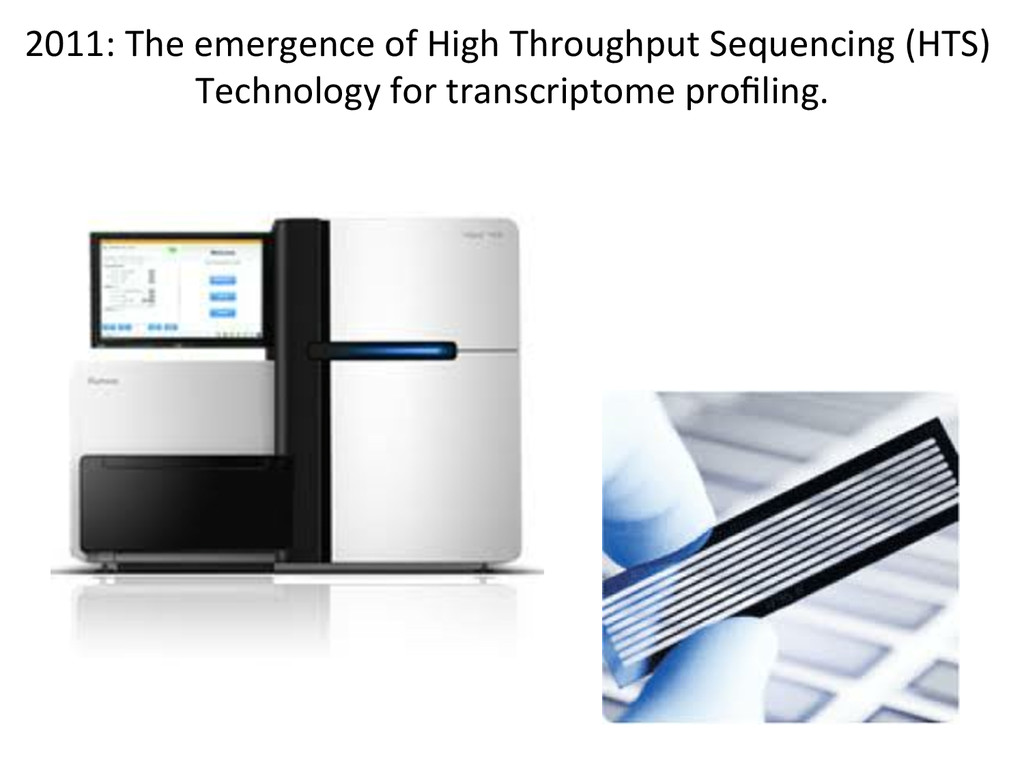
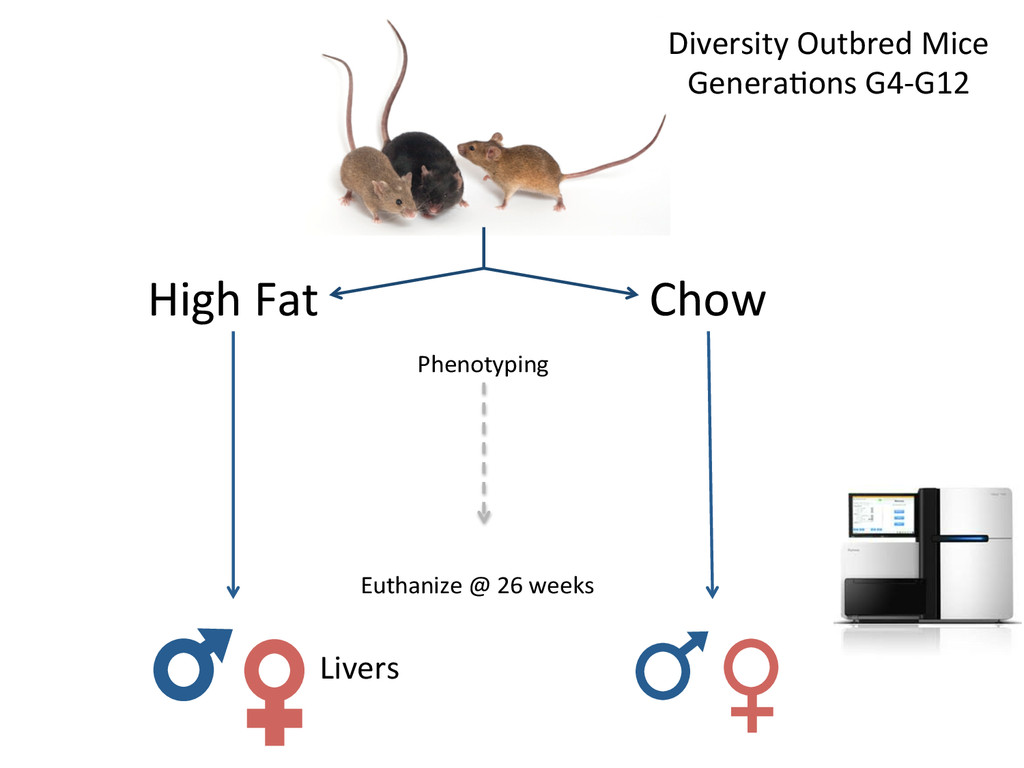
drive sex determina7on in mammals. • Gonad gene expression is highly dynamic during the cri7cal window of sex determina7on. – Temporal analysis iden7fies gene ac7va7on and repression in the tes7s. – Expression QTL mapping iden7fies gene7c interac7ons at E11.5. – In vitro valida7on of a novel regulator of sex determina7on. • An honest assessment of my limita7ons circa 2011. • A brief diversion into analysis of the adult liver transcriptome. – New mice, new technologies, new analy7cal methods, new skillset. • Present/Future Plans – A comprehensive systems gene7cs approach to elucidate the transcrip7on network driving sex determina7on.
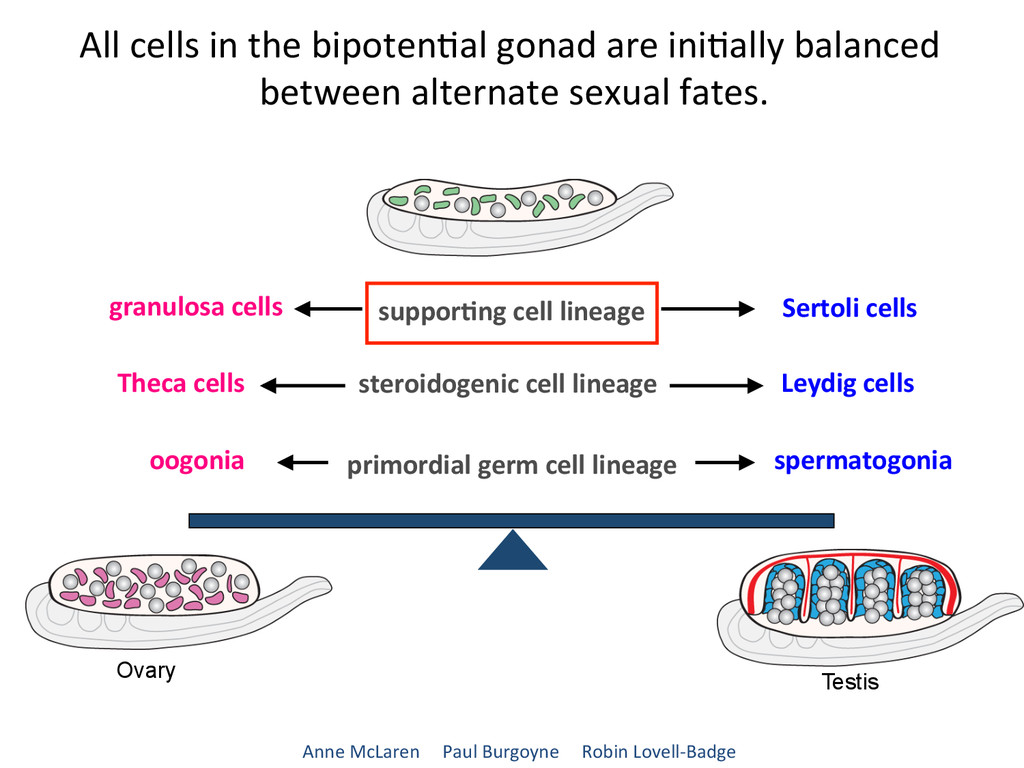
lineage steroidogenic cell lineage primordial germ cell lineage spermatogonia Leydig cells Sertoli cells Theca cells oogonia All cells in the bipoten7al gonad are ini7ally balanced between alternate sexual fates. Anne McLaren Paul Burgoyne Robin Lovell-‐Badge Ovary Testis
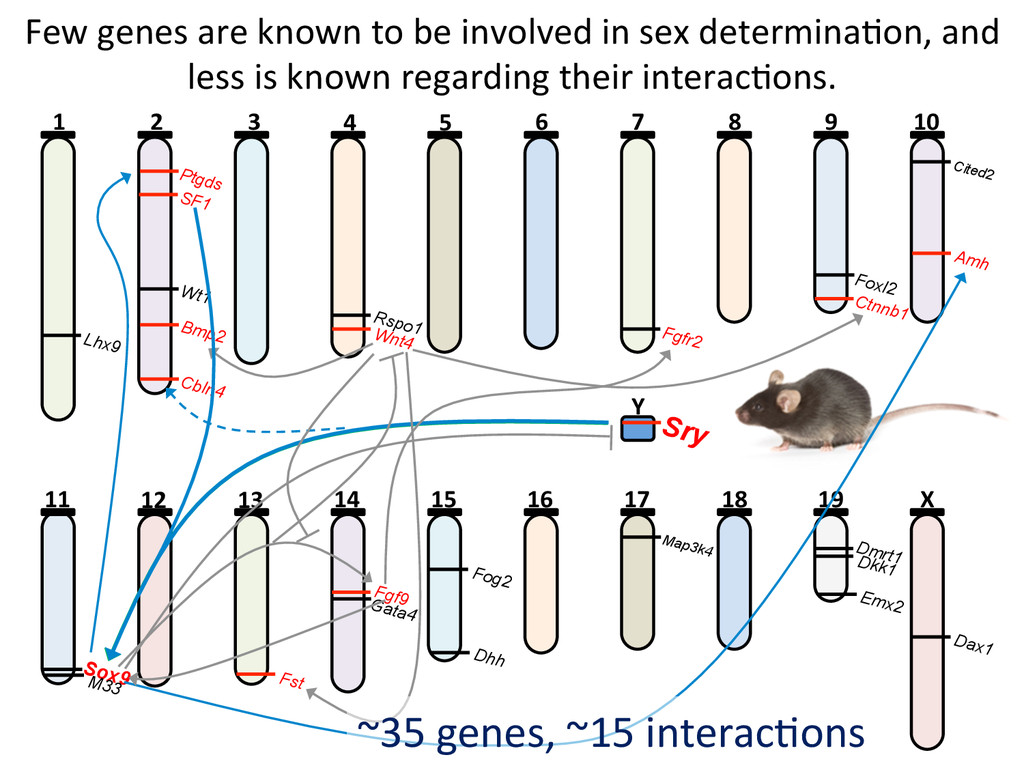
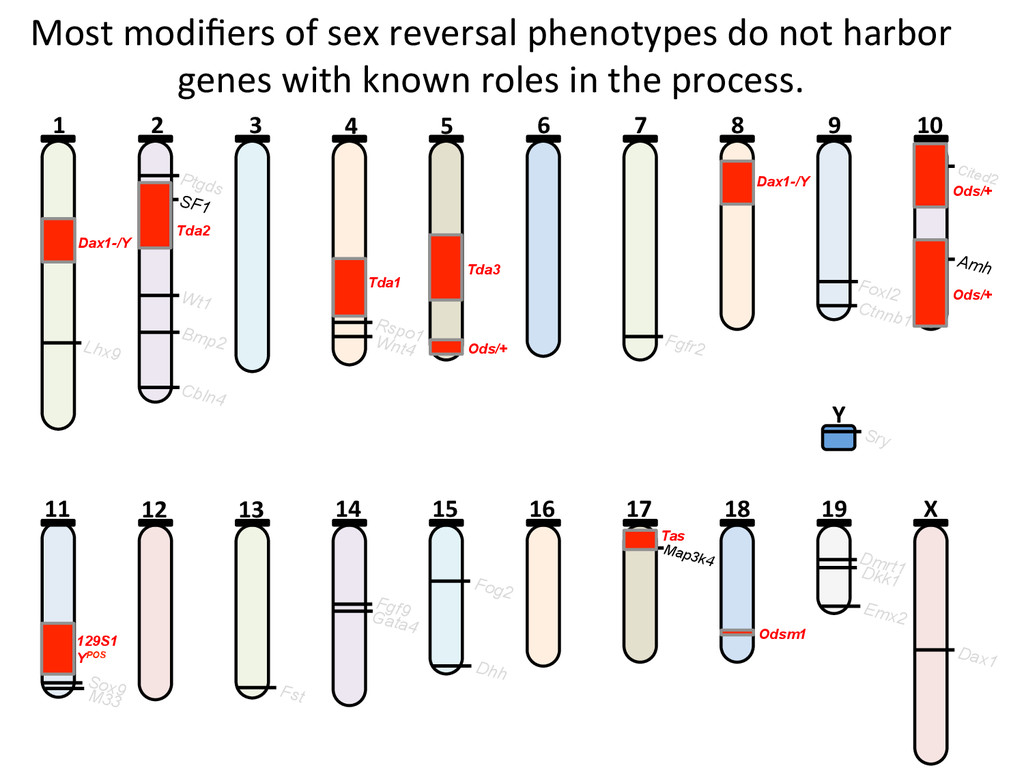
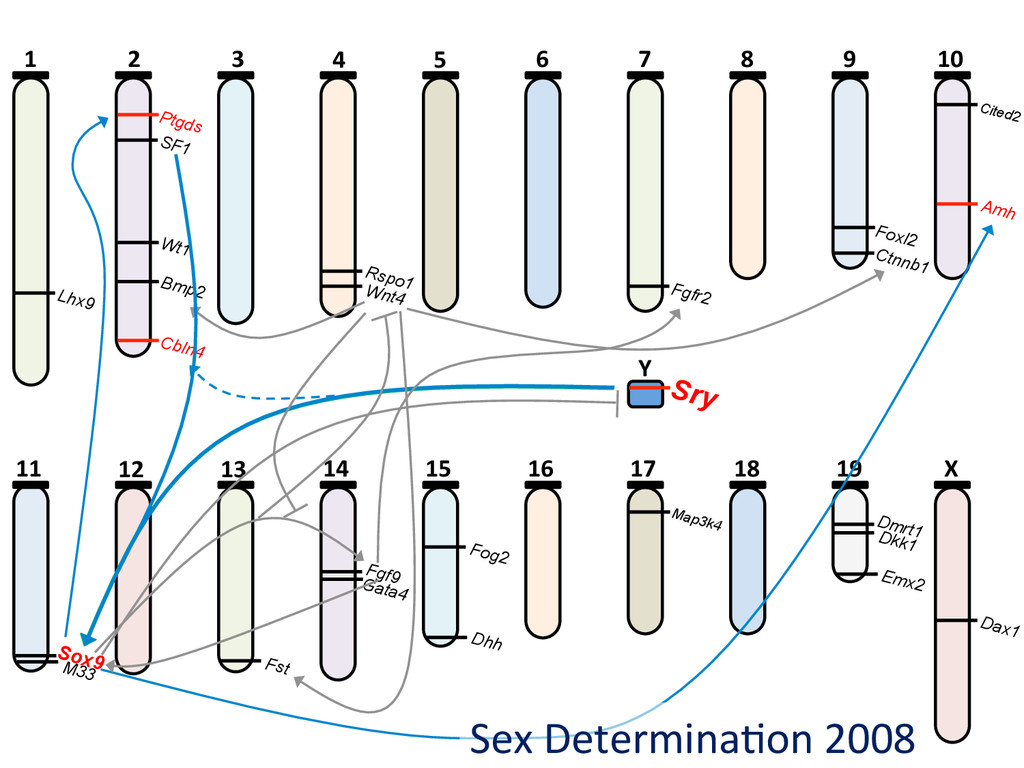
6 7 8 9 10 11 12 13 14 15 16 17 18 19 X Y Lhx9 Ptgds SF1 Wt1 Bmp2 Cbln4 Rspo1 Wnt4 Fgfr2 Foxl2 Ctnnb1 Cited2 Amh Sry Sox9 M33 Fst Fgf9 Gata4 Dhh Fog2 Map3k4 Dmrt1 Dkk1 Emx2 Dax1 ~35 genes, ~15 interac7ons Few genes are known to be involved in sex determina7on, and less is known regarding their interac7ons.
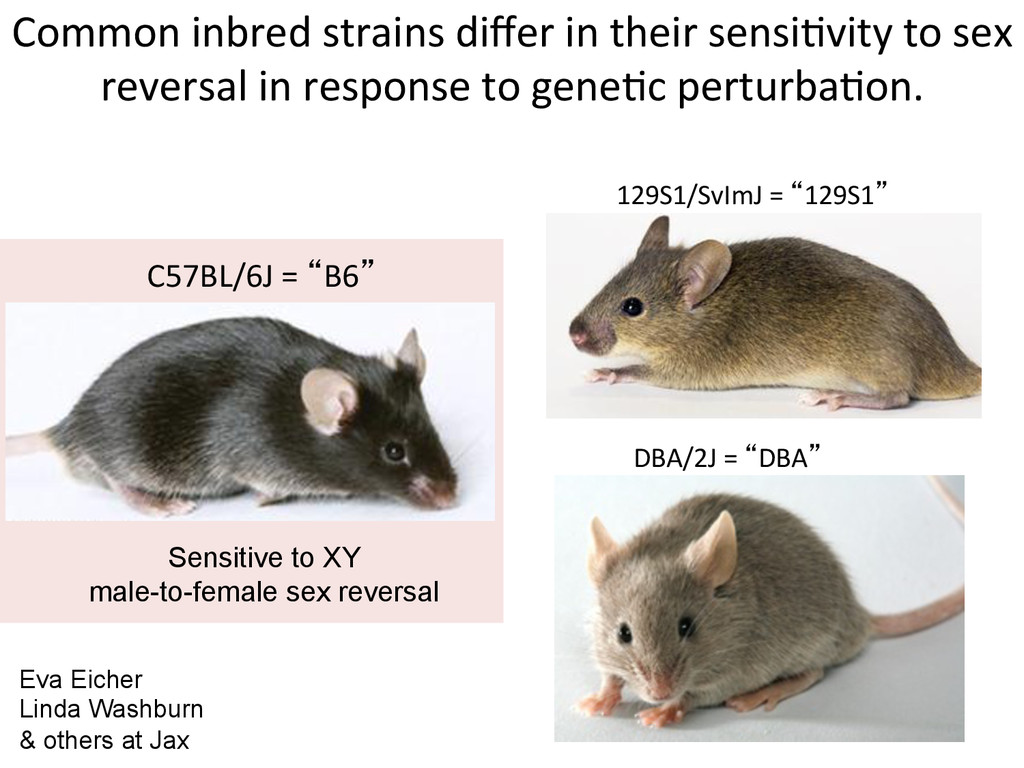
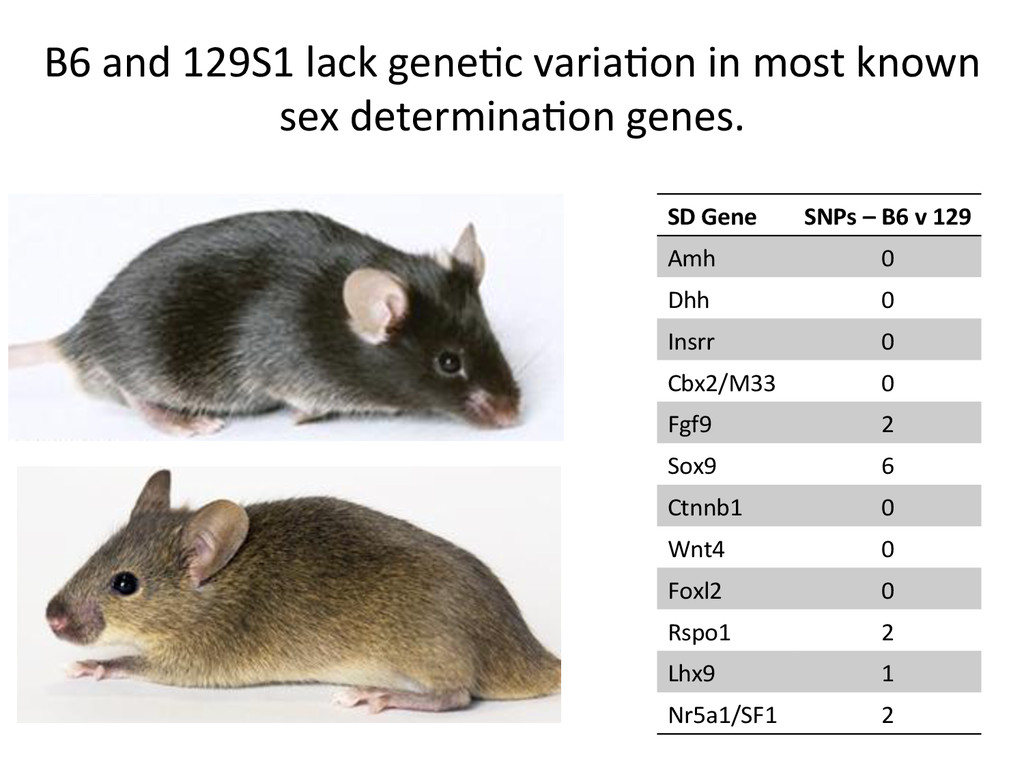
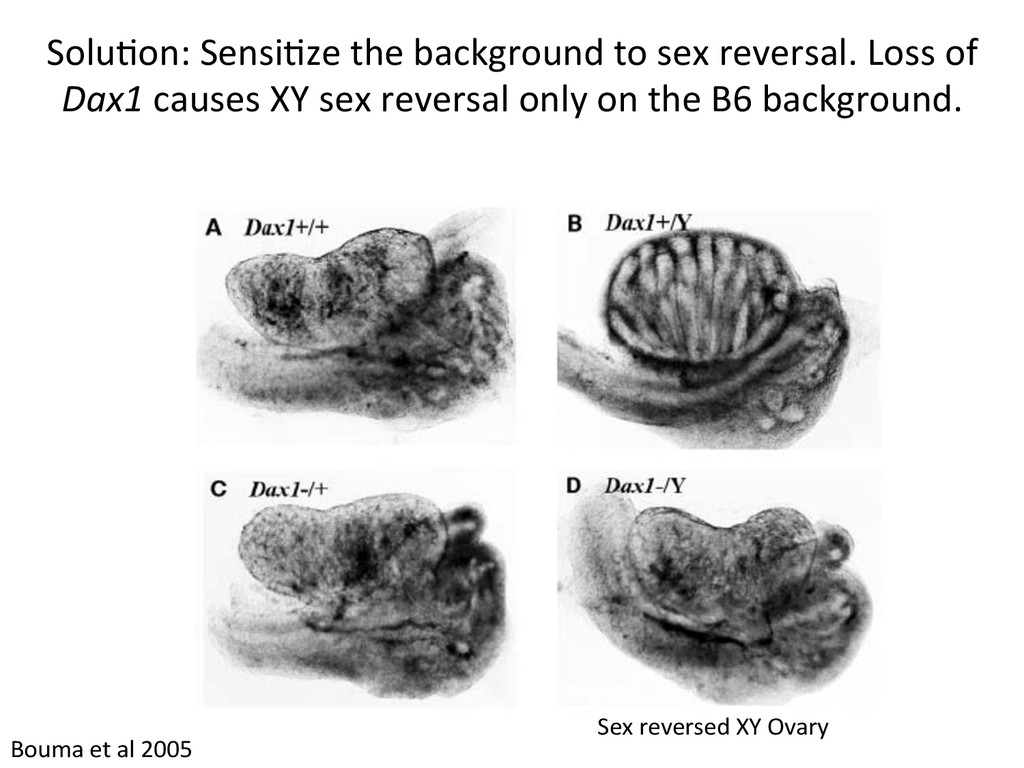
reversal in response to gene7c perturba7on. 129S1/SvImJ = “129S1” DBA/2J = “DBA” C57BL/6J = “B6” Sensitive to XY male-to-female sex reversal Eva Eicher Linda Washburn & others at Jax
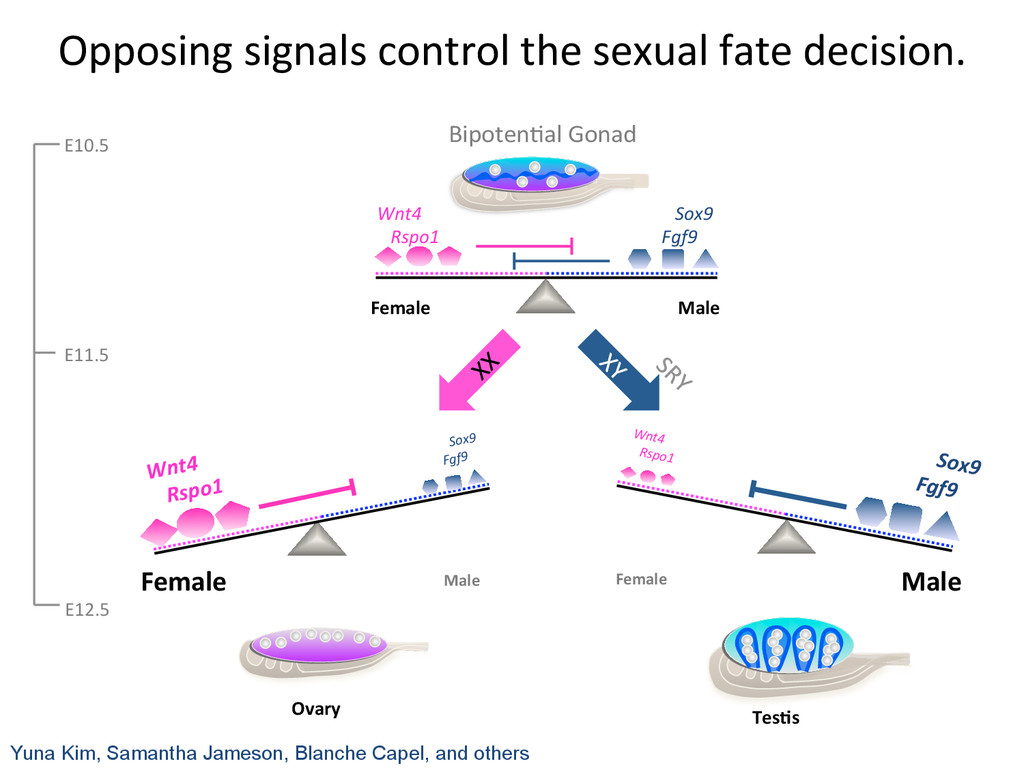
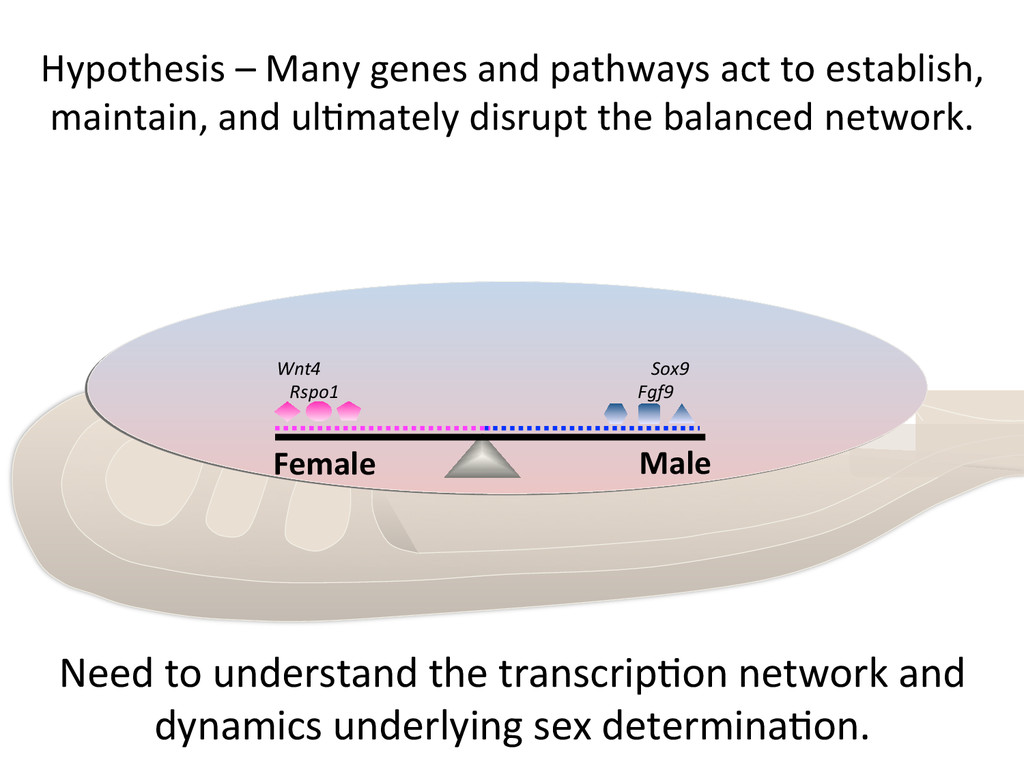
maintain, and ul7mately disrupt the balanced network. Female Male Wnt4 Rspo1 Sox9 Fgf9 Need to understand the transcrip7on network and dynamics underlying sex determina7on.
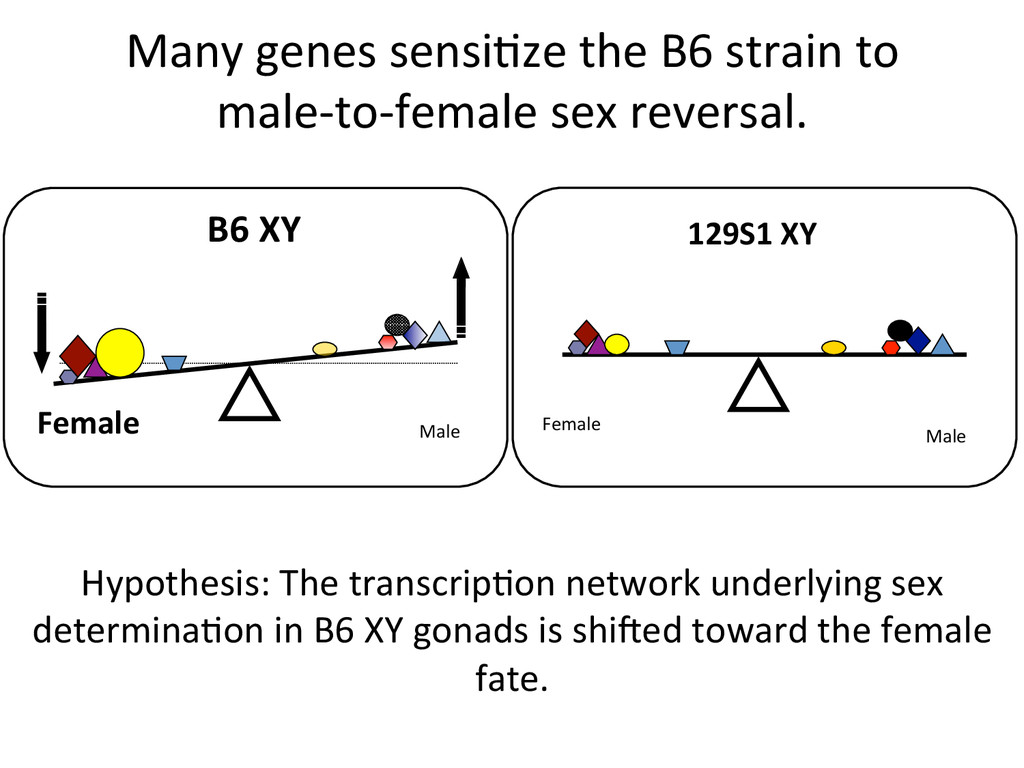
sex reversal. Female Male 129S1 XY Female Male B6 XY Hypothesis: The transcrip7on network underlying sex determina7on in B6 XY gonads is shided toward the female fate.
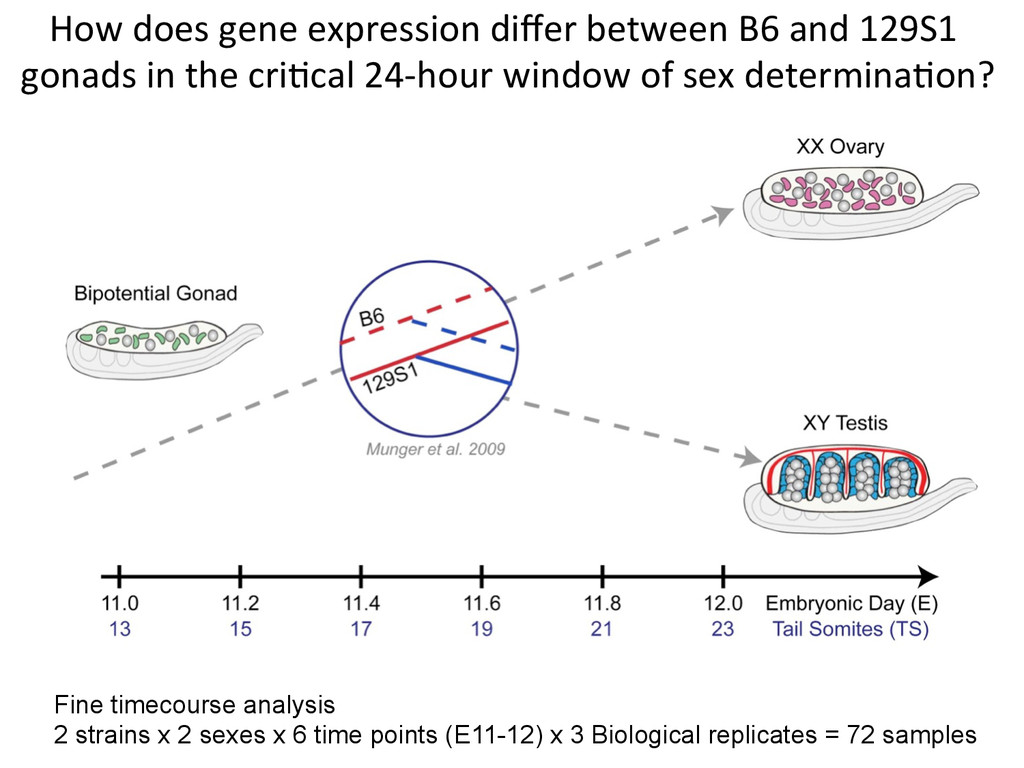
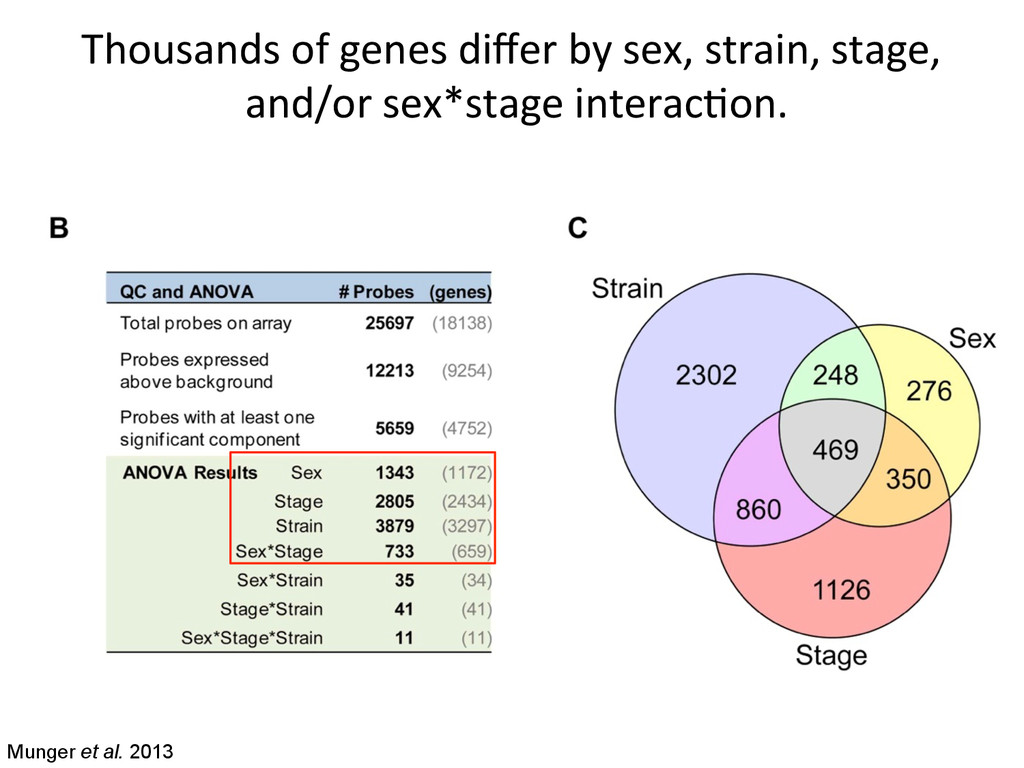
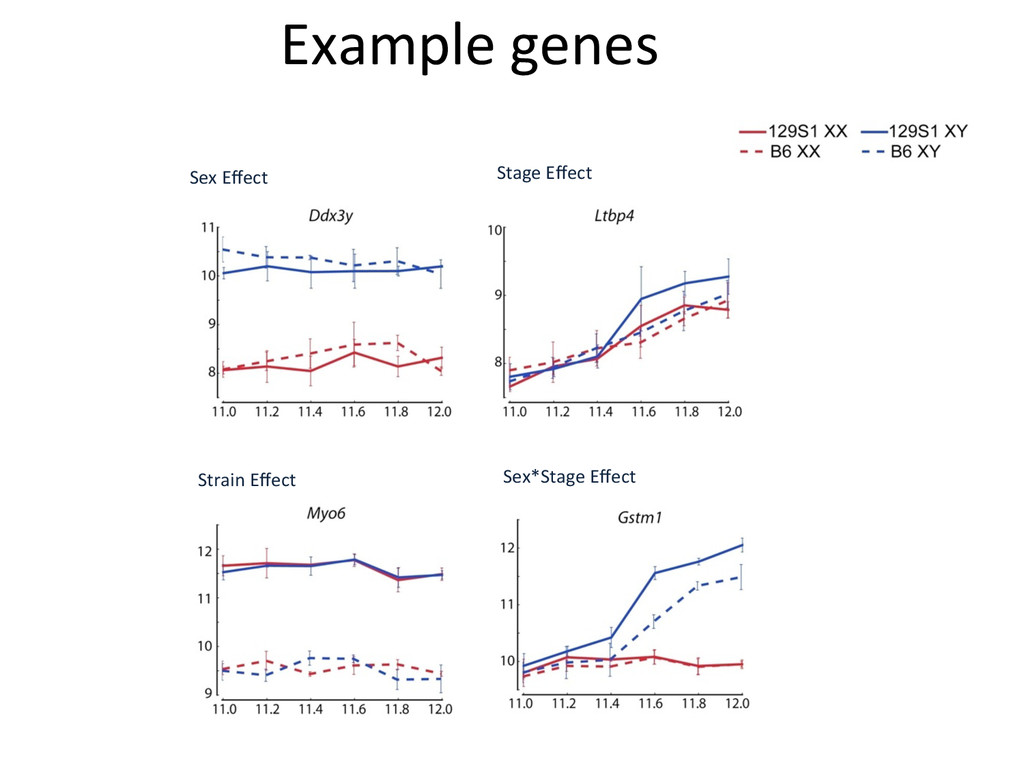
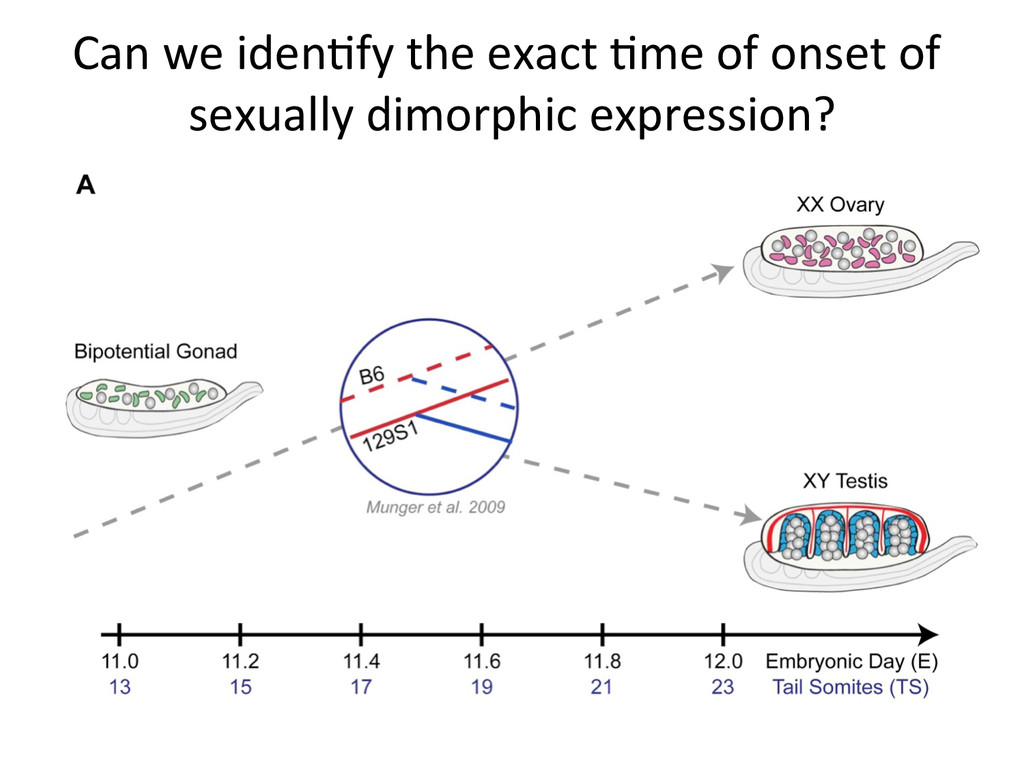
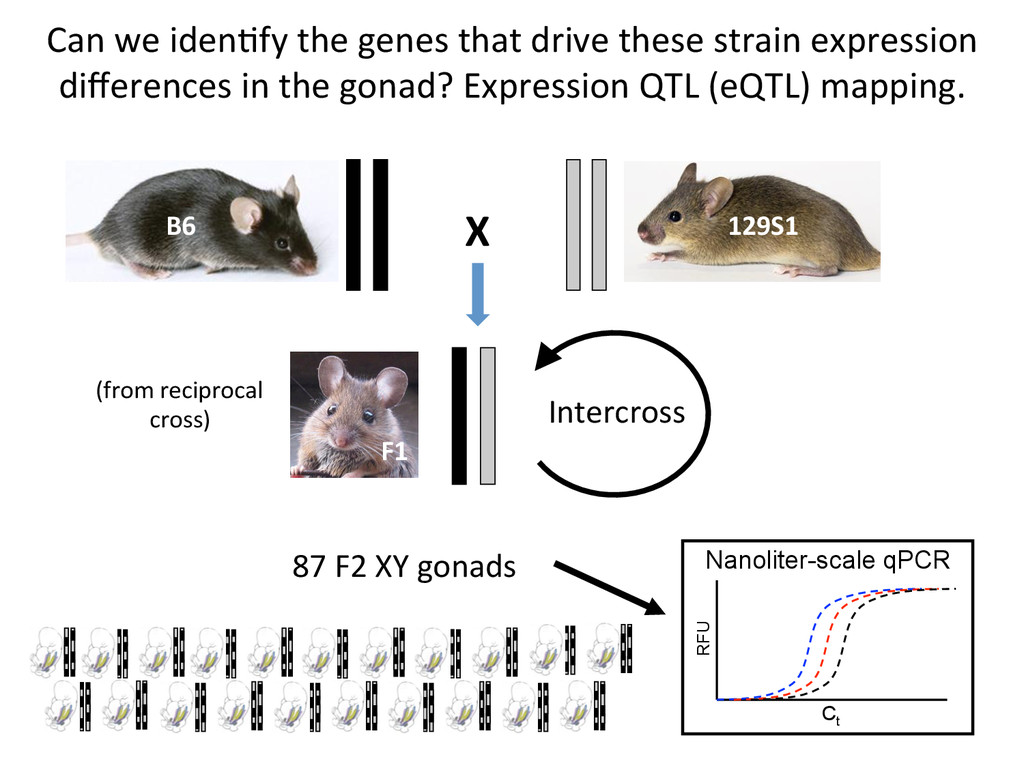
time points (E11-12) x 3 Biological replicates = 72 samples How does gene expression differ between B6 and 129S1 gonads in the cri7cal 24-‐hour window of sex determina7on?
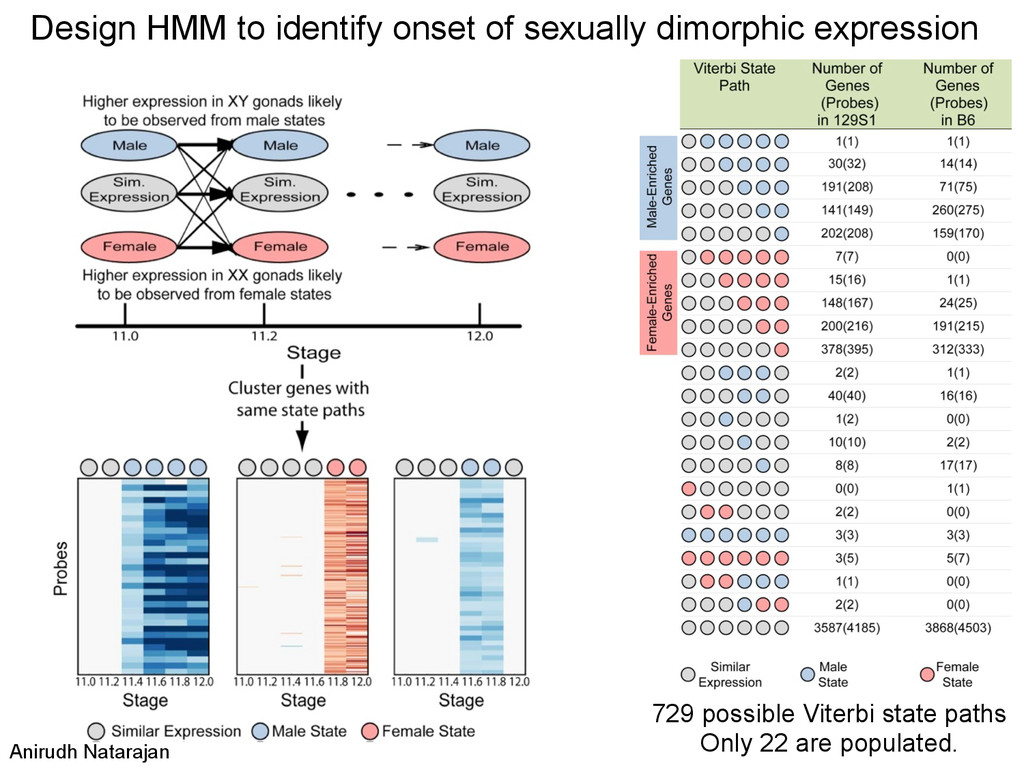
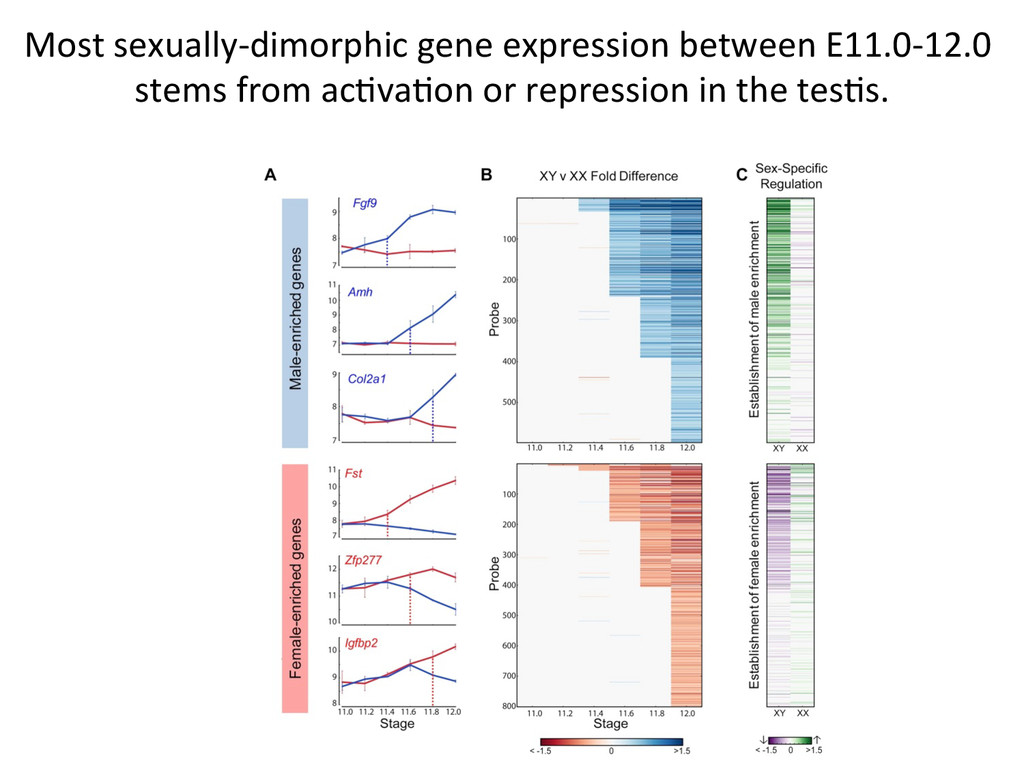
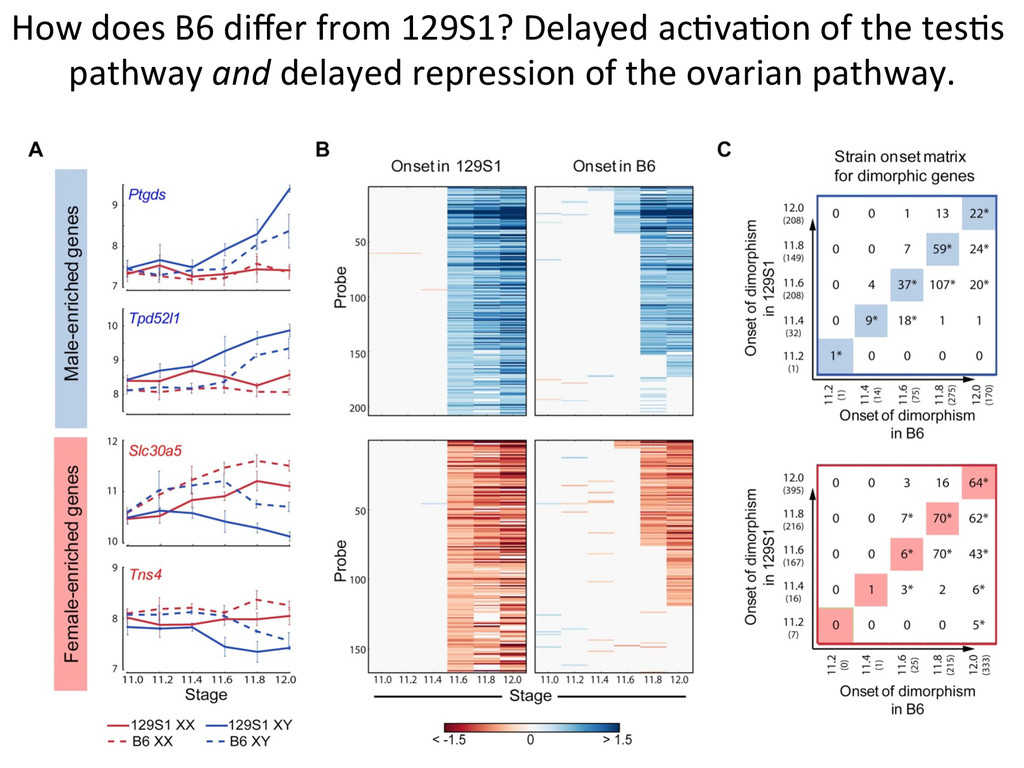
in sex determina7on phenotypes. – The common B6 strain is sensi7ve to XY sex reversal. • The gonad transcriptome is highly dynamic during the 24-‐hour cri7cal period of sex determina7on. – Sexually dimorphic genes during this window are predominately expressed in suppor7ng cell precursors. • Ac7va7on of the male tes7s pathway and repression of the female ovarian pathway are both delayed by 5 hours in B6 testes.
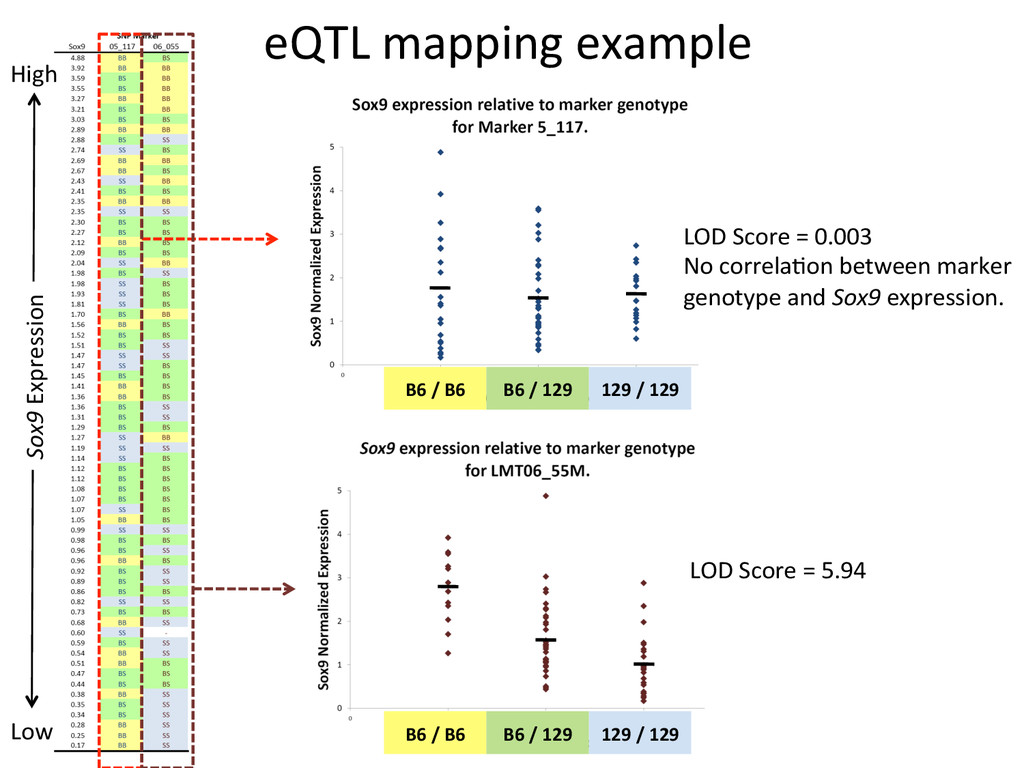
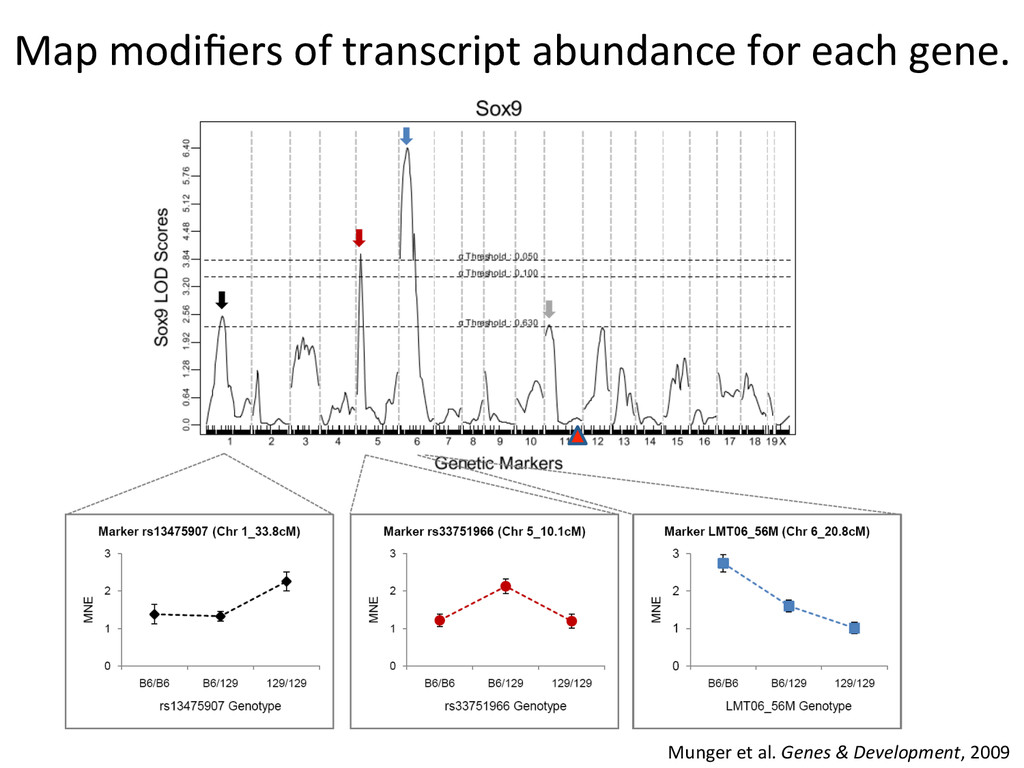
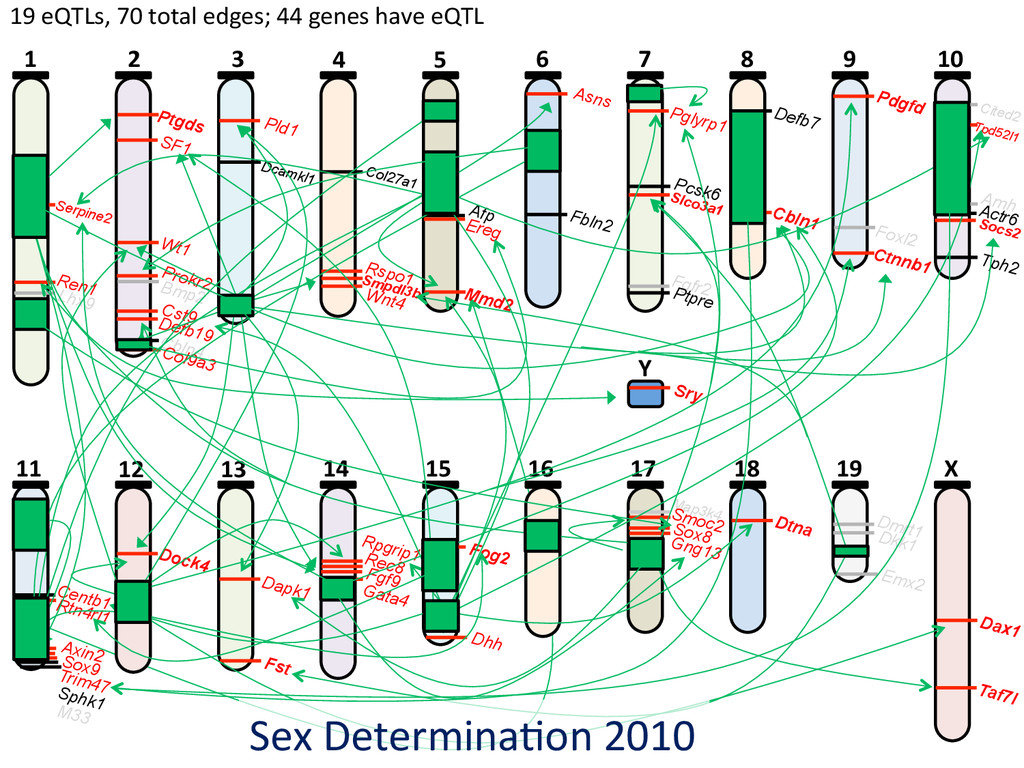
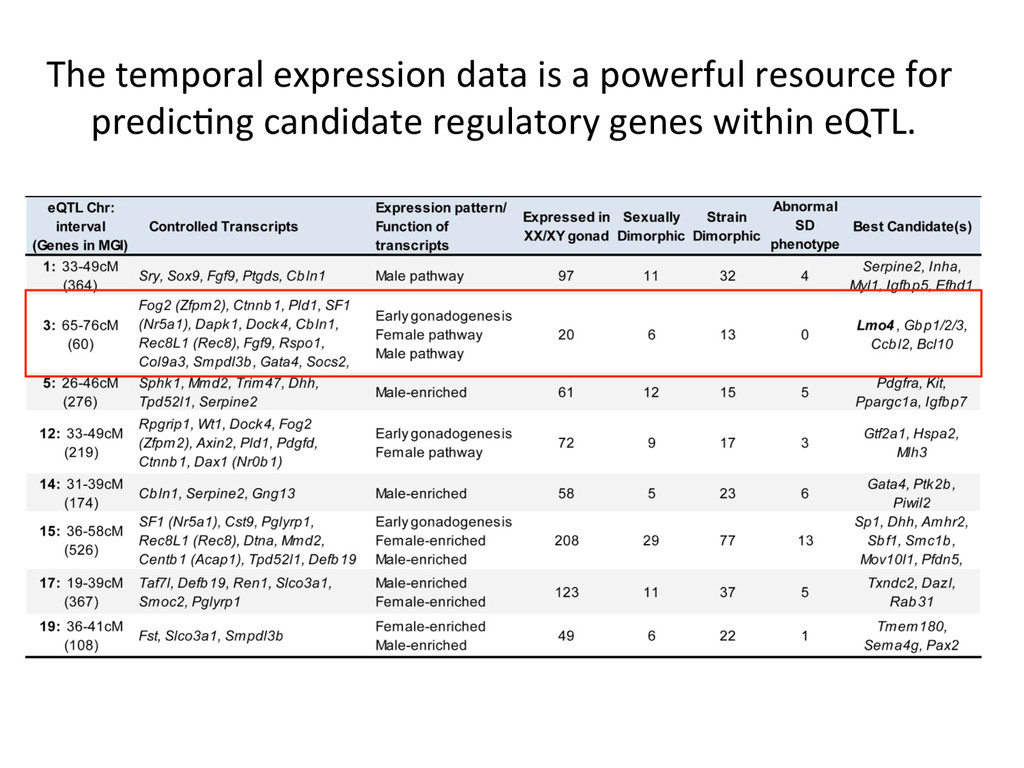
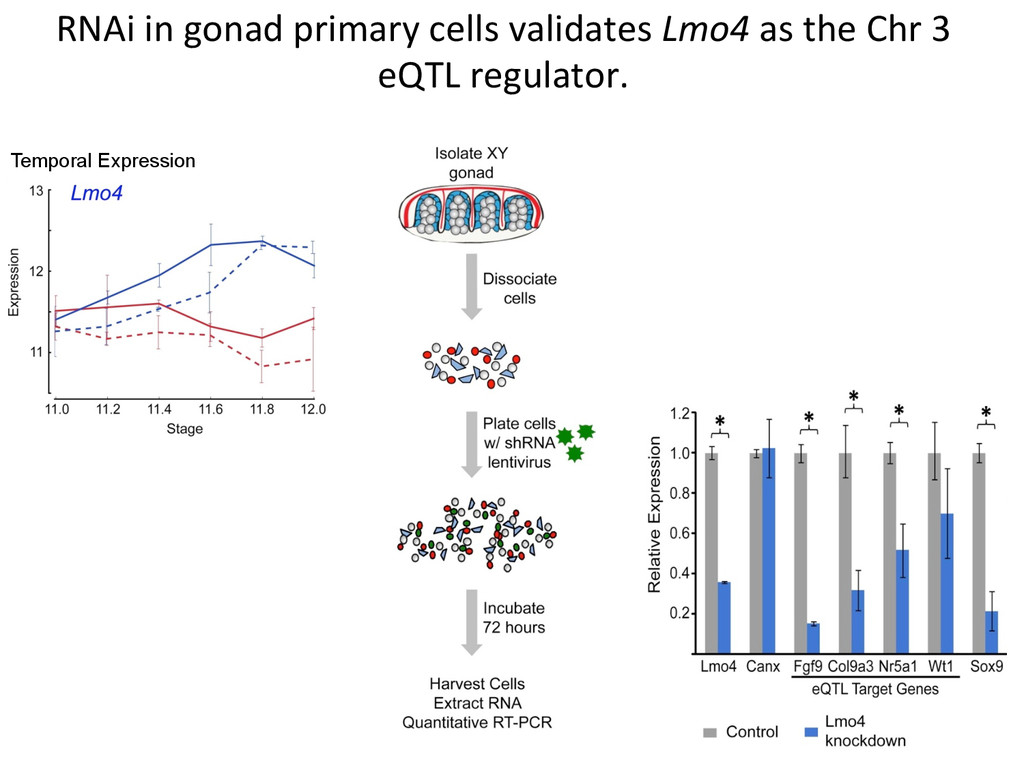
heritable, and we can map strain modifiers (eQTL). • The fine 7mecourse expression data enabled us to priori7ze candidates in eQTL intervals. • I developed a gonad primary cell assay and len7viral shRNA knockdown method to validate Lmo4 as a novel regulator of gonad gene expression. • But…
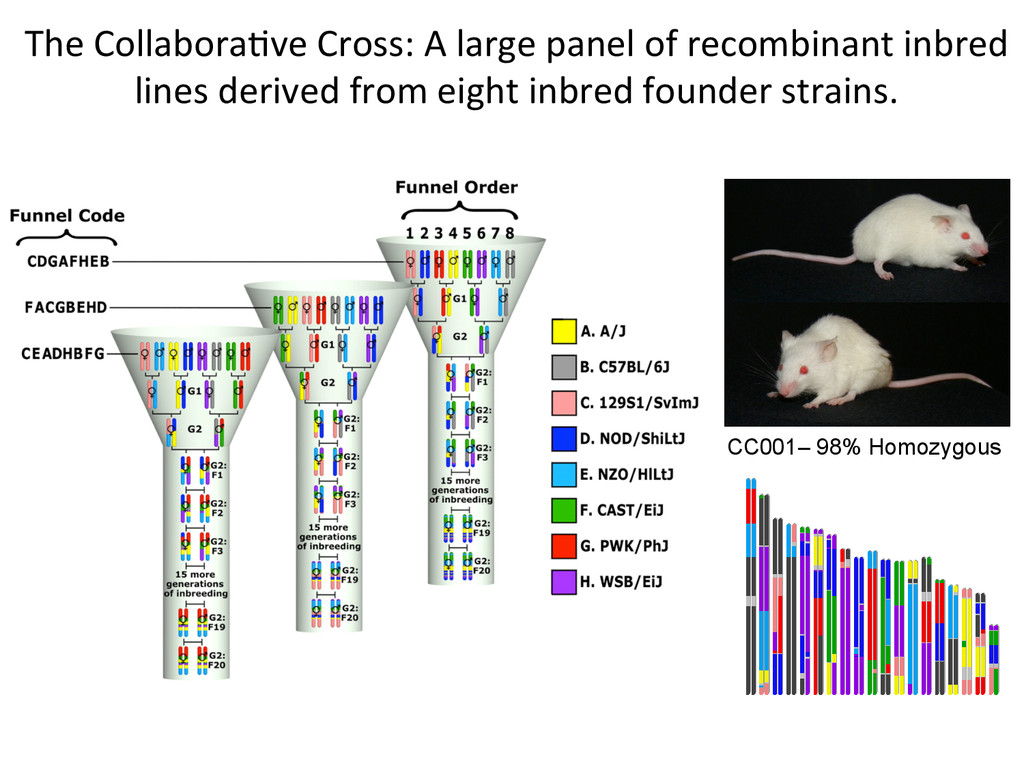
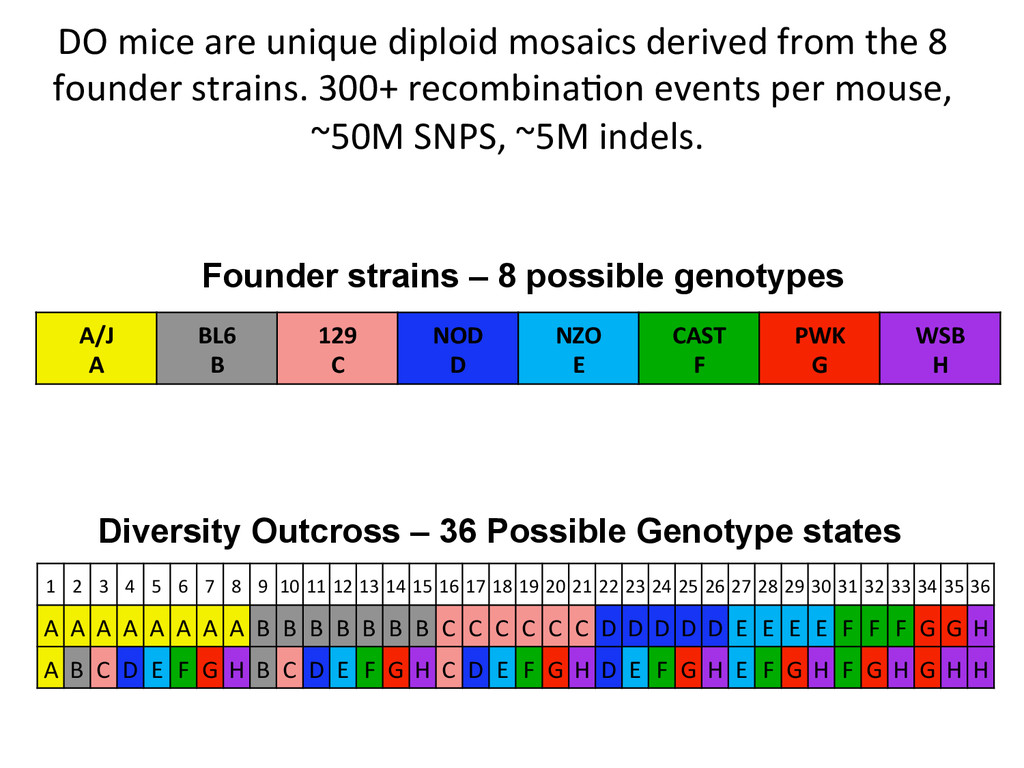
founder strains. 300+ recombina7on events per mouse, ~50M SNPS, ~5M indels. A/J A BL6 B 129 C NOD D NZO E CAST F PWK G WSB H 1 2 3 4 5 6 7 8 9 10 11 12 13 14 15 16 17 18 19 20 21 22 23 24 25 26 27 28 29 30 31 32 33 34 35 36 A A A A A A A A B B B B B B B C C C C C C D D D D D E E E E F F F G G H A B C D E F G H B C D E F G H C D E F G H D E F G H E F G H F G H G H H Founder strains – 8 possible genotypes Diversity Outcross – 36 Possible Genotype states
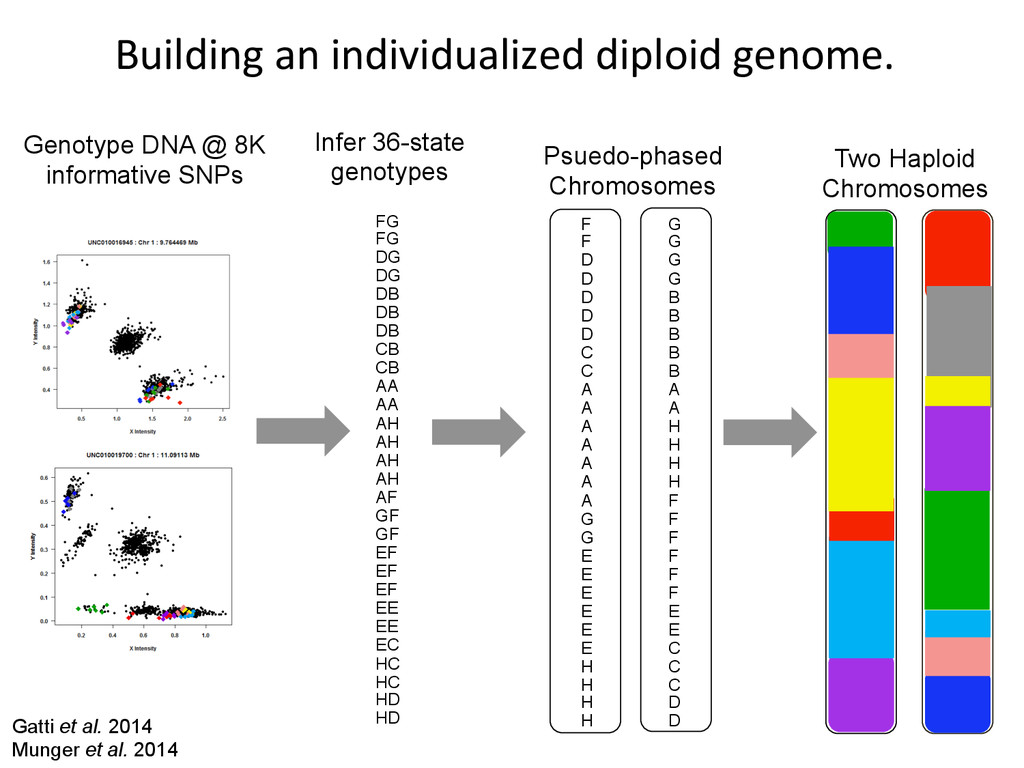
D D D C C A A A A A A A G G E E E E E E H H H H G G G G B B B B B A A H H H H F F F F F F E E C C C D D Psuedo-phased Chromosomes Two Haploid Chromosomes Genotype DNA @ 8K informative SNPs FG FG DG DG DB DB DB CB CB AA AA AH AH AH AH AF GF GF EF EF EF EE EE EC HC HC HD HD Infer 36-state genotypes Gatti et al. 2014 Munger et al. 2014
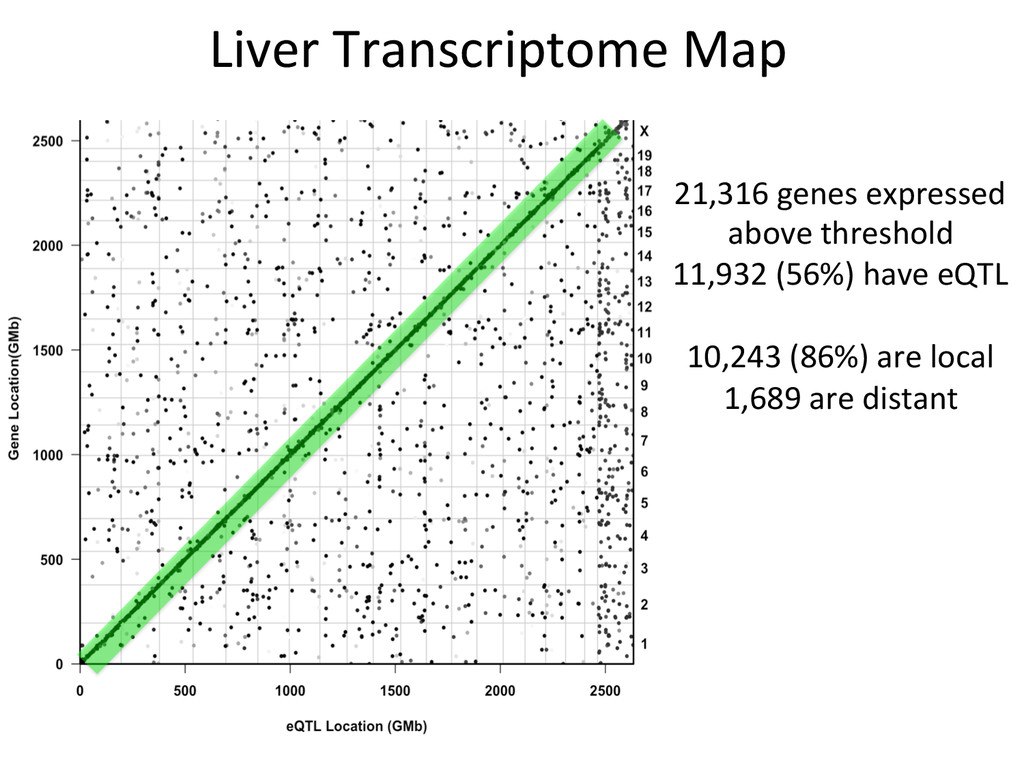
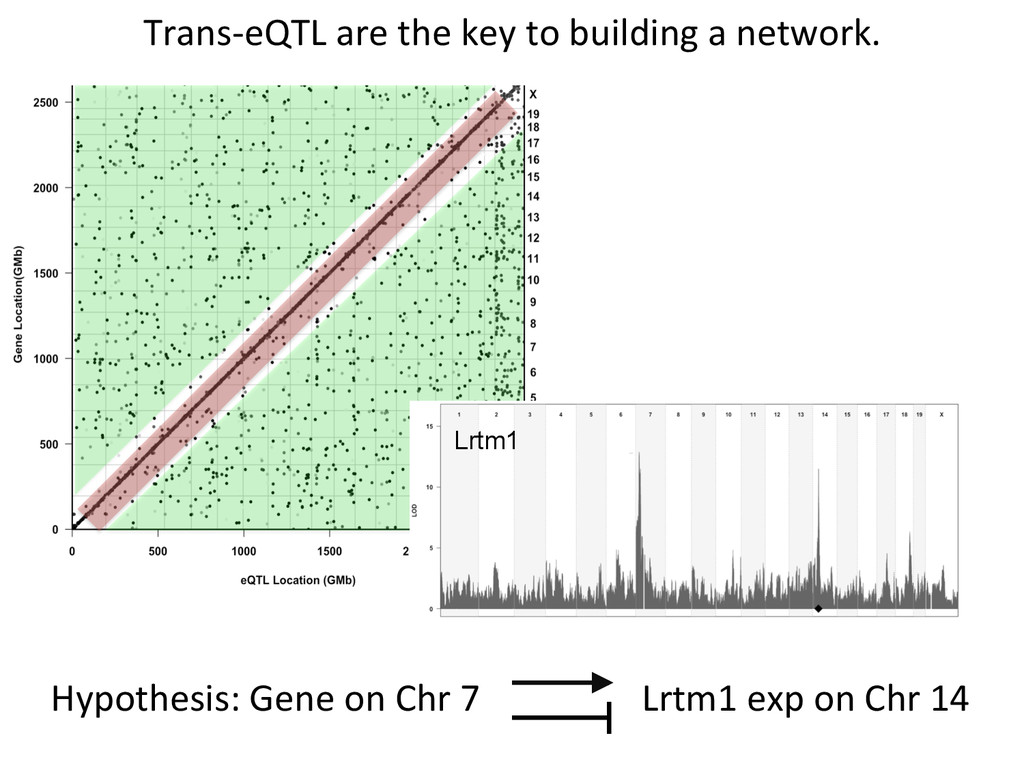
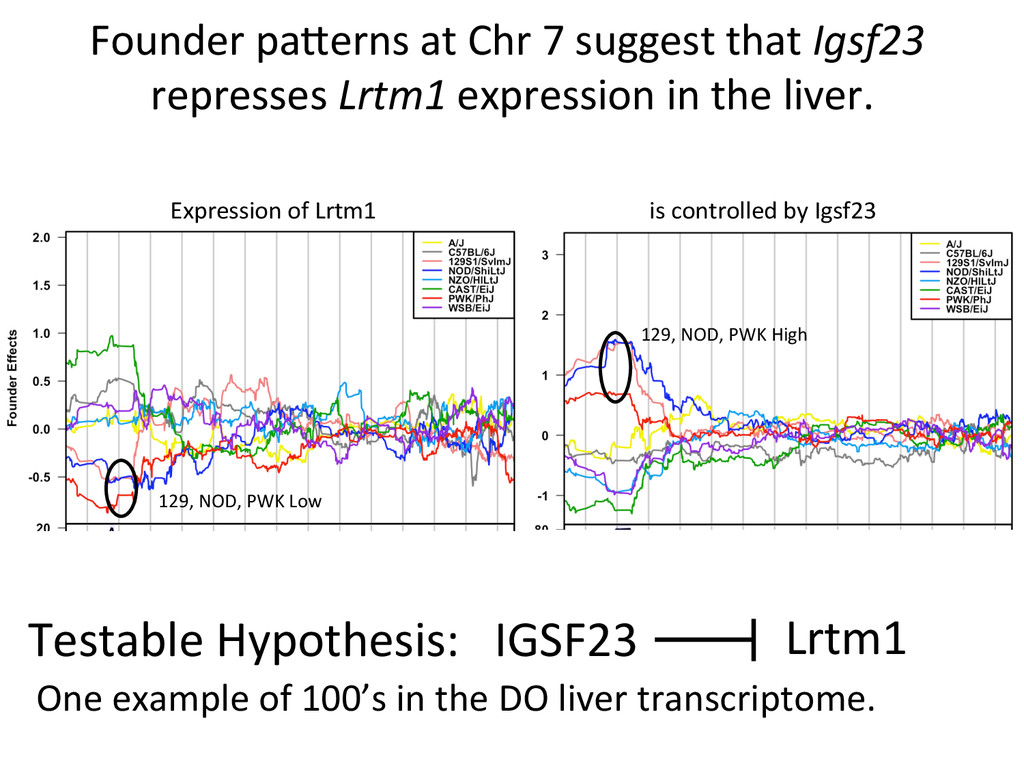
Lrtm1 expression in the liver. Expression of Lrtm1 129, NOD, PWK Low is controlled by Igsf23 129, NOD, PWK High Testable Hypothesis: IGSF23 Lrtm1 One example of 100’s in the DO liver transcriptome.
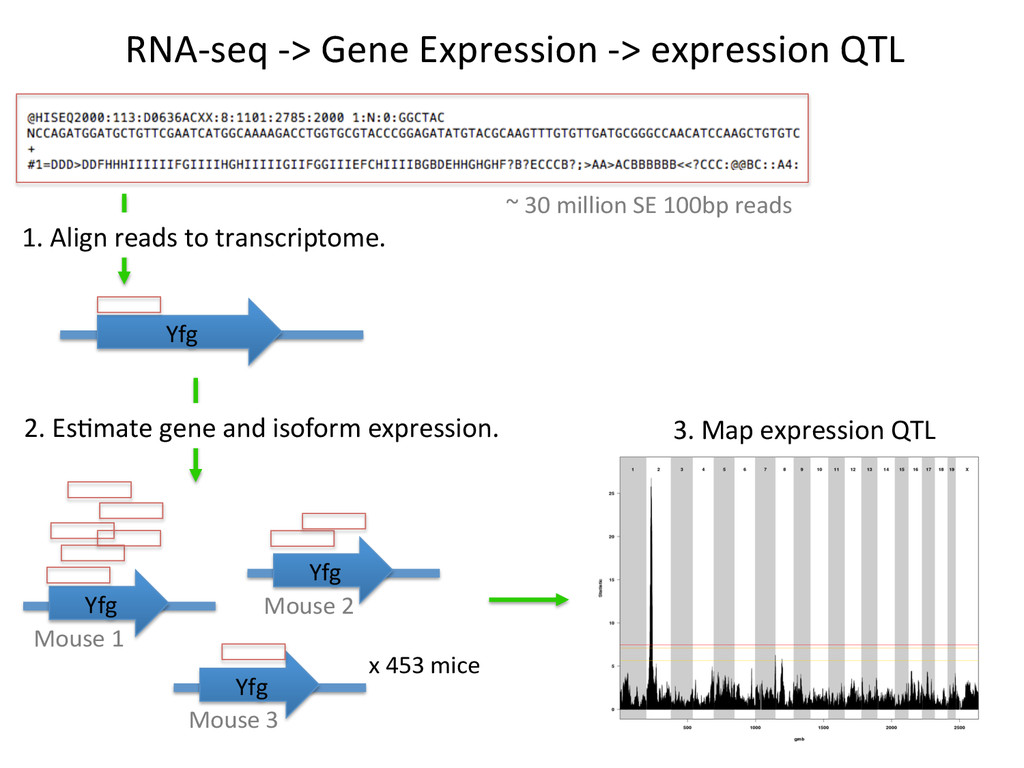
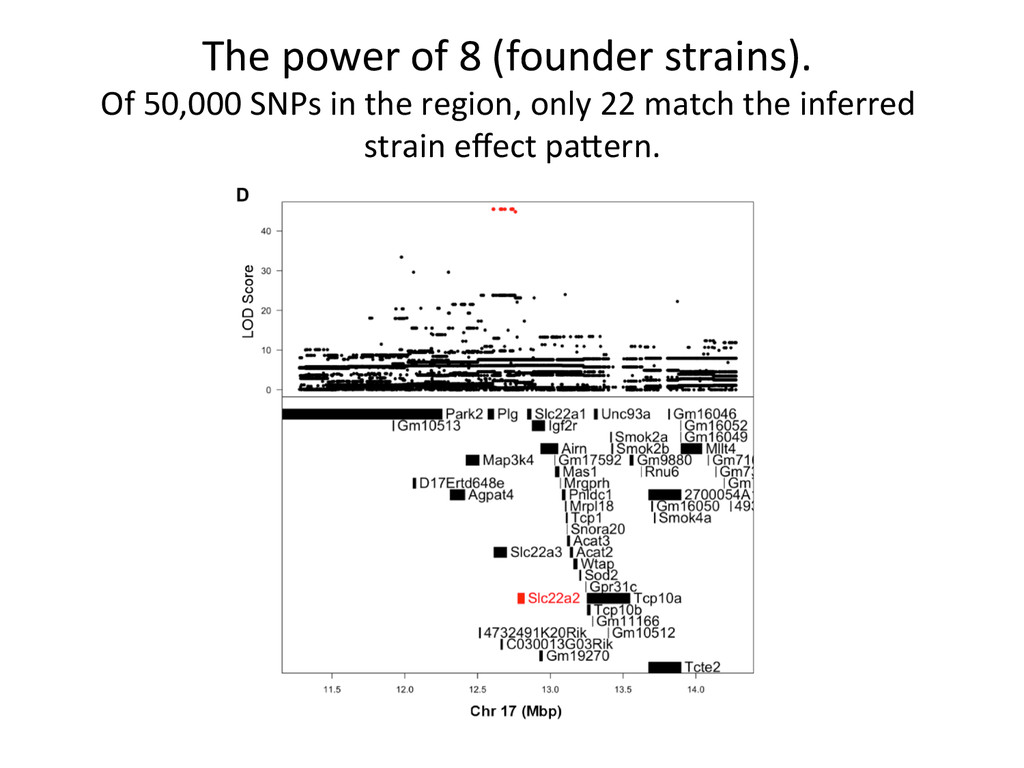
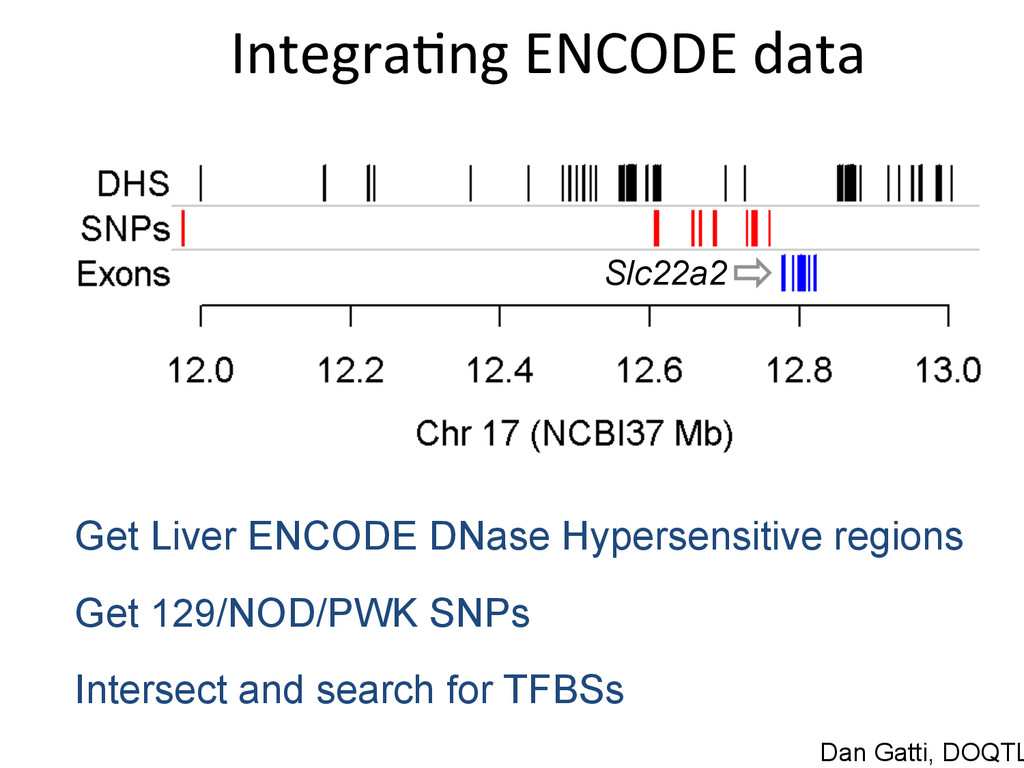
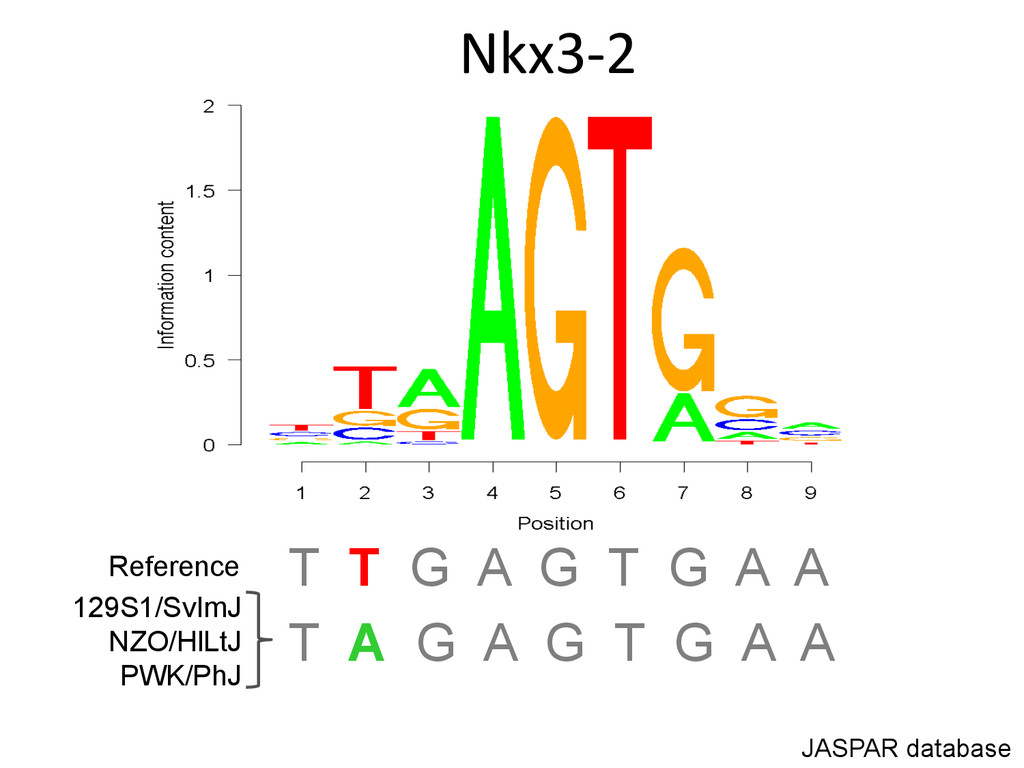
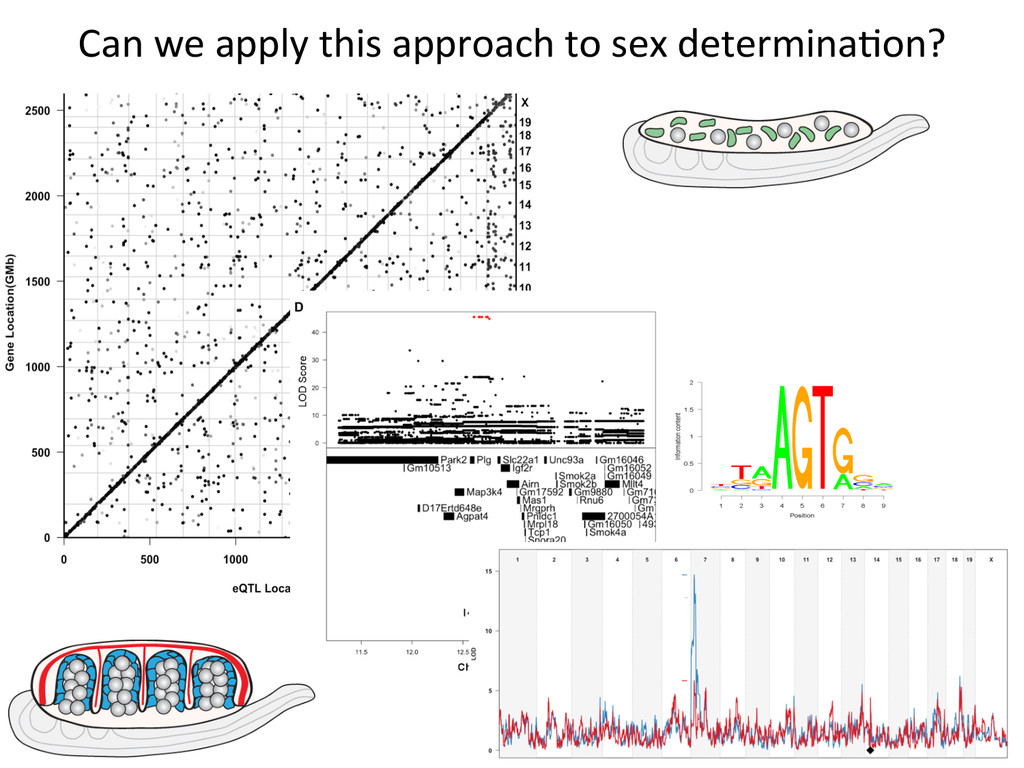
for high-‐resolu7on mapping of expression QTL. • We have developed methodology for dealing with exploi7ng the high gene7c diversity in this popula7on. • Combining mapping studies in gene7cally diverse popula7ons with mul7ple levels of “seq” data (RNA-‐ seq, Dnase I/ATAC-‐seq, ChIP-‐seq) provides the informa7on required to predict gene regulatory networks.
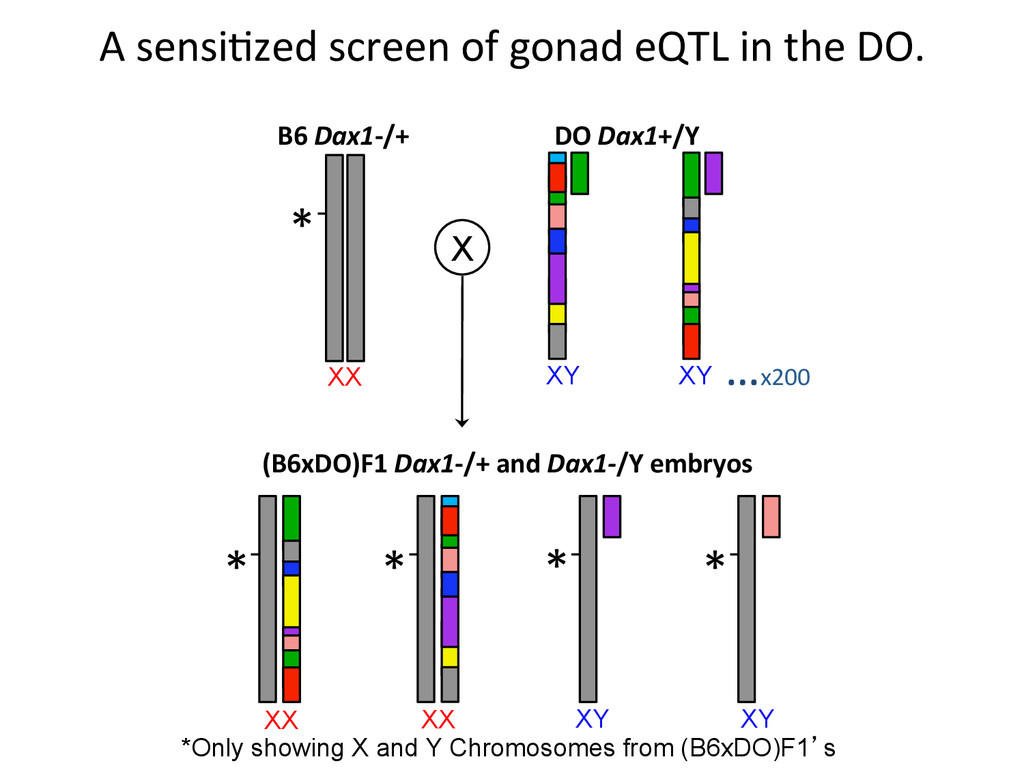
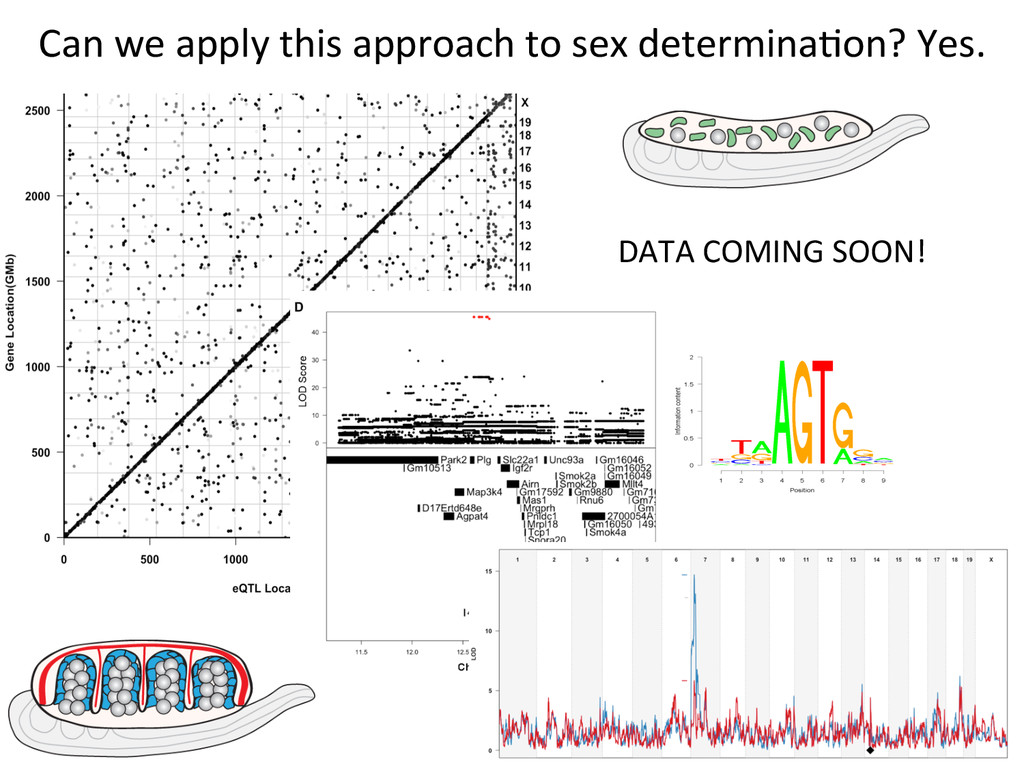
XX XY …x200 X DO Dax1+/Y B6 Dax1-‐/+ (B6xDO)F1 Dax1-‐/+ and Dax1-‐/Y embryos A sensi7zed screen of gonad eQTL in the DO. *Only showing X and Y Chromosomes from (B6xDO)F1’s
NCSU David Aylor -‐ UNC Paul Magwene – Duke Loren Looger – HHMI Eva Eicher -‐ JAX Funding Dept of Cell Biology Innova7on Award DUMC Bridge Funding Center for Systems Biology Seed Grant NICHD ARRA Supplement Equipment/Training Fernando Pardo-‐Manuel de Villena Tim Bell, Haider Ali Blanche Capel
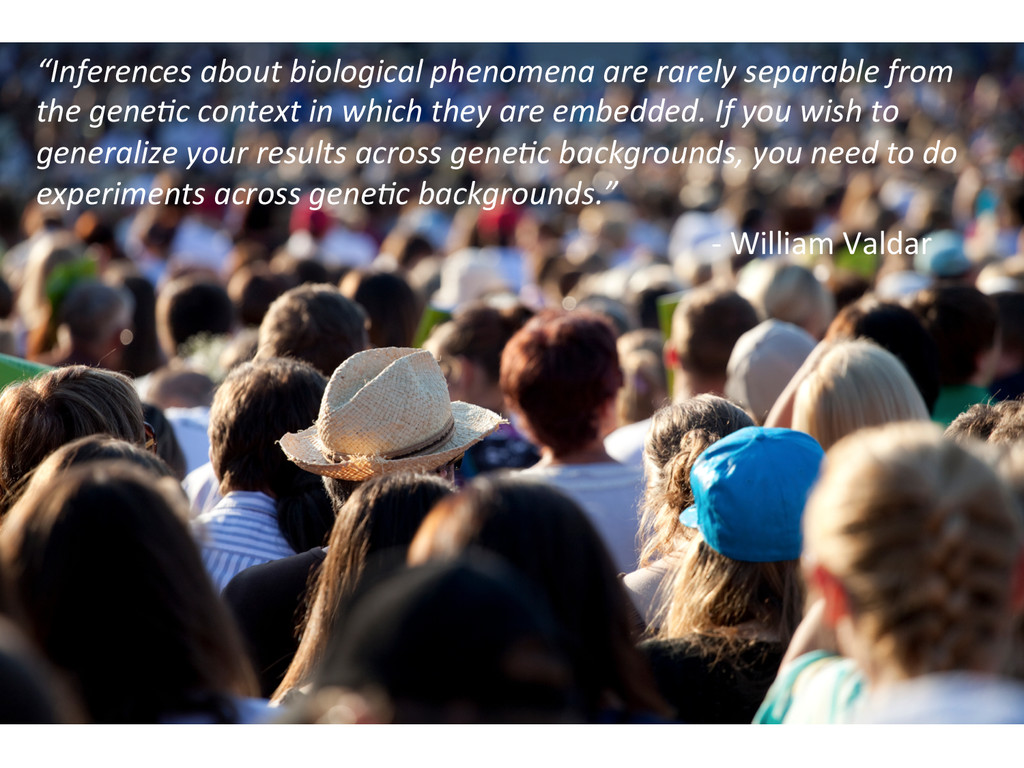
geneQc context in which they are embedded. If you wish to generalize your results across geneQc backgrounds, you need to do experiments across geneQc backgrounds.” -‐ William Valdar